. 2018 Nov 30:9:502-512.
doi: 10.1016/j.isci.2018.11.016. Epub 2018 Nov 12.

Keratocytes Generate High Integrin Tension at the Trailing Edge to Mediate Rear De-adhesion during Rapid Cell Migration

Affiliations

Keratocytes Generate High Integrin Tension at the Trailing Edge to Mediate Rear De-adhesion during Rapid Cell Migration

Yuanchang Zhao et al. iScience. .

Abstract

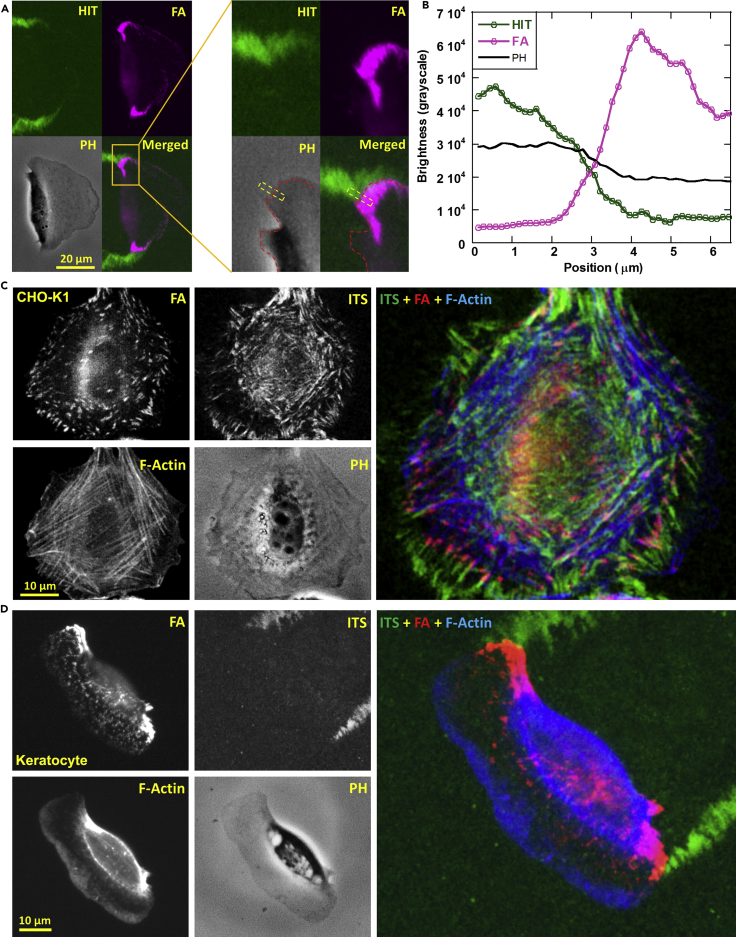
Rapid cell migration requires efficient rear de-adhesion. It remains undetermined whether cells mechanically detach or biochemically disassemble integrin-mediated rear adhesion sites in highly motile cells such as keratocytes. Using molecular tension sensor, we calibrated and mapped integrin tension in migrating keratocytes. Our experiments revealed that high-level integrin tension abbreviated as HIT, in the range of 50-100 pN (piconewton) and capable of rupturing integrin-ligand bonds, is exclusively and narrowly generated at cell rear margin during cell migration. Co-imaging of HIT and focal adhesions (FAs) shows that HIT is produced to mechanically peel off FAs that lag behind, and HIT intensity is correlated with the local cell retraction rate. High-level molecular tension was also consistently generated at the cell margin during artificially induced cell front retraction and during keratocyte migration mediated by biotin-streptavidin bonds. Collectively, these experiments provide direct evidence showing that migrating keratocytes concentrate force at the cell rear margin to mediate rear de-adhesion.

Keywords: Biomechanics; Biophysics; Functional Aspects of Cell Biology.


Figures

None
Graphical abstract
Figure 1
Figure 1
High-Level Integrin Tension (HIT) Is Exclusively Generated at Cell Rear Margin in Migrating Keratocytes (A) Schematics of integrative tension sensor (ITS). ITS is a surface-immobilized 18-bp dsDNA labeled by an integrin ligand and a fluorophore-quencher pair. ITS permanently turns to fluoresce if the tension transmitted by integrin-ligand bond ruptures the dsDNA, which has a tension tolerance (Ttol) of 54 pN. (B) Integrin tension (>54 pN) of a migrating keratocyte was mapped on the ITS surface by fluorescence imaging. Refer to Video S1. (C) Keratocytes produced no signal on the ligand-null ITS surface. (D) Keratocytes produced no fluorescence loss on the quencher-null ITS with Ttol determined by biotin-streptavidin bond strength (the ligand and the biotin are conjugated to the same strand). (E) Integrin tension (>54 pN) of a stationary CHO-K1 cell was mapped on the ITS surface. (F) Linear profile analysis of the image brightness in the regions marked by yellow dashed lines in (B). The sharp brightness increases in phase contrast (PH) and Cy3 (ITS) channels mark the cell margin and the active site of integrin tension generation, respectively. (G) Cell margin and ITS border represented by the peaks of derivative curves of linear profiles in (F). The peak locations are marked by red dashed lines.
Figure 2
Figure 2
Enhancing Integrin-Ligand Bond Strength with 2 mM Mn2+ Led to Stronger ITS Signal (A) Time-series HIT maps of a migrating keratocyte. At t = 7 min after starting imaging, 2 mM Mn2+ was added to the cell medium. The images were processed based on Video S2. (B) HIT map segmentation by time. This map region was processed from the area of Figure 2A marked by yellow dashed line. (C) ITS signal intensity analysis. The ITS signal was immediately increased by 2 mM Mn2+ by 2.5-fold, suggesting that integrin-ligand bond dissociation is in company with ITS activation under normal physiological condition, and ITS signal can report the location where integrin-ligand bonds are mechanically dissociated. The ITS signal was calculated by averaging the grayscale values of pixels in the rectangular grids in Figure 2B.
Figure 3
Figure 3
HIT Occurs at the Edge of Focal Adhesions (FAs) Coinciding with Cell Rear Margin (A) Co-imaging of HIT map, phase contrast (PH), and FAs immunostained with vinculin antibody. (B) Line profiles of HIT, FA, and phase contrast imaging in the rectangular region marked by the yellow dashed line in (A), showing that HIT map, FAs, and the cell margin share a thin border, and only integrins at the edges of FAs coinciding with membrane margin transmit HIT. (C) Co-imaging of HIT and cellular structures, including FAs, F-actin, and cell membrane, in a CHO-K1 cell. HIT was produced in most FAs underneath cells. (D) Co-imaging of HIT and cell structures in a keratocyte. HIT was exclusively produced at the cell rear margin.
Figure 4
Figure 4
Correlation between Real-Time HIT Intensity and Cell Membrane Retraction (A) Time-lapse ITS imaging (Ttol = 54 pN). The second column shows the cell membrane contours in two consecutive imaging frames with a frame interval of 20 s. Green contour is for the cell in current frame, and magenta contour is for the cell in the previous frame. Real-time HIT marked by ITS signal gain (green) was acquired by subtracting the previous frame from a current frame of ITS imaging. Real-time HIT represents the integrin tension signals produced in the latest 20 s. Refer to Video S3. (B) A scatterplot of the local real-time HIT intensity and the corresponding membrane retraction intensity (defined as the square of local membrane retraction distance at the ITS signal region). (C) Real-time HIT intensity versus time.
Figure 5
Figure 5
ITS Signal during Acutely Induced Cell Front Retraction and Biotin-Streptavidin Bond-Mediated Keratocyte Migration, Respectively (A) Time-series of HIT maps in keratocytes after a treatment with hypertonic medium (cell culture medium spiked with 150 mM sucrose). HIT signal is colored in green, and real-time HIT (HIT gained in the latest 10 s) is colored in red. Hypertonic medium was added at t = 0 s. The induced local cell membrane retraction sites are marked by orange arrows. Refer to Video S4. (B) Zoom-in images of HIT map and the cell membrane. The width of real-time HIT region is 0.45 μm. (C) Cell membrane proteins of keratocytes were biotinylated. Keratocytes adhered and migrated by biotin-streptavidin interaction instead of integrin-ligand binding. Molecular tension transmitted by biotin-streptavidin bonds during keratocyte migration was recorded by modified ITS that is conjugated to BSA and immobilized on the surface by physical adsorption. (D) Time-lapse images of a keratocyte that migrated via biotin-streptavidin bonds. ITS signal was consistently generated at the cell rear margin during this integrin-independent cell migration. Refer to Video S5. (E) Co-localization analysis of cell margin and tension map indicates that tension transmitted by the biotin-streptavidin bond was still generated at the cell rear margin in the integrin-independent migration. The line profile of map was analyzed on the region marked by the yellow rectangle in (B). Line profile was obtained by averaging the rows of the rectangular region.

References

    1. Barnhart E.L., Allen G.M., Julicher F., Theriot J.A. Bipedal locomotion in crawling cells. Biophys. J. 2010;98:933–942. - PMC - PubMed
    1. Carragher N.O., Frame M.C. Focal adhesion and actin dynamics: a place where kinases and proteases meet to promote invasion. Trends Cell Biol. 2004;14:241–249. - PubMed
    1. Crisalli P., Kool E.T. Multi-path quenchers: efficient quenching of common fluorophores. Bioconjugate Chem. 2011;22:2345–2354. - PMC - PubMed
    1. Even-Ram S., Doyle A.D., Conti M.A., Matsumoto K., Adelstein R.S., Yamada K.M. Myosin IIA regulates cell motility and actomyosin microtubule crosstalk. Nat. Cell Biol. 2007;9:299–309. - PubMed
    1. Franco S.J., Huttenlocher A. Regulating cell migration: calpains make the cut. J. Cell Sci. 2005;118:3829–3838. - PubMed