. 2018 Nov 20;10(11):3397-3420.
doi: 10.18632/aging.101655.

Cell cycle-dependent and -independent telomere shortening accompanies murine brain aging

Affiliations

Cell cycle-dependent and -independent telomere shortening accompanies murine brain aging

Quratul Ain et al. Aging (Albany NY). .

Abstract

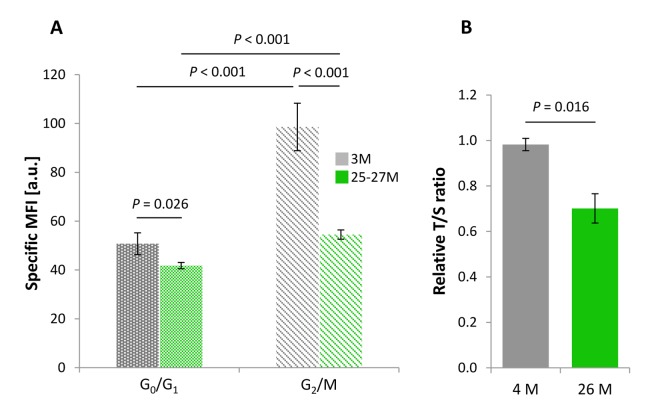
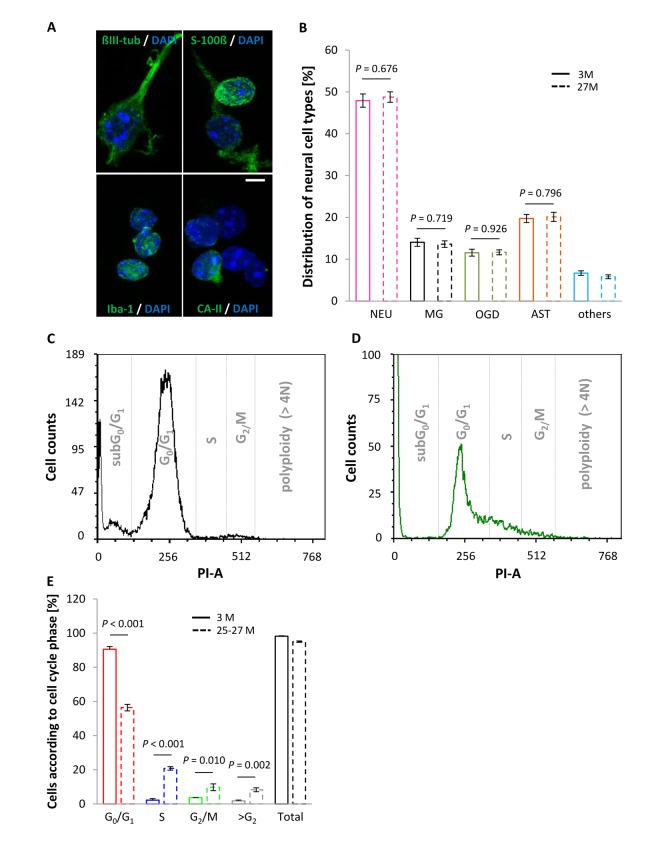
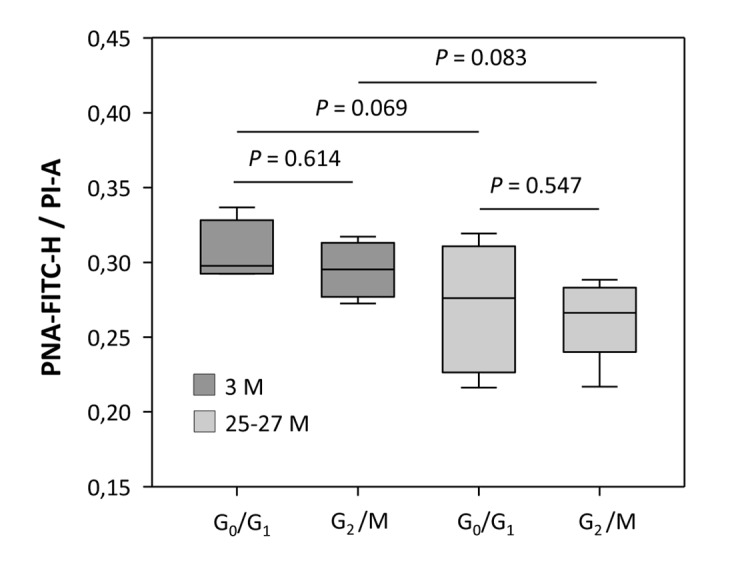
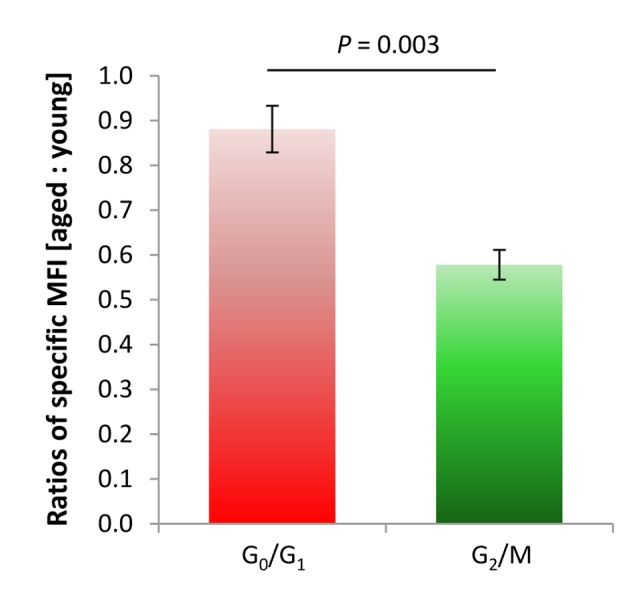
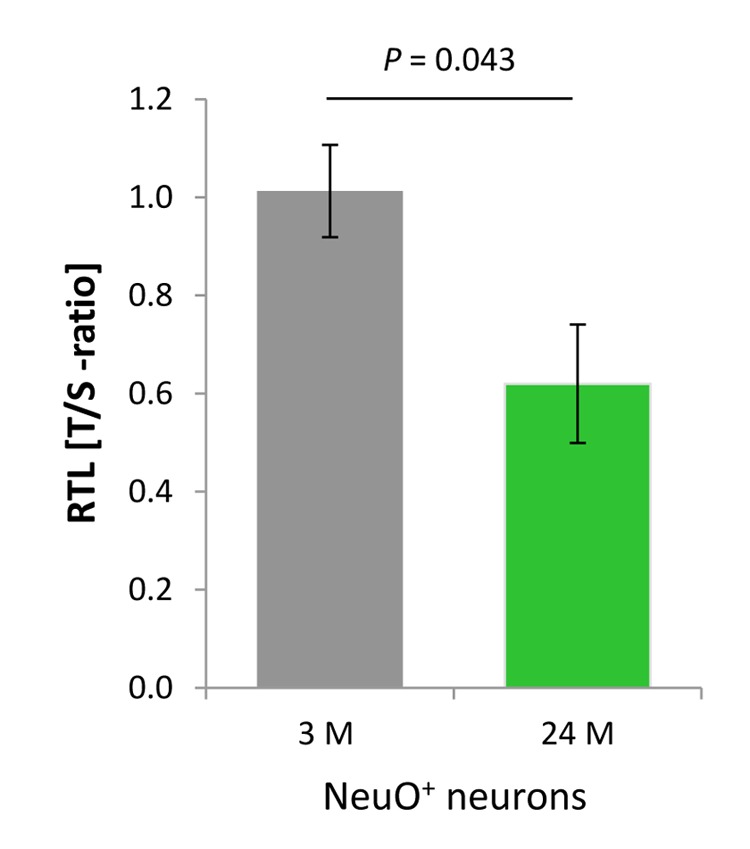
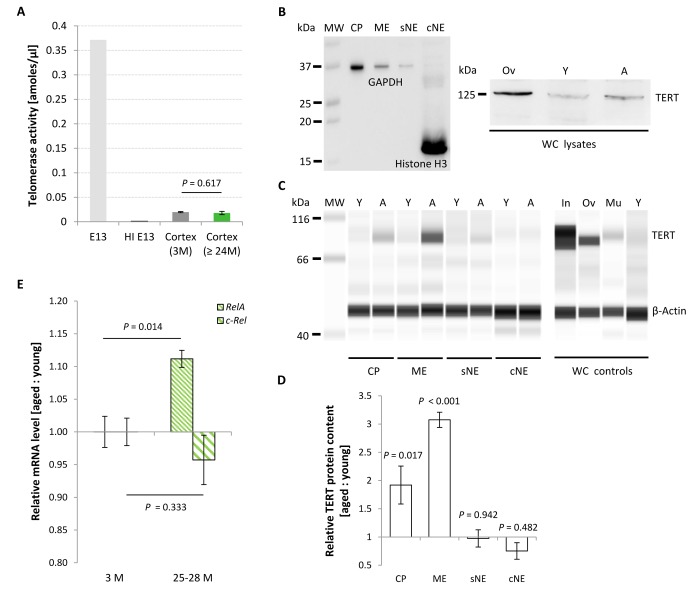
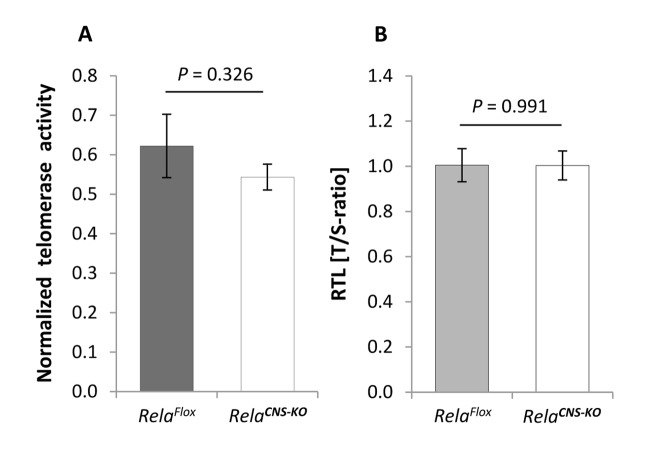
Replication-based telomere shortening during lifetime is species- and tissue-specific, however, its impact on healthy aging is unclear. In particular, the contribution of telomere truncation to the aging process of the CNS, where replicative senescence alone fails to explain organ aging due to low to absent mitotic activity of intrinsic populations, is undefined. Here, we assessed changes in relative telomere length in non-replicative and replicative neural brain populations and telomerase activity as a function of aging in C57BL/6 mice. Telomeres in neural cells and sub-selected neurons shortened with aging in a cell cycle-dependent and -independent manner, with preponderance in replicative moieties, implying that proliferation accelerates, but is not prerequisite for telomere shortening. Consistent with this telomere erosion, telomerase activity and nuclear TERT protein were not induced with aging. Knockdown of the Rela subunit of NF-κB, which controls both telomerase enzyme and subcellular TERT protein allocation, did also not influence telomerase activity or telomere length, in spite of its naive up-regulation selectively under aging conditions. We conclude that telomere instability is intrinsic to physiological brain aging beyond cell replication, and appears to occur independently of a functional interplay with NF-κB, but rather as a failure to induce or relocate telomerase.

Keywords: RelA subunit of nuclear factor kappa B; brain aging; cell cycle; cellular senescence; telomerase reverse transcriptase; telomere length.


Conflict of interest statement

CONFLICTS OF INTEREST: Each of the authors declares that there is no conflict of interest.

Figures

Figure 1
Figure 1
Age-dependent changes in the RTL of cortical neural cell isolates. (A) RTL assessed by Flow-FISH as a function of cell cycle activity. PNA-FITC-related mean fluorescence intensity corrected against background signal (specific MFI) was taken as an indirect parameter for RTL in cells at G0/G1 and G2/M phases of the cell cycle. For both cell populations, a significant age-related reduction in RTL was observed. Bars represent means ± SEM (n = 4 - 8). P-values were assessed with Two-way ANOVA. (B) Cell cycle-independent measurement of RTL assessed by qPCR and determined in terms of a relative T/S-ratio that was referenced against a 4-month-old control group. RTL declined significantly in cortical neural cells of aged as compared to young samples, thus confirming the results obtained in (A). Bars represent means ± SEM (n = 3 - 4). P-values were calculated using the Student’s t-test.
Figure 2
Figure 2
Neural cell type proportions and DNA content in the vital fraction of cortical cell isolates as a function of age. (A) Cellular entities were identified by applying cell type-specific markers, using ßIII-tubulin, S100-ß, Iba-1 and CA-II for neurons, astrocytes, microglia and oligodendrocytes, respectively, with cell nuclei being discriminated by DAPI. Scale bar, 5 µm. (B) Cell type-specific proportions did not vary between young and aged mice. NEU, neurons; MG, microglia; OGD, oligodendrocytes; AST, astrocytes. Bars represent means ± SEM (n = 500 cells out of 3 animals per condition). (C and D) Representative DNA histograms illustrating an age-associated shift in cell cycle activity, as assessed by PI staining of DNA from murine cortical neural cell isolates at an age of 3 months (C) and 25-27 months (D). (E) Neocortical cell constituents derived from aged animals showed a shift towards replicative cell cycle phases, marked by a significant increase in the proportion of cells in S, G2/M and >G2 phase, whereas the percentage of cells in G0/G1 phase declined significantly at higher age. Bars represent means ± SEM (n = 4 - 8). For (B and E) P-values were calculated using the Student’s t-test.
Figure 3
Figure 3
Relationship between telomere-related DNA and the total DNA content at different cell cycle phases, assessed for young and aged cortical neural cell isolates. Telomere-related DNA (PNA-Fluorescein Isothiocyanate height [PNA-FITC-H]-specific MFI) was normalized against the total DNA content (propidium iodide area [PI-A]-specific MFI). The ratio of PNA-FITC-related MFI corrected against the DNA content of G0/G1 and G2/M phase displayed stable values for both young and aged groups. Bars represent means ± SEM (n = 4 - 8). P-values were calculated using the Student’s t-test.
Figure 4
Figure 4
Rate of age-dependent changes in RTL of cortical neural isolates from murine neocortex, for G0/G1 and G2/M phases of the cell cycle. A lower specific MFI ratio between aged and young specimens for G2/M-phase cells as compared to a more stable specific MFI ratio for moieties arrested at G0/G1 phase reflected a substantial age-related decline in RTL in replicative cell entities in the murine cortex over lifetime. Bars represent means ± SEM (n = 4 - 8). P-values were calculated using Student’s t-test.
Figure 5
Figure 5
Age-dependent telomere length dynamics in the neuronal fraction sorted from murine cortical isolates. NeuO+ neurons showed a significant age-related decline in RTL as determined by qPCR in terms of telomere repeat (T) to single copy gene (S) ratio. Bars represent means ± SEM (n = 4). P-values were calculated using Student’s t-test.
Figure 6
Figure 6
Age-associated changes in TERT protein content, telomerase activity and relative Rela and c-Rel expression levels in the murine cortex. (A) Telomerase activity assessed from cortical isolates as a function of age. Telomerase activity in the mature neocortex remained unchanged with aging, displaying activity levels approximately 20 times lower than in E13 brain. Bars of probe samples represent means ± SEM (n = 5). HI E13, heat inactivated E13 protein extract. (B-D) Relative TERT protein levels in different subcellular compartments of murine cortical tissue at young (Y) and aged (A) states. (B) Left blot: Conventional Western blot. Purity of the cellular subfractions is illustrated by the enriched levels of the nuclear and cytoplasmic marker proteins Histone H3 and GAPDH in the chromatin-bound nuclear (cNE) and cytoplasmic (CP) fractions, respectively. Right blot: TERT product at the appropriate molecular weight of ~ 125 kDa in whole cell (WC) lysates from ovary (Ov) and cortex of young (Y) and aged (A) mice. (C) Simple Western™ technique. Little or no TERT protein was expressed in the soluble nuclear (sNE) and chromatin-bound nuclear (cNE) fraction, respectively, at both age categories, whereas TERT protein was found at significantly higher levels in the cytoplasmic (CP) and membrane (ME) fractions at 27 months of age. Specificity of the TERT antibody was proven by the detection of different TERT protein levels in whole cell (WC) lysates prepared from small intestine (In), ovary (Ov), muscle (Mu) and cortex of young mice (Y). All cortical samples were assayed in the same run, as were all the control samples. (D) Quantification of the compartment-specific TERT protein levels for young and old cortices as illustrated in (C). Bars represent means ± SEM (n = 3), and were reproduced in two independent runs. (E) Age-associated changes in relative mRNA levels of the subunits Rela and c-Rel of canonical NF-κB. Rela transcription levels increased significantly at advanced ages, whereas levels of c-Rel remained unaltered. Ratios represent geometric means of n = 5 animals ± SEM. P-values were calculated using Student’s t-test (A) and Two-way ANOVA (D and E).
Figure 7
Figure 7
Telomerase activity and telomere length in the brain of aged RelaCNS-KO mice. (A) Telomerase activity, normalized against a positive HeLA cell extract, in the cortex of 18-23 months old RelaCNS-KO mice compared to age-matched RelaFlox control mice (n = 4 - 6). (B) RTL in cortical neural cells isolated from 19-20 months old RelaCNS-KO as assessed by qPCR in terms of T/S-ratios and normalized against aged-matched RelaFlox control animals (n = 3 - 4). Bars represent means ± S.E.M. P values were calculated by Student’s t-test.

References

    1. Harley CB, Futcher AB, Greider CW. Telomeres shorten during ageing of human fibroblasts. Nature. 1990; 345:458–60. 10.1038/345458a0 - DOI - PubMed
    1. Rudolph KL, Chang S, Lee HW, Blasco M, Gottlieb GJ, Greider C, DePinho RA. Longevity, stress response, and cancer in aging telomerase-deficient mice. Cell. 1999; 96:701–12. 10.1016/S0092-8674(00)80580-2 - DOI - PubMed
    1. Takubo K, Izumiyama-Shimomura N, Honma N, Sawabe M, Arai T, Kato M, Oshimura M, Nakamura K. Telomere lengths are characteristic in each human individual. Exp Gerontol. 2002; 37:523–31. 10.1016/S0531-5565(01)00218-2 - DOI - PubMed
    1. Takubo K, Aida J, Izumiyama-Shimomura N, Ishikawa N, Sawabe M, Kurabayashi R, Shiraishi H, Arai T, Nakamura K. Changes of telomere length with aging. Geriatr Gerontol Int. 2010. (Suppl 1); 10:S197–206. 10.1111/j.1447-0594.2010.00605.x - DOI - PubMed
    1. Samassekou O, Gadji M, Drouin R, Yan J. Sizing the ends: normal length of human telomeres. Ann Anat. 2010; 192:284–91. 10.1016/j.aanat.2010.07.005 - DOI - PubMed

Publication types