

Machine Learning and Imaging Informatics in Oncology
- PMID: 30472716
- PMCID: PMC6533165
- DOI: 10.1159/000493575
Machine Learning and Imaging Informatics in Oncology
Abstract
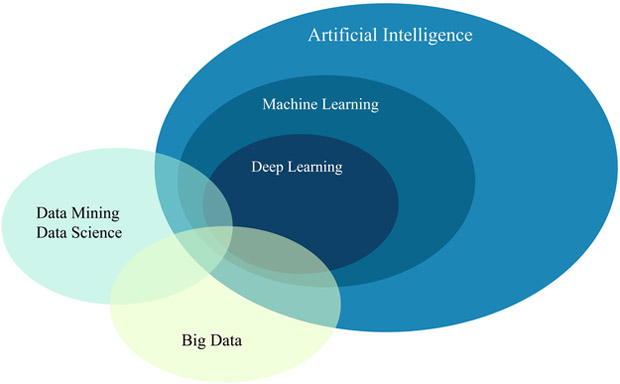
In the era of personalized and precision medicine, informatics technologies utilizing machine learning (ML) and quantitative imaging are witnessing a rapidly increasing role in medicine in general and in oncology in particular. This expanding role ranges from computer-aided diagnosis to decision support of treatments with the potential to transform the current landscape of cancer management. In this review, we aim to provide an overview of ML methodologies and imaging informatics techniques and their recent application in modern oncology. We will review example applications of ML in oncology from the literature, identify current challenges and highlight future potentials.
Keywords: Imaging informatics; Machine learning; Oncology.
© 2018 S. Karger AG, Basel.
Conflict of interest statement
Disclosure Statement
The authors have no conflicts of interest to declare.
Figures

Similar articles
-
Realizing the promise of machine learning in precision oncology: expert perspectives on opportunities and challenges.BMC Cancer. 2025 Feb 17;25(1):276. doi: 10.1186/s12885-025-13621-2. BMC Cancer. 2025. PMID: 39962436 Free PMC article.
-
An Assessment of Imaging Informatics for Precision Medicine in Cancer.Yearb Med Inform. 2017 Aug;26(1):110-119. doi: 10.15265/IY-2017-041. Epub 2017 Sep 11. Yearb Med Inform. 2017. PMID: 29063549 Free PMC article. Review.
-
A Quantitative Paradigm for Decision-Making in Precision Oncology.Trends Cancer. 2021 Apr;7(4):293-300. doi: 10.1016/j.trecan.2021.01.006. Epub 2021 Feb 23. Trends Cancer. 2021. PMID: 33637444 Review.
-
From Patient Engagement to Precision Oncology: Leveraging Informatics to Advance Cancer Care.Yearb Med Inform. 2020 Aug;29(1):235-242. doi: 10.1055/s-0040-1701983. Epub 2020 Aug 21. Yearb Med Inform. 2020. PMID: 32823322 Free PMC article. Review.
-
Are we at a crossroads or a plateau? Radiomics and machine learning in abdominal oncology imaging.Abdom Radiol (NY). 2019 Jun;44(6):1985-1989. doi: 10.1007/s00261-018-1613-1. Abdom Radiol (NY). 2019. PMID: 29730736
Cited by
-
Large-Scale Integration of DICOM Metadata into HL7-FHIR for Medical Research.Methods Inf Med. 2024 Sep;63(3-04):77-84. doi: 10.1055/a-2521-4250. Epub 2025 Apr 15. Methods Inf Med. 2024. PMID: 40233823 Free PMC article.
-
Using Machine Learning Approaches on Dynamic Patient-Reported Outcomes to Cluster Cancer Treatment-Related Symptoms.Curr Oncol. 2025 Jun 6;32(6):334. doi: 10.3390/curroncol32060334. Curr Oncol. 2025. PMID: 40558277 Free PMC article.
-
Leveraging the Academic Artificial Intelligence Silecosystem to Advance the Community Oncology Enterprise.J Clin Med. 2023 Jul 21;12(14):4830. doi: 10.3390/jcm12144830. J Clin Med. 2023. PMID: 37510945 Free PMC article.
-
Deep Neural Networks and Transfer Learning on a Multivariate Physiological Signal Dataset.Bioengineering (Basel). 2021 Mar 6;8(3):35. doi: 10.3390/bioengineering8030035. Bioengineering (Basel). 2021. PMID: 33800842 Free PMC article.
-
Oncology Informatics: Status Quo and Outlook.Oncology. 2020;98(6):329-331. doi: 10.1159/000507586. Epub 2020 May 14. Oncology. 2020. PMID: 32408309 Free PMC article. Review.
References
-
- Mitchell TM et al., “Machine learning. wcb,” 1997.
-
- Huang S-H and Pan Y-C, “Automated visual inspection in the semiconductor industry: A survey,” Computers in Industry, vol. 66, pp. 1 – 10, 2015. [Online]. Available: http://www.sciencedirect.com/science/article/pii/S0166361514001845
-
- LLC G. (2018) Google cloud speech-to-text enables developers to convert audio to text by applying powerful neural network models in an easy to use api. [Online]. Available: https://cloud.google.com/speech-to-text/
-
- Ciocca S. (2017) How does spotify know you so well? [Online]. Available: https://medium.com/s/story/spotifys-discover-weekly-how-machine-learning...
-
- Kooti F, Grbovic M, Aiello LM, Djuric N, Radosavljevic V, and Lerman K, “Analyzing uber’s ride-sharing economy,” in Proceedings of the 26th International Conference on World Wide Web Companion International World Wide Web Conferences Steering Committee, 2017, pp. 574–582.
Publication types
MeSH terms
Grants and funding
LinkOut - more resources
Full Text Sources
Medical
