. 2018 Nov 21;100(4):977-993.e7.
doi: 10.1016/j.neuron.2018.10.010. Epub 2018 Oct 25.

Spatial and Temporal Organization of the Individual Human Cerebellum

Affiliations

Spatial and Temporal Organization of the Individual Human Cerebellum

Scott Marek et al. Neuron. .

Abstract

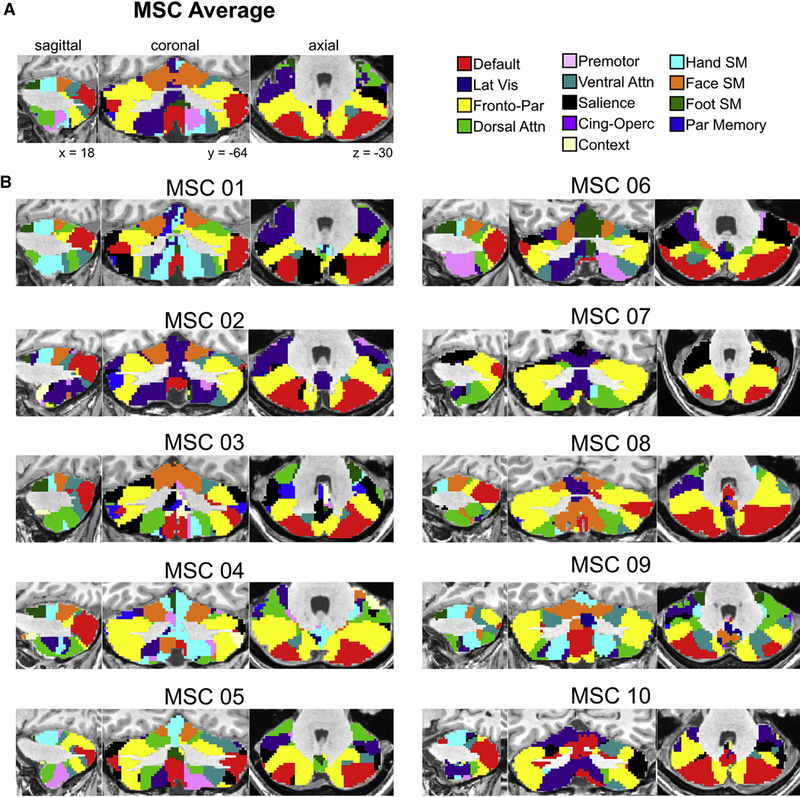
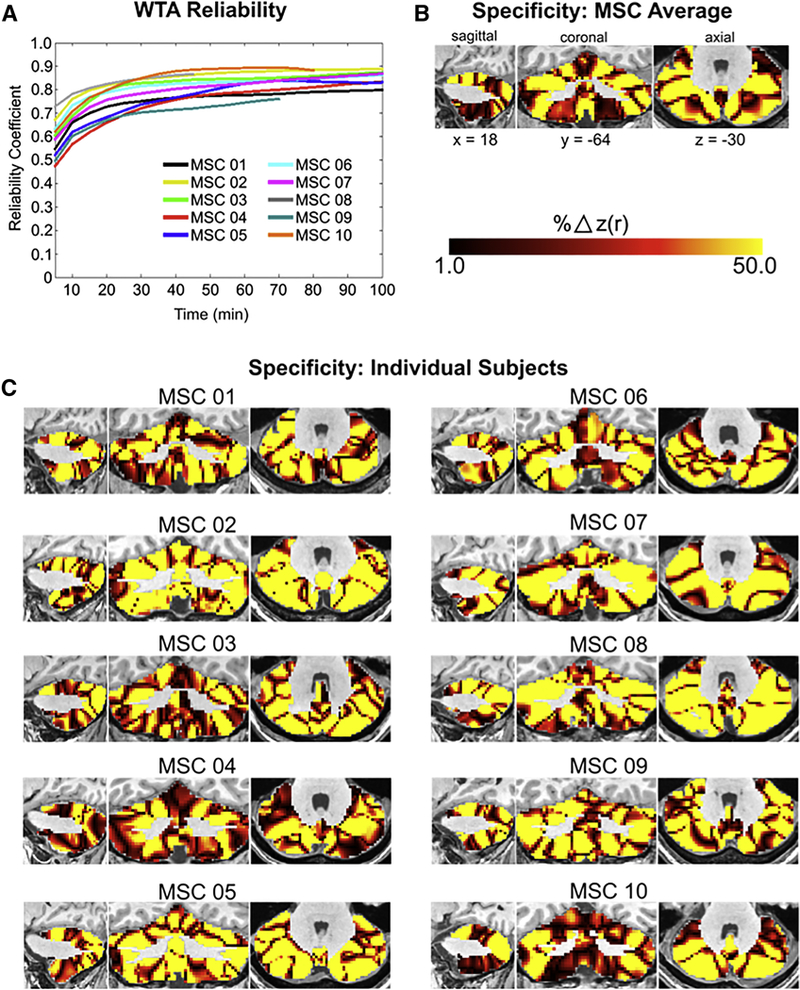
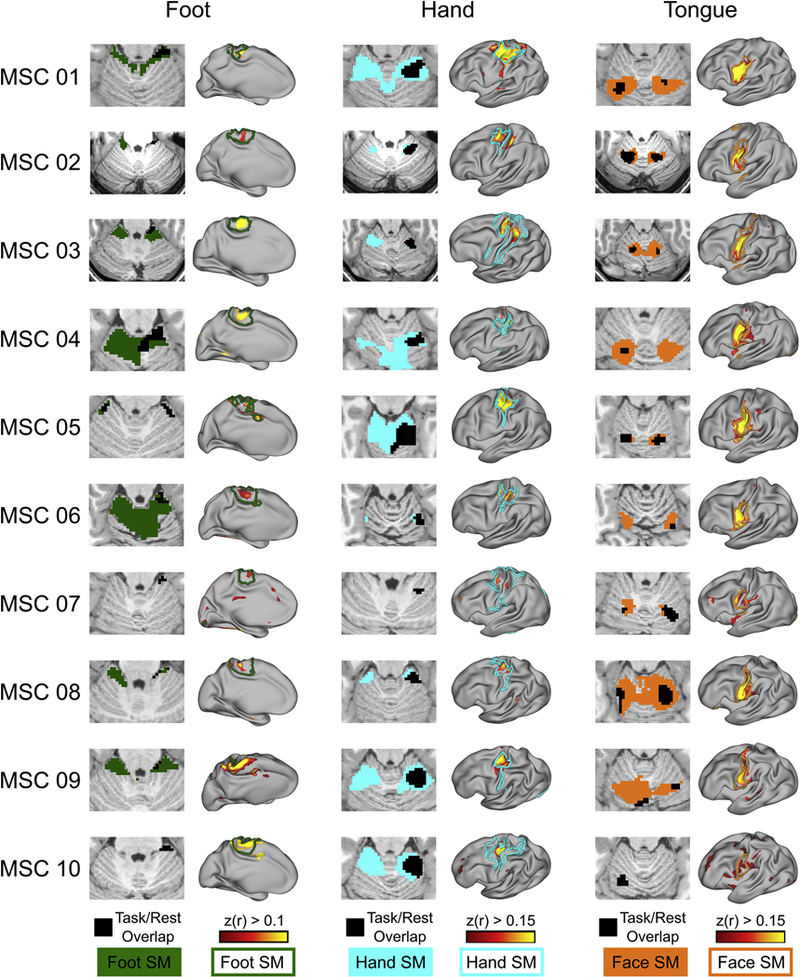
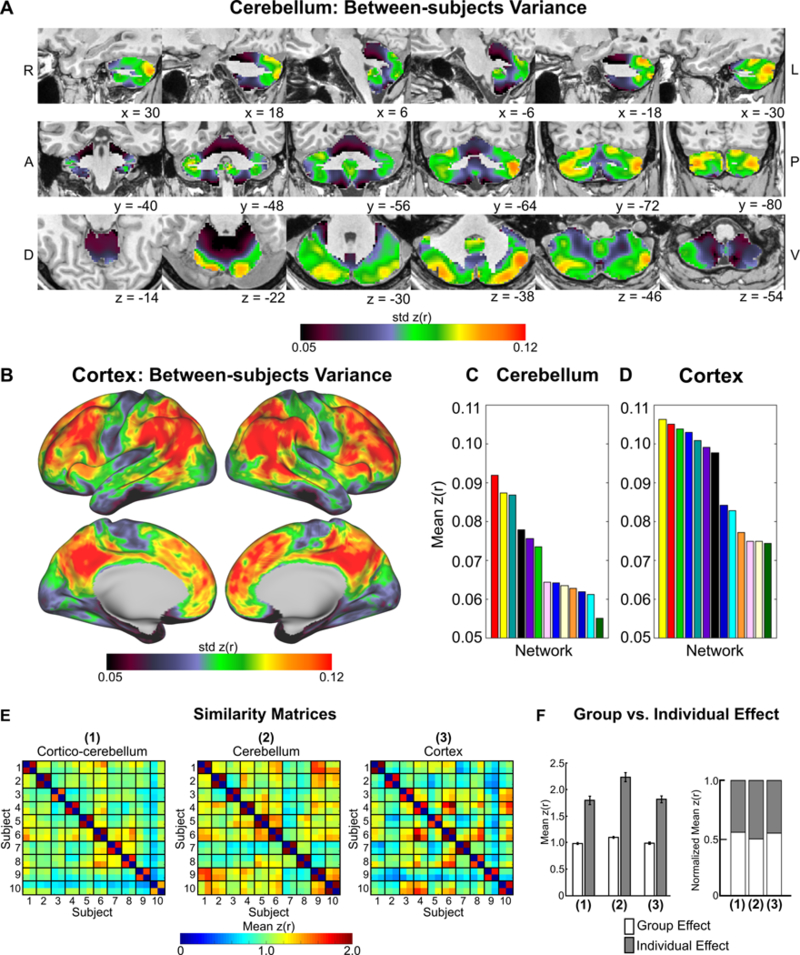
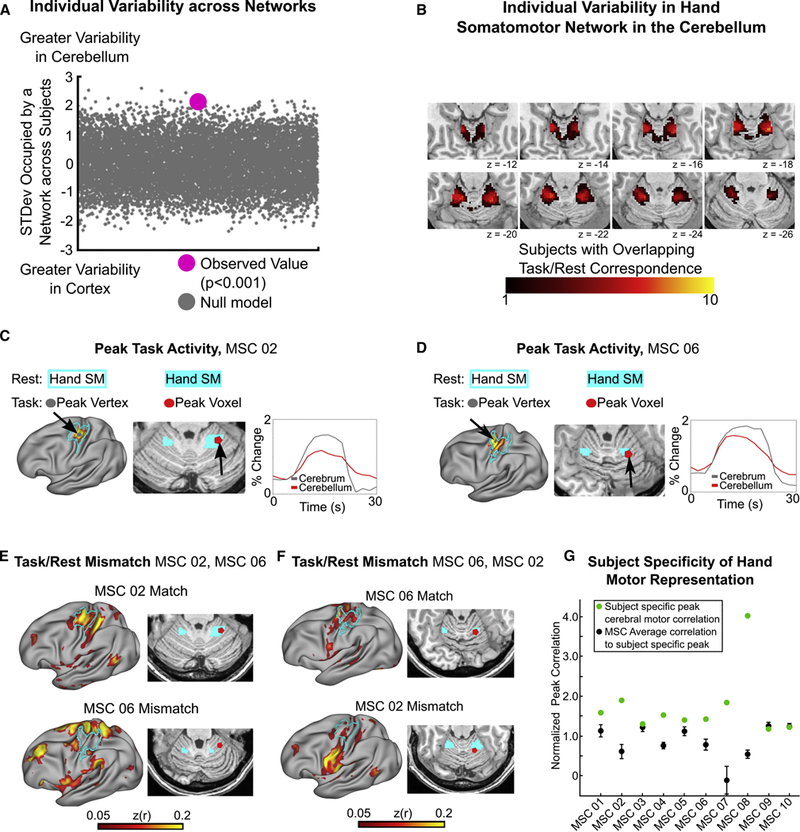
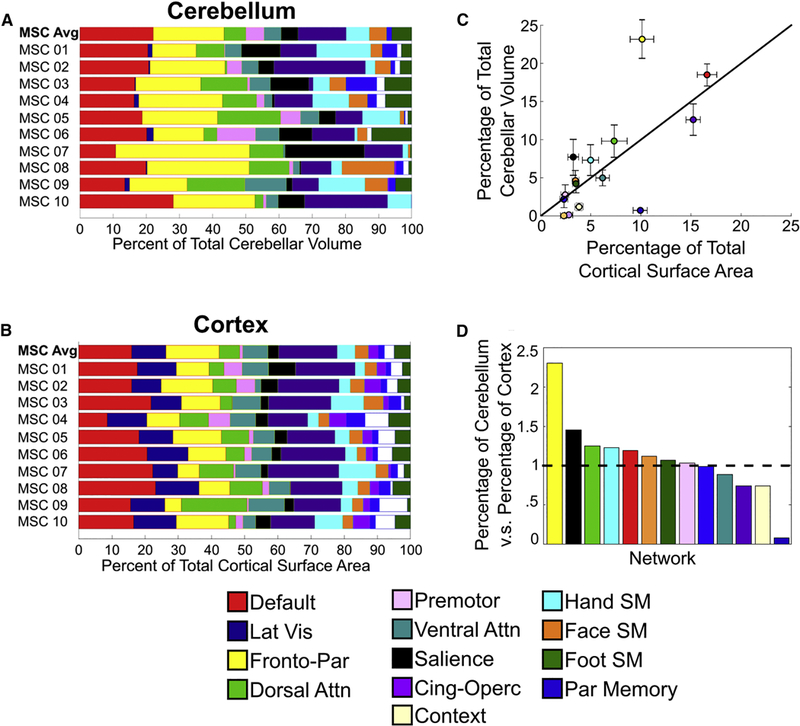
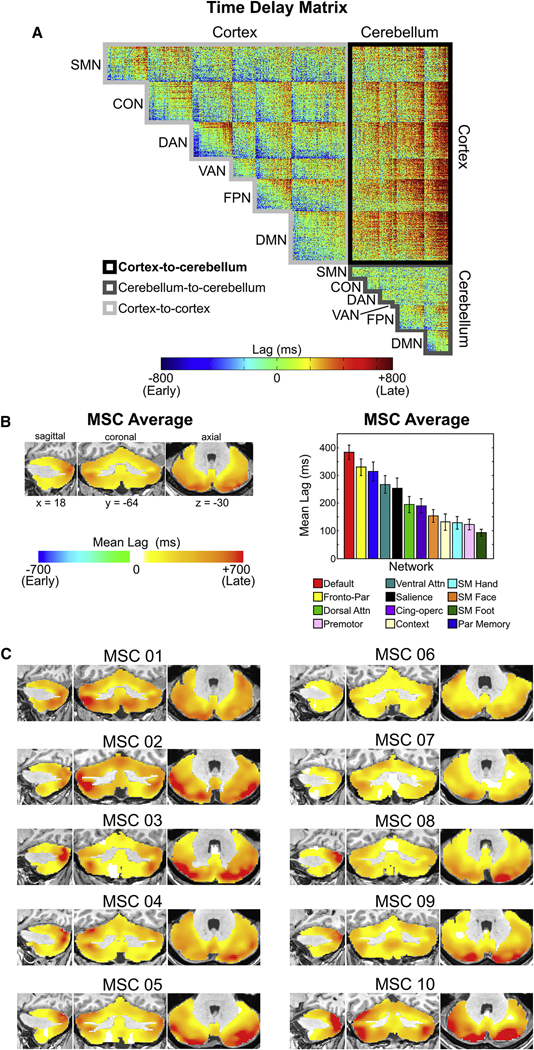
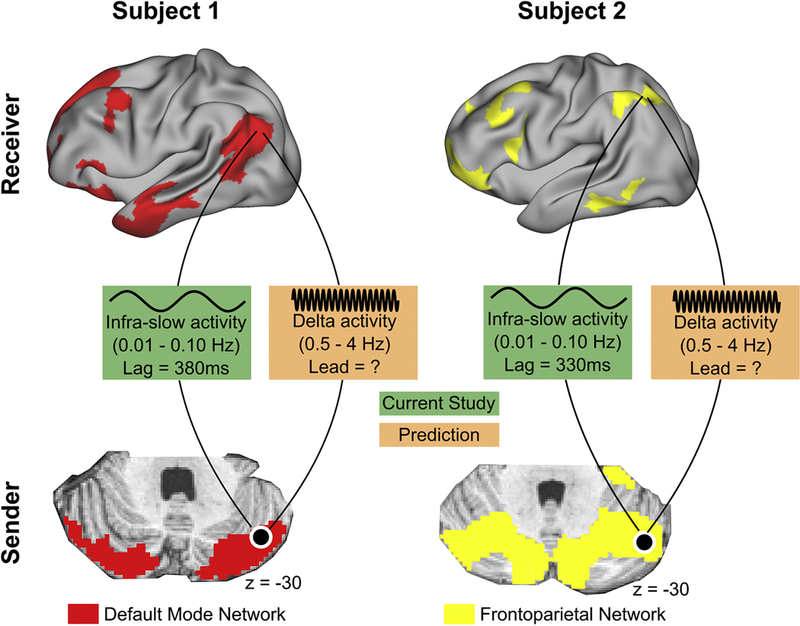
The cerebellum contains the majority of neurons in the human brain and is unique for its uniform cytoarchitecture, absence of aerobic glycolysis, and role in adaptive plasticity. Despite anatomical and physiological differences between the cerebellum and cerebral cortex, group-average functional connectivity studies have identified networks related to specific functions in both structures. Recently, precision functional mapping of individuals revealed that functional networks in the cerebral cortex exhibit measurable individual specificity. Using the highly sampled Midnight Scan Club (MSC) dataset, we found the cerebellum contains reliable, individual-specific network organization that is significantly more variable than the cerebral cortex. The frontoparietal network, thought to support adaptive control, was the only network overrepresented in the cerebellum compared to the cerebral cortex (2.3-fold). Temporally, all cerebellar resting state signals lagged behind the cerebral cortex (125-380 ms), supporting the hypothesis that the cerebellum engages in a domain-general function in the adaptive control of all cortical processes.

Keywords: fMRI; frontoparietal network; functional networks; human cerebellum; individual variability; resting state functional connectivity; temporal lags.


Figures

Figure 1:
Figure 1:. Individual cerebellar networks share common features with - and deviate from - the group average.
(A) MSC average cerebellum winner-take-all network partitions. (B) Individual MSC winner-take-all network partitions. Qualitatively, considerable variance exists between MSC subjects and between each subject and the group average.
Figure 2.
Figure 2.. Functional networks are reliable with sharp individual-specific boundaries between networks.
(A) The split-half reliability of individual subject WTA assignments increases with larger quantities of data (B) MSC average percent difference in average correlation to cortical networks between the first place WTA assignment and the second place WTA assignment. (C) Percent difference in average correlation to cortical networks between the first place WTA assignment and the second place WTA assignment in each individual. Large differences in correlations between first and second place WTA assignments, coupled with high reliability (ρ> 0.80) resulting from large quantities of RSFC data, indicate networks are reliable and specific at the individual subject level.
Figure 3.
Figure 3.. Strong convergence between individual motor activations and functional networks.
Overlap between right motor foot, hand, and tongue task-evoked BOLD activity and their respective resting state RSFC overlaid on WTA partitions in the cerebellum (colored patches). Note the laterality of the overlap. The black patch represents the overlap between the task and resting state. More specifically, in the resting state data, we placed a seed in an area of motor cortex that demonstrated the greatest task-evoked activity across trials of a given movement (foot, hand, and face, separately). This map was then thresholded at r > 0.10. Next, we correlated the cerebellar task time series with this cortical motor seed (beta series correlation) and thresholded this map at r > 0.10. Seeded correlation from cerebellar voxel demonstrating the greatest task-evoked activity to the cortex. Colored outline denotes Infomap-derived cortical network borders.
Figure 4.
Figure 4.. Network-level RSFC individual effects are greater in the cerebellum than in the cortex.
Between-subject variance topography in the (A) cerebellum and (B) cortex. Between-subject variance was greater in cognitive networks compared to motor networks and smaller in the cerebellum (C) than in the (D) cerebrum. (E) Network similarity matrices. Off-diagonal elements represent group effects, whereas on-diagonal elements represent individual effects. (F) Quantification of group vs. individual effects for RSFC (1) between the cerebellum and cortex, (2) within the cerebellum, and (3) within the cortex.
Figure 5.
Figure 5.. Individual variability in network organization is greater in the cerebellum than in the cortex.
(A) Difference across subjects in the standard deviation of the quantity of total space occupied by a network in the cerebellum vs. the cortex. Positive values indicate greater between subject variability in network organization within the cerebellum. (B) Overlap across subjects in individual-specific convergence between task and rest. Higher numbers indicate greater overlap between subjects. Note that no voxels within the cerebellum contain overlap across all ten individuals. (C & D) Single vertex/voxel peak activation during right hand movement falls within resting state hand somatomotor network in both the cortex (left panel; gray node within cyan outline) and cerebellum (middle panel; red node within cyan patch), and demonstrates a highly correlated time series of activation in individual subjects. Note the persistence of the cerebellar response compared to the cortical response. (E) RSFC from cerebellar voxel from panel C (MSC 02) to the cortex converges on MSC 02’s resting state cortical hand somatomotor network (top row), but not another MSC subject (MSC 06; bottom row). (F) RSFC correlation from cerebellar voxel from panel D (MSC 06) to the cortex converges on MSC 06’s resting state cortical hand somatomotor network (top row), but not another MSC subject (MSC 02; bottom row). (G) The mean correlations from a given subject’s peak task activation within the cerebellum to the hand somatomotor cortex was higher than within other subjects from the same cerebellar voxel, indicating individual-specificity. Error bars denote standard error of the mean across the nine other subjects.
Figure 6.
Figure 6.. The frontoparietal network is disproportionately expanded in the cerebellum compared to the cortex.
Network representation (percent of total volume/surface occupied by a network) was quantified in the cerebellum (A) and cortex (B). (C) Percentage of total surface area (cortex) relative to percentage of volume (cerebellum) for each network. Black line represents identity line (i.e., equal representation in the cerebellum and cortex). Error bars represent the standard error of the mean across subjects. The frontoparietal network occupies more space in the cerebellum than any other network. (D) Relative ratio (cerebellum/cortex) of network representation. Values greater than one (horizontal dotted line) indicate greater relative space occupied by a network in the cerebellum, whereas values less than one indicate greater space occupied by a network in the cortex.
Figure 7.
Figure 7.. Cerebellar ISA systematically lags cortical ISA.
(A) MSC average time delay matrix. Note the degree to which cerebellar BOLD signal lags behind the cortex compared to cortico- cortical signals or cerebello-cerebellum signals (B) Average temporal lag of each cerebellar voxel relative to all cortical vertices in the MSC average, quantified by network. This lag projection is computed as an average along each column of the “Cortex-to-cerebellum” portion of the time delay matrix. Note that ISA within every voxel in the cerebellum, on average, lags behind ISA in the cortex. Error bars denote standard error of the mean. (C) Average lag in ISA between each cerebellar voxel and all cortical vertices in individual subjects.
Figure 8.
Figure 8.. A model of cortico-cerebellar temporal propagation.
Cerebellar ISA lags cortical ISA in a network-specific fashion. ISA paces higher frequency activity, providing windows of opportunity for the sender (cerebellum) to transmit information to the receiver (cortex). High-fidelity data is required to accurately delineate cortico-cerebellar loops, since the same anatomical location in two individuals may be part of different functional network loops.

Comment in

References

    1. Albert NB, Robertson EM, and Miall RC (2009). The resting human brain and motor learning. Current biology : CB 19, 1023–1027. - PMC - PubMed
    1. Andersen BB, Korbo L, and Pakkenberg B (1992). A quantitative study of the human cerebellum with unbiased stereological techniques. J Comp Neurol 326, 549–560. - PubMed
    1. Azizi SA, Burne RA, and Woodward DJ (1985). The auditory corticopontocerebellar projection in the rat: inputs to the paraflocculus and midvermis. An anatomical and physiological study. Exp Brain Res 59, 36–49. - PubMed
    1. Balota DA, Yap MJ, Cortese MJ, Hutchison KA, Kessler B, Loftis B, Neely JH, Nelson DL, Simpson GB, and Treiman R (2007). The English Lexicon Project. Behav Res Methods 39, 445–459. - PubMed
    1. Barch DM, Burgess GC, Harms MP, Petersen SE, Schlaggar BL, Corbetta M, Glasser MF, Curtiss S, Dixit S, Feldt C, et al. (2013). Function in the human connectome: task-fMRI and individual differences in behavior. NeuroImage 80, 169–189. - PMC - PubMed

Publication types