Multifocal visual evoked potentials and contrast sensitivity correlate with ganglion cell-inner plexiform layer thickness in multiple sclerosis
- PMID: 30473445
- PMCID: PMC6309727
- DOI: 10.1016/j.clinph.2018.10.007
Multifocal visual evoked potentials and contrast sensitivity correlate with ganglion cell-inner plexiform layer thickness in multiple sclerosis
Abstract
Objective: To examine the relationship between optical coherence tomography (OCT) macular ganglion cell-inner plexiform layer thickness (GCIPLT), peripapillary retinal nerve fiber layer thickness (RNFLT) and visual function in relapsing-remitting multiple sclerosis (RRMS).
Methods: Cirrus OCT, VERIS 60-sector multifocal visual evoked potential (mfVEP) and Pelli-Robson contrast sensitivity (CS) were obtained for 53 eyes with last optic neuritis (ON) > 6 months and 105 non-ON eyes in 90 patients. One eye (43 ON, 73 non-ON) was used for correlations when both had the same history. Global (G, 60 sectors) and central 5.6° (C, 24 sectors) mfVEP amplitude and latency were calculated as mean logSNR and median latency.
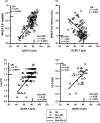
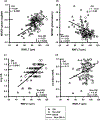
Results: Eyes showing abnormal mfVEP (amplitude or latency) vs OCT (GCIPLT or RNFLT) was 77% vs 69% (p = 0.33) in ON, 45% vs 22% (p < 0.0005) in non-ON. In ON and non-ON, mfVEP measures and CS correlated with GCIPLT and RNFLT (r = -0.24 to 0.78, p = 0.03-0.0001). In ON, mfVEP amplitude (C,G) correlated better with GCIPLT (r = 0.78, 0.76) than RNFLT (r = 0.43, 0.58; p < 0.001, 0.01).
Conclusions: MfVEP measures and CS correlated well with GCIPLT and RNFLT in ON and non-ON. MfVEP amplitudes were more highly correlated with GCIPLT than RNFLT in ON. MfVEP detected significantly more defects than OCT in non-ON.
Significance: GCIPLT, mfVEP and CS provide useful measures of optic nerve integrity in RRMS.
Keywords: Contrast sensitivity; Multifocal visual evoked potential; Multiple sclerosis; Optic neuritis; Remyelination; Visual function.
Copyright © 2018 International Federation of Clinical Neurophysiology. Published by Elsevier B.V. All rights reserved.
Conflict of interest statement
Conflict of Interest
Drs. Narayanan, Cheng, and Frishman report no disclosures. Dr. Tang has received research funds from Quark lab, River Vision, Horizon Pharma and Novartis and is a speaker for EMD Serono, Sanofi, Mallinckrodt, and Teva.
Figures


Comment in
-
Correlating structure with visual function in patients with multiple sclerosis: Where is this leading?Clin Neurophysiol. 2019 Jan;130(1):157-159. doi: 10.1016/j.clinph.2018.11.006. Epub 2018 Nov 22. Clin Neurophysiol. 2019. PMID: 30503513 No abstract available.
Similar articles
-
Differing Structural and Functional Patterns of Optic Nerve Damage in Multiple Sclerosis and Neuromyelitis Optica Spectrum Disorder.Ophthalmology. 2019 Mar;126(3):445-453. doi: 10.1016/j.ophtha.2018.06.022. Epub 2018 Jul 27. Ophthalmology. 2019. PMID: 30060979
-
Evaluation of visual structural and functional factors that predict the development of multiple sclerosis in clinically isolated syndrome patients.Invest Ophthalmol Vis Sci. 2014 Sep 4;55(10):6127-31. doi: 10.1167/iovs.14-14807. Invest Ophthalmol Vis Sci. 2014. PMID: 25190654
-
Functional-structural assessment of the optic pathways in patients with optic neuritis.Doc Ophthalmol. 2020 Apr;140(2):159-168. doi: 10.1007/s10633-019-09728-0. Epub 2019 Oct 17. Doc Ophthalmol. 2020. PMID: 31624975
-
[New insights into the study of optic nerve diseases].Nippon Ganka Gakkai Zasshi. 2013 Mar;117(3):187-210; discussion 211. Nippon Ganka Gakkai Zasshi. 2013. PMID: 23631254 Review. Japanese.
-
The contribution of multifocal visual evoked potentials in patients with optic neuritis and multiple sclerosis: a review.Doc Ophthalmol. 2021 Jun;142(3):283-292. doi: 10.1007/s10633-020-09799-4. Epub 2020 Dec 31. Doc Ophthalmol. 2021. PMID: 33381858 Free PMC article. Review.
Cited by
-
Macular Ganglion Cell-Inner Plexiform Layer as a Marker of Cognitive and Sensory Function in Midlife.J Gerontol A Biol Sci Med Sci. 2020 Sep 16;75(9):e42-e48. doi: 10.1093/gerona/glaa135. J Gerontol A Biol Sci Med Sci. 2020. PMID: 32490509 Free PMC article.
-
OCT-Based Retina Assessment Reflects Visual Impairment in Multiple Sclerosis.Invest Ophthalmol Vis Sci. 2025 Feb 3;66(2):39. doi: 10.1167/iovs.66.2.39. Invest Ophthalmol Vis Sci. 2025. PMID: 39946137 Free PMC article.
-
Association Between Contrast Sensitivity and Ganglion Cell-Inner Plexiform Layer Thickness After Resolution of Macular Edema Due to Branch Retinal Vein Occlusion.J Clin Med. 2025 Feb 24;14(5):1507. doi: 10.3390/jcm14051507. J Clin Med. 2025. PMID: 40094980 Free PMC article.
-
The Evolvement of OCT and OCT-A in Identifying Multiple Sclerosis Biomarkers.Biomedicines. 2023 Nov 11;11(11):3031. doi: 10.3390/biomedicines11113031. Biomedicines. 2023. PMID: 38002031 Free PMC article. Review.
-
Evaluation of Retinal Inner Layer Thickness and its Relationship with Visual Prognosis in Multiple Sclerosis Patients with and Without Optic Neuritis.Beyoglu Eye J. 2025 Jun 25;10(2):95-100. doi: 10.14744/bej.2025.48379. eCollection 2025. Beyoglu Eye J. 2025. PMID: 40630846 Free PMC article.
References
-
- Ali EN, Maddess T, James AC, Voicu C, Lueck CJ. Pupillary response to sparse multifocal stimuli in multiple sclerosis patients. Mult Scler. 2014;20:854–61. - PubMed
-
- American Clinical Neurophysiology S Guideline 5: guidelines for standard electrode position nomenclature. Am J Electroneurodiagnostic Technol. 2006;46:222–5. - PubMed
-
- Britze J, Pihl-Jensen G, Frederiksen JL. Retinal ganglion cell analysis in multiple sclerosis and optic neuritis: a systematic review and meta-analysis. J Neurol. 2017;264:1837–53. - PubMed
-
- Brusa A, Jones SJ, Kapoor R, Miller DH, Plant GT. Long-term recovery and fellow eye deterioration after optic neuritis, determined by serial visual evoked potentials. J Neurol. 1999;246:776–82. - PubMed
Publication types
MeSH terms
Grants and funding
LinkOut - more resources
Full Text Sources
Medical
Miscellaneous

