

Lipid profiles of prostate cancer cells
- PMID: 30473749
- PMCID: PMC6238979
- DOI: 10.18632/oncotarget.26222
Lipid profiles of prostate cancer cells
Abstract
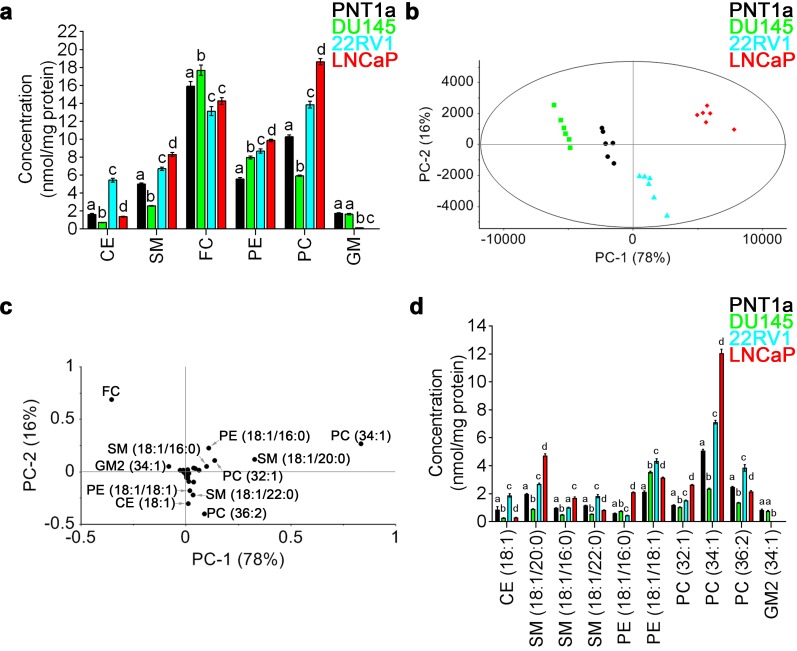
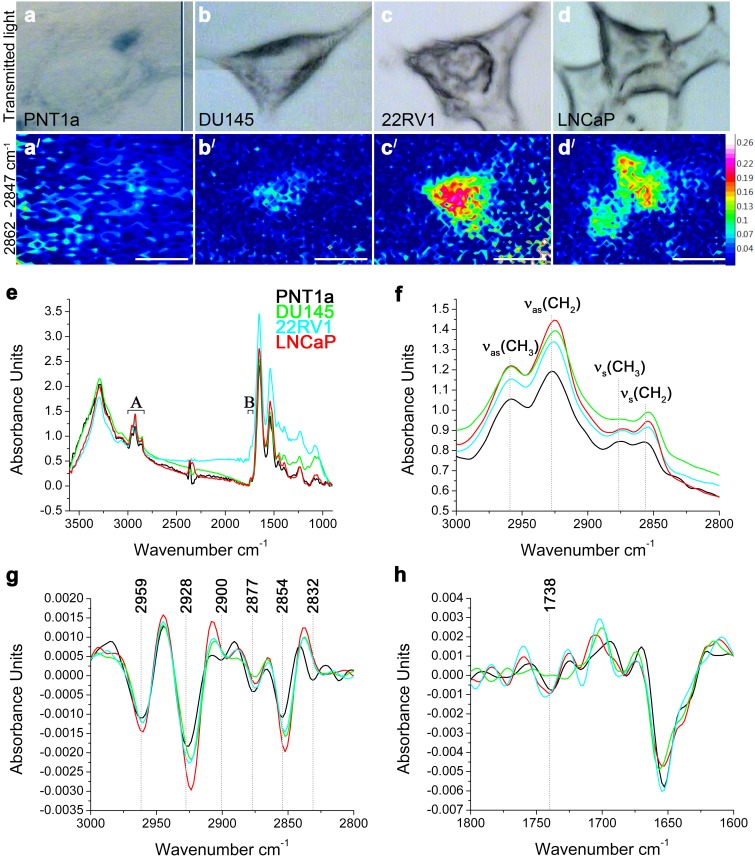
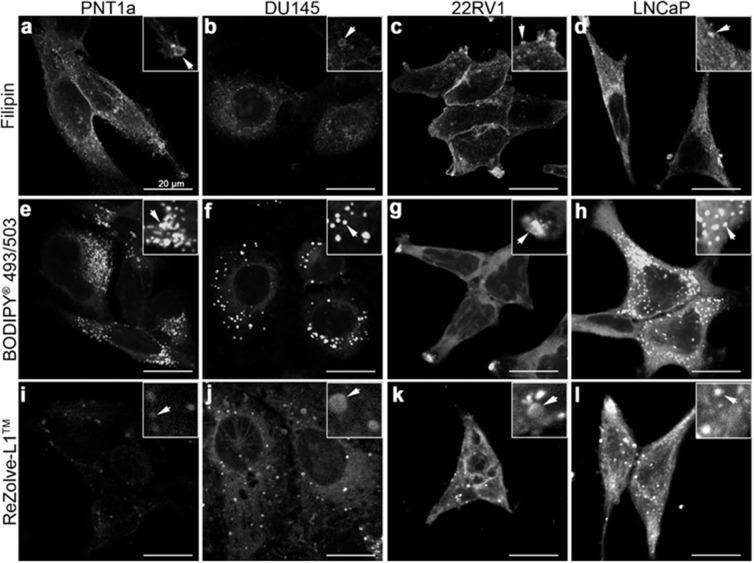
Lipids are important cellular components which can be significantly altered in a range of disease states including prostate cancer. Here, a unique systematic approach has been used to define lipid profiles of prostate cancer cell lines, using quantitative mass spectrometry (LC-ESI-MS/MS), FTIR spectroscopy and fluorescent microscopy. All three approaches identified significant difference in the lipid profiles of the three prostate cancer cell lines (DU145, LNCaP and 22RV1) and one non-malignant cell line (PNT1a). Specific lipid classes and species, such as phospholipids (e.g., phosphatidylethanolamine 18:1/16:0 and 18:1/18:1) and cholesteryl esters, detected by LC-ESI-MS/MS, allowed statistical separation of all four prostate cell lines. Lipid mapping by FTIR revealed that variations in these lipid classes could also be detected at a single cell level, however further investigation into this approach would be needed to generate large enough data sets for quantitation. Visualisation by fluorescence microscopy showed striking variations that could be observed in lipid staining patterns between cell lines allowing visual separation of cell lines. In particular, polar lipid staining by a fluorescent marker was observed to increase significantly in prostate cancer lines cells, when compared to PNT1a cells, which was consistent with lipid quantitation by LC-ESI-MS/MS and FTIR spectroscopy. Thus, multiple technologies can be employed to either quantify or visualise changes in lipid composition, and moreover specific lipid profiles could be used to detect and phenotype prostate cancer cells.
Keywords: FTIR; LC-ESI-MS/MS; lipid dyes; lipid profiles; prostate cancer.
Conflict of interest statement
CONFLICTS OF INTEREST Authors declare no conflicts of interest.
Figures
References
-
- Gaglio D, Metallo CM, Gameiro PA, Hiller K, Danna LS, Balestrieri C, Alberghina L, Stephanopoulos G, Chiaradonna F. Oncogenic K-Ras decouples glucose and glutamine metabolism to support cancer cell growth. Mol Syst Biol. 2011;7:523. https://doi.org/10.1038/msb.2011.56 - DOI - PMC - PubMed
-
- Beloribi-Djefaflia S, Vasseur S, Guillaumond F. Lipid metabolic reprogramming in cancer cells. Oncogenesis. 2016;5:e189. https://doi.org/10.1038/oncsis.2015.49 - DOI - PMC - PubMed
-
- Liu Y, Zuckier LS, Ghesani NV. Dominant uptake of fatty acid over glucose by prostate cells: a potential new diagnostic and therapeutic approach. Anticancer Res. 2010;30:369–74. - PubMed
-
- Bandyopadhyay S, Pai SK, Watabe M, Gross SC, Hirota S, Hosobe S, Tsukada T, Miura K, Saito K, Markwell SJ, Wang Y, Huggenvik J, Pauza ME, et al. FAS expression inversely correlates with PTEN level in prostate cancer and a PI 3-kinase inhibitor synergizes with FAS siRNA to induce apoptosis. Oncogene. 2005;24:5389–95. https://doi.org/10.1038/sj.onc.1208555 - DOI - PubMed
-
- Furuta E, Pai SK, Zhan R, Bandyopadhyay S, Watabe M, Mo YY, Hirota S, Hosobe S, Tsukada T, Miura K, Kamada S, Saito K, Iiizumi M, et al. Fatty acid synthase gene is up-regulated by hypoxia via activation of Akt and sterol regulatory element binding protein-1. Cancer Res. 2008;68:1003–11. https://doi.org/10.1158/0008-5472.CAN-07-2489 - DOI - PubMed
LinkOut - more resources
Full Text Sources
