

Body Mass Index in Master Athletes: Review of the Literature
- PMID: 30474004
- PMCID: PMC6239137
- DOI: 10.15280/jlm.2018.8.2.79
Body Mass Index in Master Athletes: Review of the Literature
Abstract
Background: Masters athletes (MAs) have led a physically active lifestyle for an extended period of time or initiated exercise/sport in later life. Given the benefits of physical activity and exercise we investigated if body mass index (BMI), an indirect health indicator of obesity, was clinically superior in MAs as compared to controls or the general population.
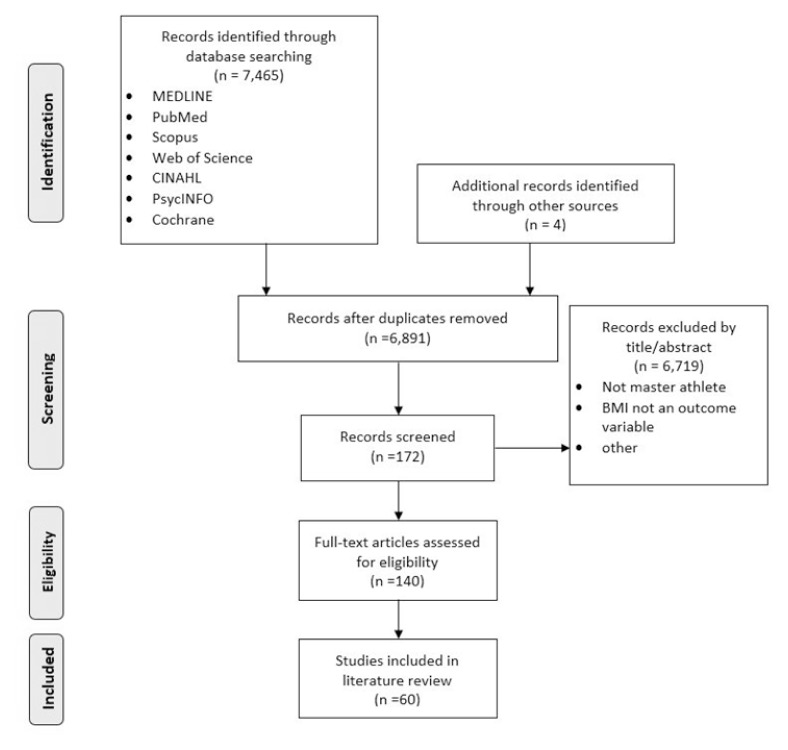
Methods: Seven databases (Medline, PubMed, Scopus, Web of Science, CINAHL, PsycINFO, Cochrane) were electronically searched for studies on BMI (kg/m2) or as a percentage of BMI categories (underweight, normal, overweight, obesity) in MAs.
Results: Of the initial yield of 7,431 papers, 60 studies met our inclusion criteria and were used in this literature review. Studies identified were classified as: endurance sports (n = 14), runners (n = 14), mixed sports (n = 8), cyclists (n = 4), soccer (n = 4) swimmers (n = 3), non-specific (n = 3), orienteering (n = 2), World Masters Games (n = 2) and individual sports (n = 5). Where BMI was presented for the group of MAs the mean was 23.8 kg/m2 (± 1.1) with a range from 20.8 kg/m2 (endurance runners) to 27.3 kg/m2 (soccer players), this was significantly lower (p < 0.001) than controls ( -9.5%, 26.13 ± 1.7 kg/m2). Where gender specific BMI was reported the mean for male MAs was 23.6 kg/m2 (± 1.5) (range 22.4 kg/m2 endurance to 26.4 kg/m2 swimmers) and 22.4 kg/m2 (± 1.2) for female MAs (range 20.8 kg/m2 mixed to 24.7 kg/m2 WMG).
Conclusion: In most, but not all studies the BMI of MAs was significantly lower than controls. A clinically superior BMI affords MAs reduced risk with regard to a number of cardiometabolic diseases, osteoarthritis and certain types of cancers.
Keywords: BMI; Obesity; Physical activity; Veteran athlete; World masters games.
Figures
References
-
- Australian Institute of Health and Welfare. An interactive insight into overweight and obesity in Australia [Internet] c2017 Available from: https://www.aihw.gov.au/reports/overweight-obesity/interactive-insight-i....
-
- World Health Organization. Global database of body mass index: BMI classification [Internet] c2018 Available from: http://apps.who.int/bmi/index.jsp?introPage=intro_3.html.
-
- Sydney World Masters Games Committee. Sydney 2009 World Masters Games Final Report [Internet] c2009 Available from: https://www.clearinghouseforsport.gov.au/__data/assets/pdf_file/0020/439....
LinkOut - more resources
Full Text Sources
Miscellaneous