. 2018 Nov 21;4(11):eaau9180.
doi: 10.1126/sciadv.aau9180. eCollection 2018 Nov.

A central control circuit for encoding perceived food value

Affiliations

A central control circuit for encoding perceived food value

Michael Crossley et al. Sci Adv. .

Abstract

Hunger state can substantially alter the perceived value of a stimulus, even to the extent that the same sensory cue can trigger antagonistic behaviors. How the nervous system uses these graded perceptual shifts to select between opposed motor patterns remains enigmatic. Here, we challenged food-deprived and satiated Lymnaea to choose between two mutually exclusive behaviors, ingestion or egestion, produced by the same feeding central pattern generator. Decoding the underlying neural circuit reveals that the activity of central dopaminergic interneurons defines hunger state and drives network reconfiguration, biasing satiated animals toward the rejection of stimuli deemed palatable by food-deprived ones. By blocking the action of these neurons, satiated animals can be reconfigured to exhibit a hungry animal phenotype. This centralized mechanism occurs in the complete absence of sensory retuning and generalizes across different sensory modalities, allowing food-deprived animals to increase their perception of food value in a stimulus-independent manner to maximize potential calorific intake.


Figures

Fig. 1
Fig. 1. In vitro correlates of ingestion and egestion behavior.
(A) Lymnaea biting at water surface. (B) Mouth movements during ingestion or egestion. White dots indicate the distal tip of the radula tracked in analysis. (C and D) AJM and SLRT activity in an in vitro preparation during an ingestion cycle after CV1a depolarization (C) and an egestion cycle after touch to the esophagus (D). Gray dashed lines represent the onset of burst of activity on AJM. (E) Average frequency of SLRT activity during ingestion (green) (n = 105 cycles, 10 preps) and egestion (purple) (n = 51 cycles, 8 preps). Line and shading show means ± SEM. (F) Normalized difference score of SLRT activity after versus before AJM activity onset with significant difference between ingestion (0.77 ± 0.05) and egestion (−0.83 ± 0.05. unpaired t test, *P < 0.0001). Data are shown as means ± SEM. (G) Morphology and schematic of B11 motoneuron in the buccal ganglia after iontophoretic dye filling showing single projection leaving ganglion via ventral buccal nerve (VBN) toward buccal mass and SLRT muscle. Morphology was confirmed in n = 3 cells. Scale bar, 100 μM. (H) Spikes artificially triggered in B11 cause 1:1 activity on SLRT muscle. (I and J) B11 and AJM activity during ingestion (I) and egestion (J) cycles. (K) Average B11 spike frequency during ingestion (green) (n = 69 cycles, 9 preps) and egestion (purple) (n = 78 cycles, 10 preps) cycles. Line and shading are means ± SEM. (L) Normalized difference scores of B11 activity after versus before AJM activity onset showed a significant difference between ingestion (0.49 ± 0.05) and egestion (−0.87 ± 0.03, unpaired t test, *P < 0.0001). Data are shown as means ± SEM.
Fig. 2
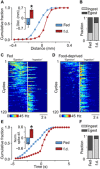
Fig. 2. Choice between ingestion and egestion depends on hunger state.
(A) Cumulative frequency plot of radula movements in response to tactile probe with food-like properties from fed and food-deprived (f.d.) animals. Bar chart of behavioral response to tactile probe shows a significant difference in radula movements between fed (−0.41 ± 0.17 mm, n = 18) and food-deprived (0.55 ± 0.12 mm, n = 21) animals (Mann-Whitney U test, P < 0.0001). Data are shown as means ± SEM. (B) Comparison of fraction of ingestion and egestion bites in response to tactile stimulus with significant difference between fed and food-deprived responses (Fisher’s exact test, P < 0.0001). (C and D) Heatplots of B11 activity in multiple trials during in vitro cycles from fed (C) and food-deprived (D) preparations. White lines represent onset of AJM burst. Data are ordered from high to low activity before AJM onset. (E) Cumulative frequency plot of B11 activity during cycles from fed and food-deprived preparations. Bar chart showing normalized B11 spike frequency before versus after AJM burst onset (n = 120 cycles from 12 preparations for both conditions) showing a significant difference between fed (−0.33 ± 0.11) and food-deprived (0.47 ± 0.1) cycles (unpaired t test, *P < 0.0001). (F) Comparison of the fraction of ingestion and egestion cycles. There was a significant difference between fed and food-deprived preparations (Fisher’s exact test, P < 0.0001).
Fig. 3
Fig. 3. PRN encodes hunger state and drives network reconfiguration.
(A) Morphology of PRNs via iontophoretic dye filling demonstrating cerebral buccal connective (CBC) projection, confirmed in n = 6 cells. Scale bar, 100 μM. (B) Trace of PRN activity during esophageal-driven egestion, co-recorded with B11 and AJM. PRN is active in phase with B11 but not AJM. Gray dashed lines show onset of AJM burst. (C) Average spike frequency of B11 activity during PRN-driven cycles (see fig. S3B) (n = 36 cycles, eight preps). Line and shading are means ± SEM. (D) Heatplots of PRN firing rates during in vitro cycles in fed (left) (n = 150 cycles, 15 preps) and food-deprived (right) (n = 160 cycles, 16 preps) preparations. (E and F) Statistical analysis. Fed preparations had more PRN activity per cycle (unpaired t test, *P < 0.0001) and more active cycles (Fisher’s exact test, P < 0.0001) than food-deprived in these nonstimulated preparations. Data are shown as means ± SEM. (G) Representative traces of an in vitro egestion cycle from fed preparation (left). B11 is only active in the protraction phase (see fig. S3, D and E). Hyperpolarizing both PRNs switches B11 activity to ingestion-like pattern (right). Gray dashed lines show retraction phase onset. Heatplots of B11 activity before (left) and during (right) PRN hyperpolarization are shown. White line shows onset of AJM burst. Data are ordered from high to low (n = 40 cycles, four preps) with significant B11 difference score before versus during PRN hyperpolarization (before: −0.62 ± 0.06; during: 0.4 ± 0.15, paired t test, P = 0.002).
Fig. 4
Fig. 4. Switching from satiated to hungry phenotype with dopamine block.
(A) Double labeling of PRN (iontophoretically filled with Alexa Fluor; left), dopamine (DA) neuron (middle), and overlay (right). Double labeling confirmed in n = 4 preparations. Scale bar, 25 μM. (B) Evoked spikes in PRN caused 1:1 excitatory postsynaptic potentials (EPSPs) on B11 before (left) and after 10−4 M sulpiride application (right). (C) Heatplot of B11 activity in vitro in fed preparations before (left) and after (right) sulpiride application. White lines show onset of AJM burst. Data are ordered from high to low activity before AJM onset (n = 100 cycles from 10 preps for both conditions). (D) Cumulative frequency plot of B11 activity during cycles in normal saline (n.s.) or sulpiride. Bar chart (means ± SEM) of normalized B11 spike frequency before versus after AJM activity shows difference between cycles in normal saline (−0.34 ± 0.14) and sulpiride (0.38 ± 0.07, paired t test, *P < 0.05). (E) Comparison of fraction of ingestion and egestion cycles for normal saline or sulpiride (Fisher’s exact test, P < 0.0001). (F) Cumulative frequency plot of radula movements in response to tactile probe for animals injected with saline (−0.16 ± 0.17 mm, n = 16)– and sulpiride (0.51 ± 0.18 mm, n = 16)–injected animals (Mann-Whitney U test, *P < 0.05). Data are shown as means ± SEM. (G) Comparison of the fraction of ingestion and egestion responses to tactile stimulus (normal saline versus sulpiride; Fisher’s exact test, P < 0.0001). (H) Representative trajectories of saline (top) and sulpiride-injected (bottom) animals (n = 4) over 30 min. There was no significant difference in the total distance traversed between groups (saline: 117.1 ± 71.74 cm, n = 15; sulpiride: 118.4 ± 65.21 cm, n = 15; unpaired t test, P = 0.89).
Fig. 5
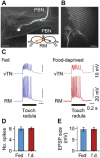
Fig. 5. Hunger state does not alter properties of RM neurons.
(A) Morphology and schematic of RM neuron in buccal ganglia revealed by iontophoretic dye filling. A single projection leaves the ganglion via the post buccal nerve (PBN) toward the radula. Morphology was confirmed in n = 4 preparations. Scale bar, 100 μM. (B) Image of a single RM’s projection under the toothed radula. Scale bar, 100 μM. (C) Representative trace of RM and vTN’s response to a tactile stimulus to the radula in fed (blue traces) and food-deprived (red traces) preparations. Touch-induced RM spikes elicit 1:1 EPSPs on vTN. Black bar represents the duration of tactile stimulus (0.5 s). (D and E) Statistical analysis of RM and vTN response to touch to the radula. There was no significant difference in the number of RM spikes in response to touch between fed (n = 8) and food-deprived (n = 8) preparations (Mann-Whitney U test, P > 0.05) or size of EPSP on vTN (unpaired t test, P > 0.05). Error bars represent means ± SEM.
Fig. 6
Fig. 6. Hunger state generalizes motor program selection to chemical stimulus.
(A) Cumulative frequency plot of movements of the radula in response to AA in fed and food-deprived animals. There was a significant difference in the average radula movement in fed (−0.57 ± 0.19 mm, n = 20) versus food-deprived (0.34 ± 0.21 mm, n = 22) animals (unpaired t test, *P < 0.01). (B) Comparison of the fraction of ingestion and egestion responses to AA. There was a significant difference between fed and food-deprived animals (Fisher’s exact test, P < 0.0001). (C) Cumulative frequency plot of movements of the radula in response to AA in animals injected with saline or sulpiride. There was a significant difference in the average radula movement in saline (−0.52 ± 0.17 mm, n = 18) compared to sulpiride-injected (0.19 ± 0.28 mm, n = 18) animals (unpaired t test, *P < 0.05). (D) Comparison of the fraction of ingestion and egestion responses to AA. There was a significant difference between saline- and sulpiride-injected animals (Fisher’s exact test, P < 0.0001). (E) Schematic model depicting sensory-independent biasing of behavioral selection. Changes in hunger state are encoded by changes in activity levels in PRN and, in turn, the levels of dopamine release onto the feeding network. Sensory inputs, via sensory neurons (SN), converge onto the same network, but behavioral selection is based on the network state set by PRN, rather than retuning of these sensory pathways.

References

    1. Padilla S. L., Qiu J., Soden M. E., Sanz E., Nestor C. C., Barker F. D., Quintana A., Zweifel L. S., Rønnekleiv O. K., Kelly M. J., Palmiter R. D., Agouti-related peptide neural circuits mediate adaptive behaviors in the starved state. Nat. Neurosci. 19, 734–741 (2016). - PMC - PubMed
    1. Gaudry Q., Kristan W. B. Jr., Behavioral choice by presynaptic inhibition of tactile sensory terminals. Nat. Neurosci. 12, 1450–1457 (2009). - PubMed
    1. Ghosh D. D., Sanders T., Hong S., McCurdy L. Y., Chase D. L., Cohen N., Koelle M. R., Nitabach M. N., Neural architecture of hunger-dependent multisensory decision making in C. elegans. Neuron 92, 1049–1062 (2016). - PMC - PubMed
    1. Burnett C. J., Li C., Webber E., Tsaousidou E., Xue S. Y., Brüning J. C., Krashes M. J., Hunger-driven motivational state competition. Neuron 92, 187–201 (2016). - PMC - PubMed
    1. Filosa A., Barker A. J., Dal Maschio M., Baier H., Feeding state modulates behavioral choice and processing of prey stimuli in the zebrafish tectum. Neuron 90, 596–608 (2016). - PubMed

Publication types