Cause-specific child mortality performance and contributions to all-cause child mortality, and number of child lives saved during the Millennium Development Goals era: a country-level analysis
- PMID: 30474513
- PMCID: PMC6263110
- DOI: 10.1080/16549716.2018.1546095
Cause-specific child mortality performance and contributions to all-cause child mortality, and number of child lives saved during the Millennium Development Goals era: a country-level analysis
Abstract
Background: During the Millennium Development Goal (MDG) era, impressive reductions in the under-5 mortality rate (U5MR) have been observed, although the MDG 4 target was not met. So far, cause-specific progress in child mortality has been analyzed and discussed mainly at the global and regional levels.
Objectives: We aimed to explore annual changes in cause-specific mortality at the country level, assess which causes contributed the most to child mortality reduction in 2000-2015, and estimate how many child lives were saved.
Methods: We used the cause-specific child mortality estimates published by Liu and colleagues. We derived average annual changes in cause-specific child mortality rates and cause-specific contribution to overall child mortality in 2000-2015. We estimated the number of cause-specific child deaths averted during the MDG era, assuming that cause-specific child mortality remained the same as in 2000. We targeted the 75 Countdown countries where 95% of maternal and child deaths occurred during the MDG era.
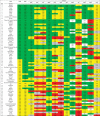
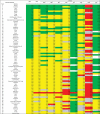
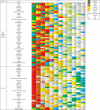
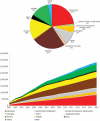
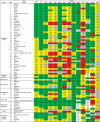
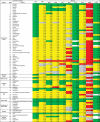
Results: Wide disparities existed across causes within countries, both in neonatal and post-neonatal mortality reduction, except for a few countries such as China, Rwanda, and Cambodia. In 20 of the 45 sub-Saharan African countries, malaria was the main contributor to post-neonatal mortality reduction, and pneumonia was the main contributor in only six countries. A single disease often contributed to a substantial proportion of the child mortality reduction, particularly in west and central African countries. Diarrhea-specific post-neonatal child mortality reduction accounted for 7.1 million averted child deaths (24.5%), while pneumonia accounted for another 6.7 million averted child deaths (23%).
Conclusions: This study demonstrates country-specific characteristics with regards to cause-wise child mortality that could not be identified by global or regional analyses. These findings provide the global community with evidence for formulating national policies and strategies to achieve the Sustainable Development Goals in child mortality reduction.
Keywords: Annual average reduction rate; Millennium Development Goal (MDG) era; cause-specific child mortality; cause-specific contribution to child mortality; number of child lives saved.
Figures




References
-
- You D, Hug L, Ejdemyr S, et al. Global, regional, and national levels and trends in under-5 mortality between 1990 and 2015, with scenario-based projections to 2030: a systematic analysis by the UN Inter-agency Group for Child Mortality Estimation. Lancet. 2015;386:2275–2286. - PubMed
-
- Liu L, Oza S, Hogan D, et al. Global, regional, and national causes of child mortality in 2000–13, with projections to inform post-2015 priorities: an updated systematic analysis. Lancet. 2015;385:430–440. - PubMed
-
- D HL Y, Ejdemyr S, Beise J.. Levels and trends in child mortality report 2015. Etimates developed by the UN Inter-agency Group for Child Mortaltiy Estimation. New York: UN; 2015.
MeSH terms
LinkOut - more resources
Full Text Sources
Miscellaneous
