Meta-Analysis
. 2018 Nov 1;108(5):1069-1091.
doi: 10.1093/ajcn/nqy097.

Dietary intake and blood concentrations of antioxidants and the risk of cardiovascular disease, total cancer, and all-cause mortality: a systematic review and dose-response meta-analysis of prospective studies

Affiliations
Meta-Analysis

Dietary intake and blood concentrations of antioxidants and the risk of cardiovascular disease, total cancer, and all-cause mortality: a systematic review and dose-response meta-analysis of prospective studies

Dagfinn Aune et al. Am J Clin Nutr. .

Abstract

Background: High dietary intake or blood concentrations (as biomarkers of dietary intake) of vitamin C, carotenoids, and vitamin E have been associated with reduced risk of cardiovascular disease, cancer, and mortality, but these associations have not been systematically assessed.

Objective: We conducted a systematic review and meta-analysis of prospective studies of dietary intake and blood concentrations of vitamin C, carotenoids, and vitamin E in relation to these outcomes.

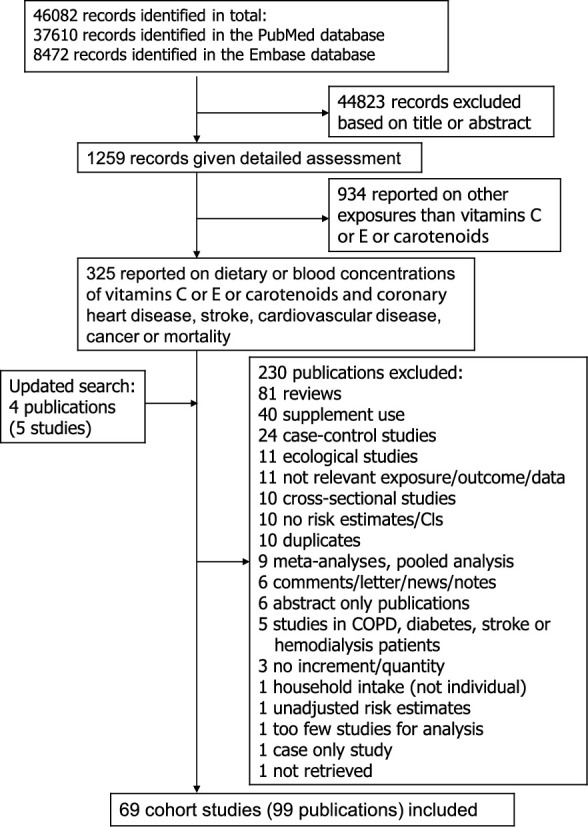
Design: We searched PubMed and Embase up to 14 February 2018. Summary RRs and 95% CIs were calculated with the use of random-effects models.

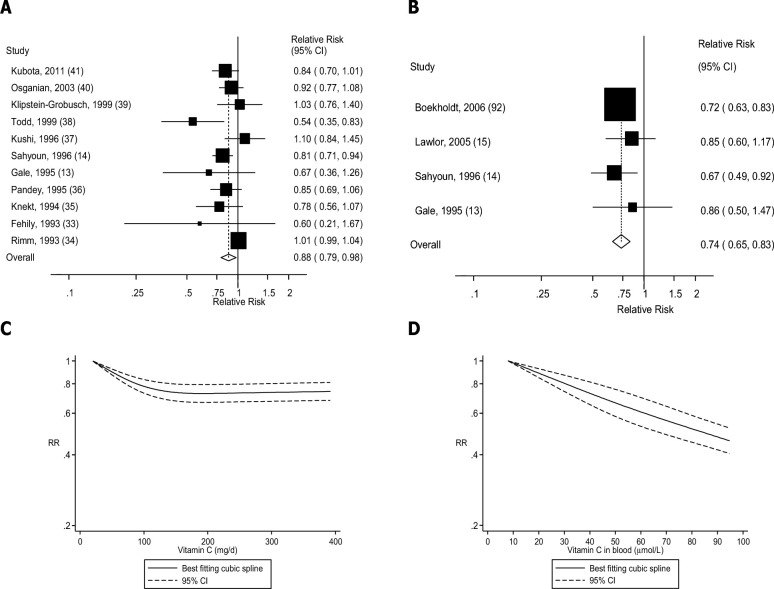
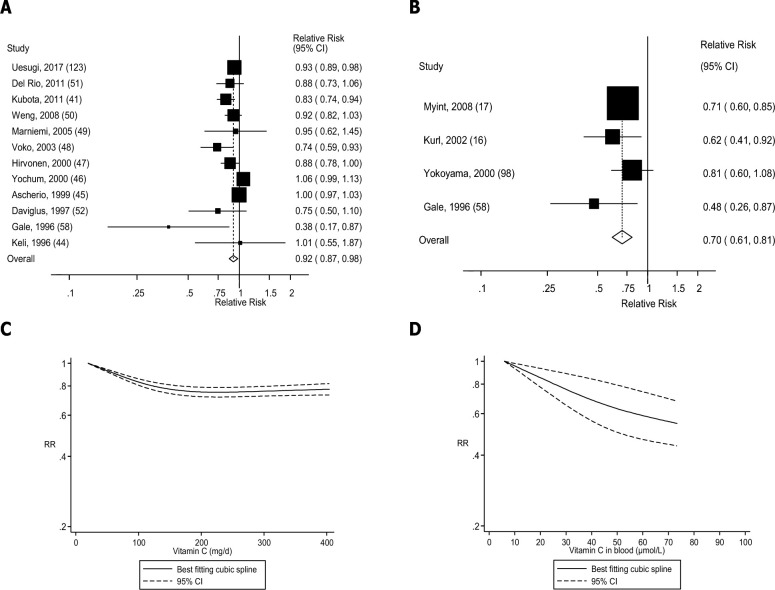
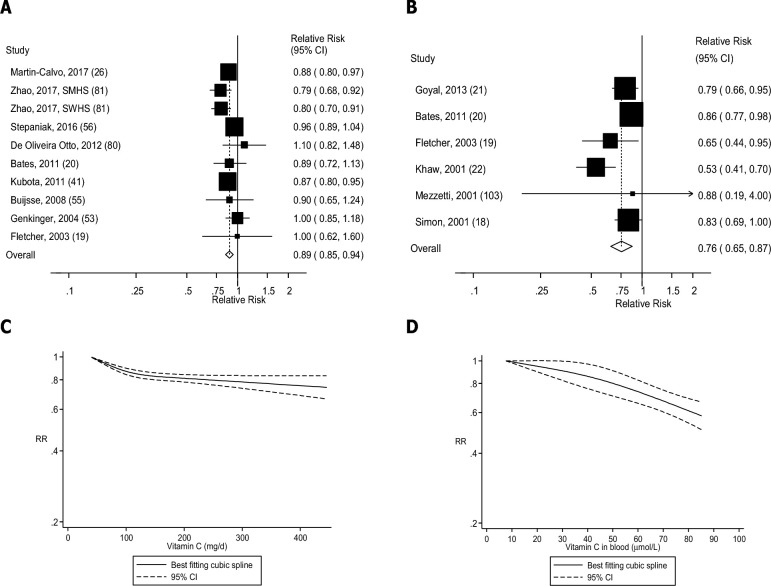
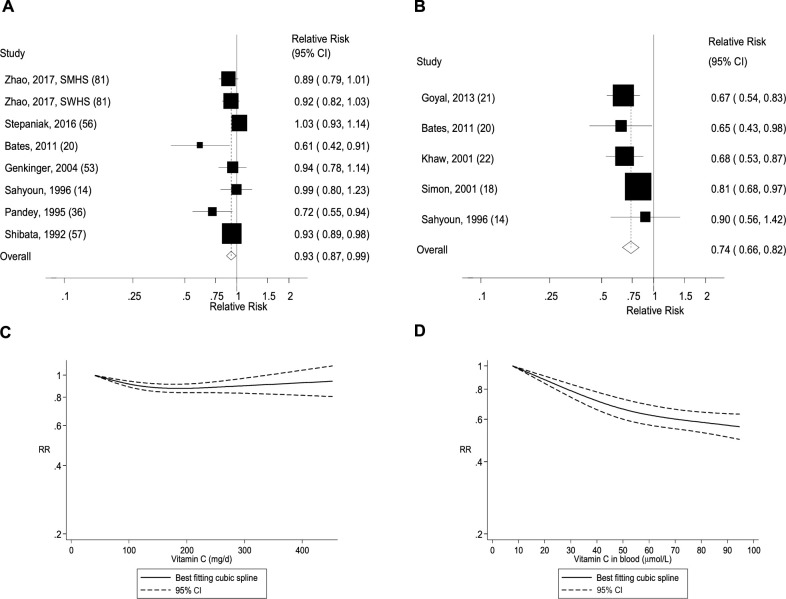
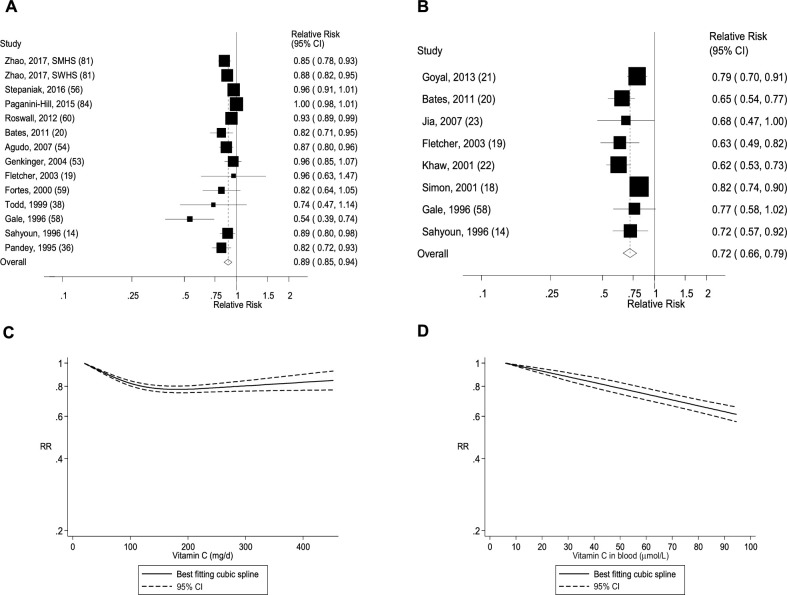
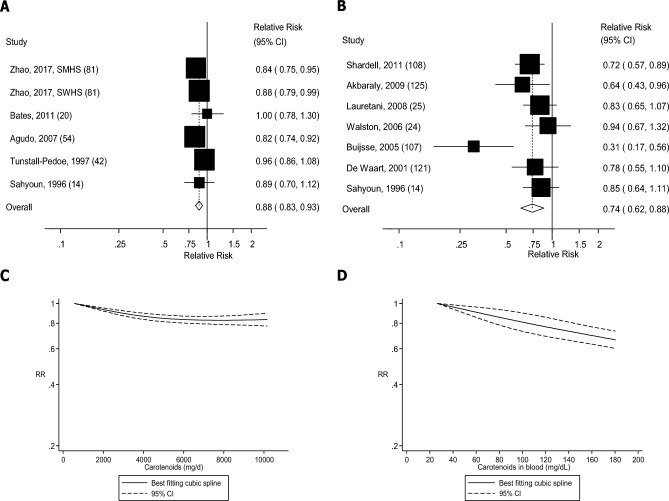
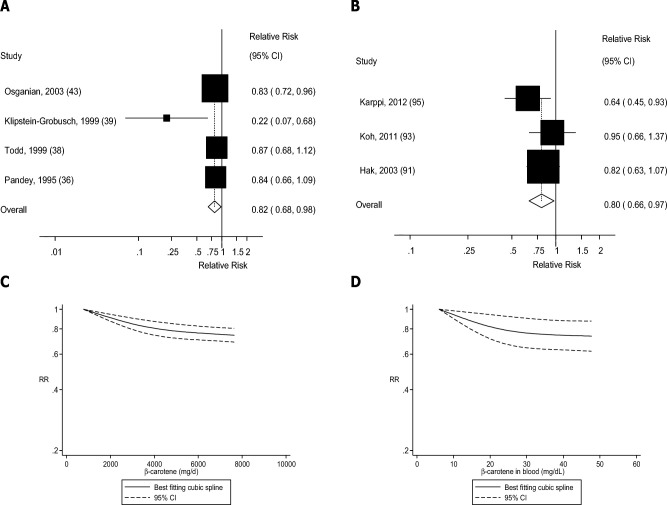
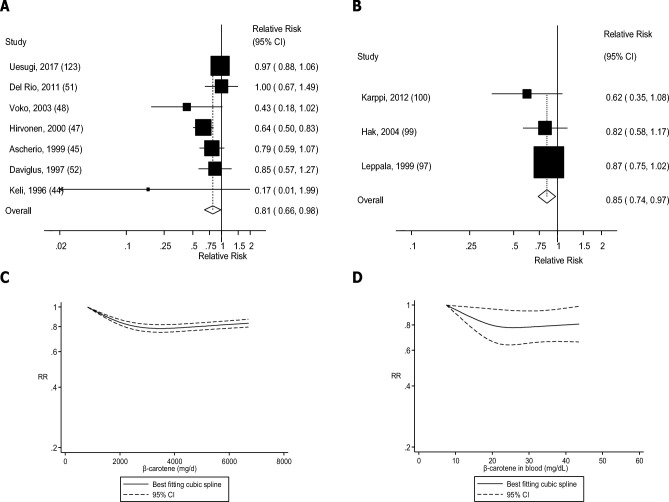
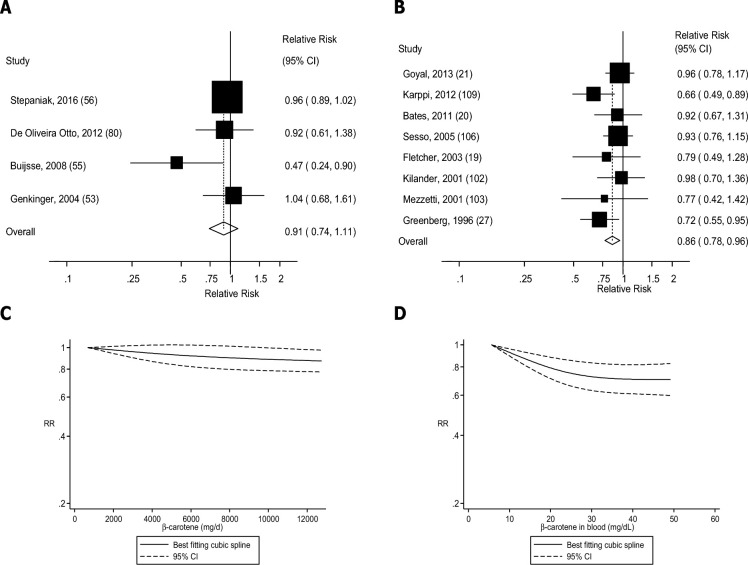
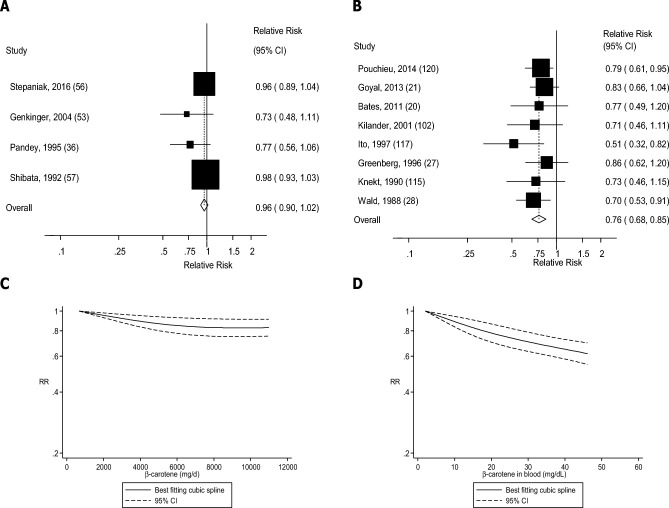
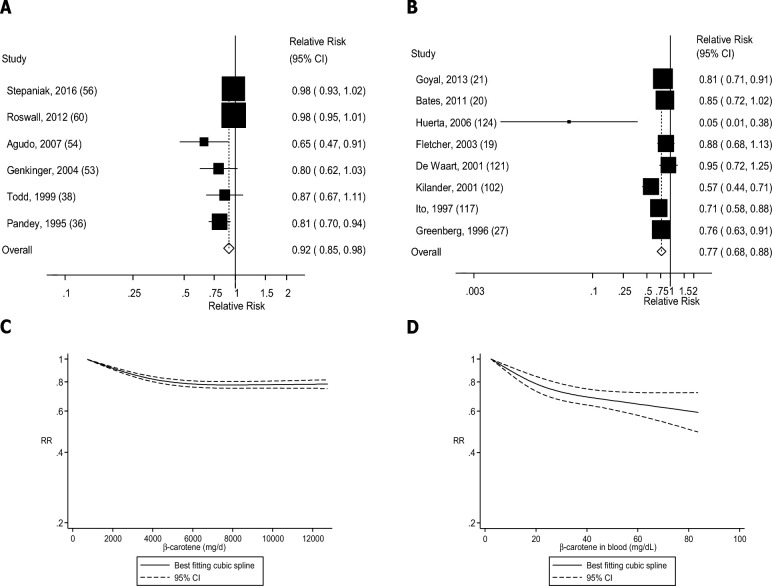
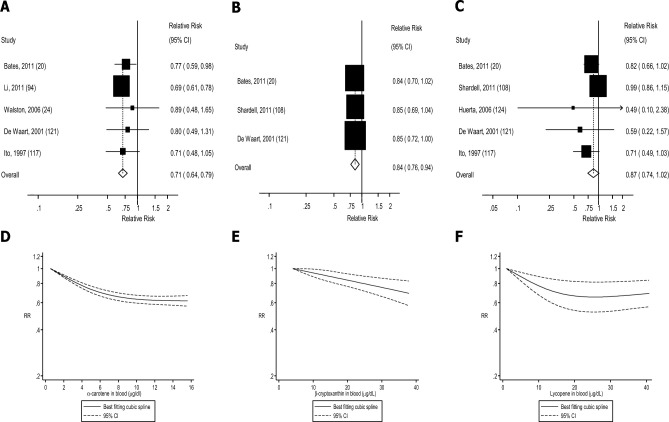
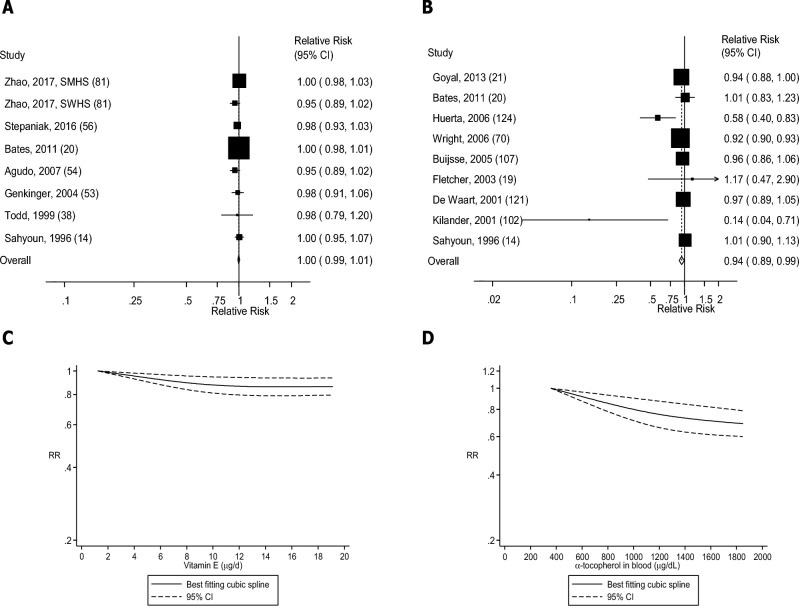
Results: Sixty-nine prospective studies (99 publications) were included. The summary RR per 100-mg/d increment of dietary vitamin C intake was 0.88 (95% CI: 0.79, 0.98, I2 = 65%, n = 11) for coronary heart disease, 0.92 (95% CI: 0.87, 0.98, I2 = 68%, n = 12) for stroke, 0.89 (95% CI: 0.85, 0.94, I2 = 27%, n = 10) for cardiovascular disease, 0.93 (95% CI: 0.87, 0.99, I2 = 46%, n = 8) for total cancer, and 0.89 (95% CI: 0.85, 0.94, I2 = 80%, n = 14) for all-cause mortality. Corresponding RRs per 50-μmol/L increase in blood concentrations of vitamin C were 0.74 (95% CI: 0.65, 0.83, I2 = 0%, n = 4), 0.70 (95% CI: 0.61, 0.81, I2 = 0%, n = 4), 0.76 (95% CI: 0.65, 0.87, I2 = 56%, n = 6), 0.74 (95% CI: 0.66, 0.82, I2 = 0%, n = 5), and 0.72 (95% CI: 0.66, 0.79, I2 = 0%, n = 8). Dietary intake and/or blood concentrations of carotenoids (total, β-carotene, α-carotene, β-cryptoxanthin, lycopene) and α-tocopherol, but not dietary vitamin E, were similarly inversely associated with coronary heart disease, stroke, cardiovascular disease, cancer, and/or all-cause mortality.

Conclusions: Higher dietary intake and/or blood concentrations of vitamin C, carotenoids, and α-tocopherol (as markers of fruit and vegetable intake) were associated with reduced risk of cardiovascular disease, total cancer, and all-cause mortality. These results support recommendations to increase fruit and vegetable intake, but not antioxidant supplement use, for chronic disease prevention.


Figures

FIGURE 1
FIGURE 1
Flow chart of study selection. COPD, chronic obstructive pulmonary disease.
FIGURE 2
FIGURE 2
Dietary intake and blood concentrations of vitamin C and coronary heart disease: dose-response analyses. (A) Dietary vitamin C and coronary heart disease: linear dose-response analysis. The summary RR per 100 mg/d was 0.88 (95% CI: 0.79, 0.98, I2 = 65%, Pheterogeneity = 0.001, n = 11). (B) Vitamin C in blood and coronary heart disease: linear dose-response analysis. The summary RR per 50 µmol/L was 0.74 (95% CI: 0.65, 0.83, I2 = 0%, Pheterogeneity = 0.71, n = 4). (C) Dietary vitamin C and coronary heart disease: nonlinear dose-response analysis. There was evidence of nonlinearity between dietary vitamin C and coronary heart disease (Pnonlinearity < 0.0001). (D) Vitamin C in blood and coronary heart disease: nonlinear dose-response analysis. There was no evidence of nonlinearity for vitamin C in blood and coronary heart disease (Pnonlinearity = 0.49). Summary RRs and 95% CIs were calculated with the use of random-effects models, and the nonlinear dose-response analyses were conducted with the use of restricted cubic splines.
FIGURE 3
FIGURE 3
Dietary intake and blood concentrations of vitamin C and stroke: dose-response analyses. (A) Dietary vitamin C and stroke: linear dose-response analysis. The summary RR per 100 mg/d was 0.92 (95% CI: 0.87, 0.98, I2 = 68%, Pheterogeneity < 0.0001, n = 12). (B) Vitamin C in blood and stroke: linear dose-response analysis. The summary RR per 50 µmol/L was 0.70 (95% CI: 0.61, 0.81, I2 = 0%, Pheterogeneity = 0.41, n = 4). (C) Dietary vitamin C and stroke: nonlinear dose-response analysis. There was evidence of nonlinearity between dietary vitamin C and stroke (Pnonlinearity < 0.0001). (D) Vitamin C in blood and stroke: nonlinear dose-response analysis. There was no evidence of nonlinearity for vitamin C in blood and stroke (Pnonlinearity = 0.16). Summary RRs and 95% CIs were calculated with the use of random-effects models, and the nonlinear dose-response analyses were conducted with the use of restricted cubic splines.
FIGURE 4
FIGURE 4
Dietary intake and blood concentrations of vitamin C and cardiovascular disease: dose-response analyses. (A) Dietary vitamin C and cardiovascular disease: linear dose-response analysis. The summary RR per 100 mg/d was 0.89 (95% CI: 0.85, 0.94, I2 = 27%, Pheterogeneity = 0.19, n = 10). (B) Vitamin C in blood and cardiovascular disease: linear dose-response analysis. The summary RR per 50 µmol/L was 0.76 (95% CI: 0.65, 0.87, I2 = 56%, Pheterogeneity = 0.05, n = 6). (C) Dietary vitamin C and cardiovascular disease: nonlinear dose-response analysis. There was evidence of nonlinearity between dietary vitamin C and cardiovascular disease (Pnonlinearity < 0.0001). (D) Vitamin C in blood and cardiovascular disease: nonlinear dose-response analysis. There was no evidence of nonlinearity for vitamin C in blood and cardiovascular disease (Pnonlinearity = 0.26). Summary RRs and 95% CIs were calculated with the use of random-effects models, and the nonlinear dose-response analyses were conducted with the use of restricted cubic splines. SMHS, Shanghai Men's Health Study; SWHS, Shanghai Women's Health Study.
FIGURE 5
FIGURE 5
Dietary intake and blood concentrations of vitamin C and total cancer: dose-response analyses. (A) Dietary vitamin C and total cancer: linear dose-response analysis. The summary RR per 100 mg/d was 0.93 (95% CI: 0.87, 0.99, I2 = 46%, Pheterogeneity = 0.08, n = 8). (B) Vitamin C in blood and total cancer: linear dose-response analysis. The summary RR per 50 µmol/L was 0.74 (95% CI: 0.66, 0.82, I2 = 0%, Pheterogeneity = 0.49, n = 5). (C) Dietary vitamin C and total cancer: nonlinear dose-response analysis. There was evidence of nonlinearity between dietary vitamin C and total cancer (Pnonlinearity = 0.007). (D) Vitamin C in blood and total cancer: nonlinear dose-response analysis. There was evidence of nonlinearity for vitamin C in blood and total cancer (Pnonlinearity = 0.006). Summary RRs and 95% CIs were calculated with the use of random-effects models, and the nonlinear dose-response analyses were conducted with the use of restricted cubic splines. SMHS, Shanghai Men's Health Study; SWHS, Shanghai Women's Health Study.
FIGURE 6
FIGURE 6
Dietary intake and blood concentrations of vitamin C and mortality: dose-response analyses. (A) Dietary vitamin C and mortality: linear dose-response analysis. The summary RR per 100 mg/d was 0.89 (95% CI: 0.85, 0.94, I2 = 80%, Pheterogeneity < 0.0001, n = 14). (B) Vitamin C in blood and mortality: linear dose-response analysis. The summary RR per 50 µmol/L was 0.72 (95% CI: 0.66, 0.79, I2 = 48%, Pheterogeneity = 0.06, n = 8). (C) Dietary vitamin C and mortality: nonlinear dose-response analysis. There was evidence of nonlinearity between dietary vitamin C and mortality (Pnonlinearity < 0.0001). (D) Vitamin C in blood and mortality: nonlinear dose-response analysis. There was no evidence of nonlinearity for vitamin C in blood and mortality (Pnonlinearity = 0.90). Summary RRs and 95% CIs were calculated with the use of random-effects models, and the nonlinear dose-response analyses were conducted with the use of restricted cubic splines. SMHS, Shanghai Men's Health Study; SWHS, Shanghai Women's Health Study.
FIGURE 7
FIGURE 7
Dietary intake and blood concentrations of carotenoids and mortality: dose-response analyses. (A) Dietary carotenoids and mortality: linear dose-response analysis. The summary RR per 5000 µg/d was 0.88 (95% CI: 0.83, 0.93, I2 = 2%, Pheterogeneity = 0.40, n = 6). (B) Carotenoids in blood and mortality: linear dose-response analysis. The summary RR per 50 µg/dL was 0.69 (95% CI: 0.59, 0.81, I2 = 50%, Pheterogeneity = 0.04, n = 10). (C) Dietary carotenoids and mortality: nonlinear dose-response analysis. There was evidence of nonlinearity between dietary carotenoids and mortality (Pnonlinearity = 0.01). (D) Carotenoids in blood and mortality: nonlinear dose-response analysis. There was no evidence of nonlinearity for vitamin C in blood and mortality (Pnonlinearity = 0.73). Summary RRs and 95% CIs were calculated with the use of random-effects models, and the nonlinear dose-response analyses were conducted with the use of restricted cubic splines. SMHS, Shanghai Men's Health Study; SWHS, Shanghai Women's Health Study.
FIGURE 8
FIGURE 8
Dietary β-carotene and blood concentrations of β-carotene and coronary heart disease: dose-response analyses. (A) Dietary β-carotene and coronary heart disease: linear dose-response analysis. The summary RR per 5000 µg/d was 0.82 (95% CI: 0.68, 0.98, I2 = 45%, Pheterogeneity = 0.14, n = 4). (B) β-Carotene in blood and coronary heart disease: linear dose-response analysis. The summary RR per 25 µg/dL was 0.76 (95% CI: 0.62, 0.93, I= 22%, Pheterogeneity = 0.28, n = 4). (C) Dietary β-carotene and coronary heart disease: nonlinear dose-response analysis. There was evidence of nonlinearity between dietary β-carotene and coronary heart disease (Pnonlinearity = 0.006). (D) β-Carotene in blood and coronary heart disease: nonlinear dose-response analysis. There was evidence of nonlinearity for β-carotene in blood and coronary heart disease (Pnonlinearity = 0.002). Summary RRs and 95% CIs were calculated with the use of random-effects models, and the nonlinear dose-response analyses were conducted with the use of restricted cubic splines.
FIGURE 9
FIGURE 9
(A) Dietary β-carotene and stroke: linear dose-response analyses. The summary RR per 5000 µg/d was 0.81 (95% CI: 0.66, 0.98, I2 = 59%, Pheterogeneity = 0.02, n = 7). (B) β-Carotene in blood and stroke: linear dose-response analysis. The summary RR per 25 µg/dL was 0.85 (95% CI: 0.74, 0.97, I2 = 0%, Pheterogeneity = 0.50, n = 3). (C) Dietary β-carotene and stroke: nonlinear dose-response analysis. There was evidence of nonlinearity between dietary β-carotene and stroke (Pnonlinearity < 0.0001). (D) β-Carotene in blood and stroke: nonlinear dose-response analysis. There was evidence of nonlinearity for β-carotene in blood and stroke (Pnonlinearity = 0.07). Summary RRs and 95% CIs were calculated with the use of random-effects models, and the nonlinear dose-response analyses were conducted with the use of restricted cubic splines.
FIGURE 10
FIGURE 10
Dietary β-carotene and blood concentrations of β-carotene and cardiovascular disease: dose-response analyses. (A) Dietary β-carotene and cardiovascular disease: linear dose-response analysis. The summary RR per 5000 µg/d was 0.87 (95% CI: 0.63, 1.20, I2 = 58%, Pheterogeneity = 0.10, n = 3). (B) β-Carotene in blood and cardiovascular disease: linear dose-response analysis. The summary RR per 25 µg/dL was 0.85 (95% CI: 0.76, 0.95, I2 = 9%, Pheterogeneity = 0.36, n = 7). (C) Dietary β-carotene and cardiovascular disease: nonlinear dose-response analysis. There was no evidence of nonlinearity between dietary β-carotene and cardiovascular disease (Pnonlinearity = 0.51). (D) β-Carotene in blood and cardiovascular disease: nonlinear dose-response analysis. There was evidence of nonlinearity for β-carotene in blood and cardiovascular disease (Pnonlinearity = 0.006). Summary RRs and 95% CIs were calculated with the use of random-effects models, and the nonlinear dose-response analyses were conducted with the use of restricted cubic splines.
FIGURE 11
FIGURE 11
Dietary β-carotene and blood concentrations of β-carotene and total cancer: dose-response analyses. (A) Dietary β-carotene and total cancer: linear dose-response analysis. The summary RR per 5000 µg/d was 0.96 (95% CI: 0.90, 1.02, I2 = 25%, Pheterogeneity = 0.26, n = 4). (B) β-Carotene in blood and total cancer: linear dose-response analysis. The summary RR per 25 µg/dL was 0.77 (95% CI: 0.68, 0.86, I2 = 0%, Pheterogeneity = 0.64, n = 7). (C) Dietary β-carotene and total cancer: nonlinear dose-response analysis. There was evidence of nonlinearity between dietary β-carotene and total cancer (Pnonlinearity = 0.003). (D) β-Carotene in blood and total cancer: nonlinear dose-response analysis. There was evidence of nonlinearity for β-carotene in blood and total cancer (Pnonlinearity = 0.60). Summary RRs and 95% CIs were calculated with the use of random-effects models, and the nonlinear dose-response analyses were conducted with the use of restricted cubic splines.
FIGURE 12
FIGURE 12
Dietary intake and blood concentrations of β-carotene and mortality: dose-response analyses. (A) Dietary β-carotene and mortality: linear dose-response analysis. The summary RR per 5000 µg/d was 0.92 (95% CI: 0.85, 0.98, I2 = 66%, Pheterogeneity = 0.01, n = 6). (B) β-Carotene in blood and mortality: linear dose-response analysis. The summary RR per 25 µg/dL was 0.81 (95% CI: 0.72, 0.90, I2 = 47%, Pheterogeneity = 0.08, n = 7). (C) Dietary β-carotene and mortality: nonlinear dose-response analysis. There was evidence of nonlinearity between dietary β-carotene and mortality (Pnonlinearity ≤ 0.0001). (D) β-Carotene in blood and mortality: nonlinear dose-response analysis. There was evidence of nonlinearity for β-carotene in blood and mortality (Pnonlinearity = 0.005). Summary RRs and 95% CIs were calculated with the use of random-effects models, and the nonlinear dose-response analyses were conducted with the use of restricted cubic splines.
FIGURE 13
FIGURE 13
Blood concentrations of α-carotene, β-cryptoxanthin, and lycopene and mortality: dose-response analyses. (A) Blood concentrations of α-carotene and mortality: linear dose-response analysis. The summary RR per 10 µg/dL was 0.71 (95% CI: 0.64, 0.79, I2 = 0%, Pheterogeneity = 0.86, n = 5). (B) Blood concentrations of β-cryptoxanthin and mortality: linear dose-response analysis. The summary RR per 15 µg/dL was 0.84 (95% CI: 0.76, 0.94, I= 0%, Pheterogeneity = 0.99, n = 3). (C) Blood concentrations of lycopene and mortality: linear dose-response analysis. The summary RR per 25 µg/dL was 0.87 (95% CI: 0.74, 1.02, I2 = 26%, Pheterogeneity = 0.25, n = 5). (D) Blood concentrations of α-carotene and mortality, nonlinear dose-response analysis. There was evidence of nonlinearity between α-carotene in blood and mortality (Pnonlinearity ≤ 0.0001). (E) Blood concentrations of β-cryptoxanthin and mortality: nonlinear dose-response analysis. There was no evidence of nonlinearity for β-cryptoxanthin in blood and mortality (Pnonlinearity = 0.98). (F) Blood concentrations of lycopene and mortality: nonlinear dose-response analysis. There was evidence of nonlinearity for lycopene in blood and mortality (Pnonlinearity = 0.001). Summary RRs and 95% CIs were calculated with the use of random-effects models, and the nonlinear dose-response analyses were conducted using restricted cubic splines.
FIGURE 14
FIGURE 14
(A) Dietary intake of vitamin E and mortality: linear dose-response analysis. The summary RR per 5 µg/d was 0.99 (95% CI: 0.96, 1.01, I2 = 42%, Pheterogeneity = 0.10, n = 8). (B) Blood concentrations of α-tocopherol and mortality: linear dose-response analysis. The summary RR per 500 µg/dL was 0.94 (95% CI: 0.90, 0.98, I2 = 43%, Pheterogeneity = 0.09, n = 8). (C) Dietary intake of vitamin E and mortality: nonlinear dose-response analysis. There was evidence of nonlinearity between dietary vitamin E and mortality (Pnonlinearity < 0.0001). (D) Blood concentrations of α-tocopherol and mortality: nonlinear dose-response analysis. There was indication of nonlinearity for α-tocopherol in blood and mortality (Pnonlinearity = 0.05). Summary RRs and 95% CIs were calculated with the use of random-effects models, and the nonlinear dose-response analyses were conducted with the use of restricted cubic splines. SMHS, Shanghai Men's Health Study; SWHS, Shanghai Women's Health Study.

References

    1. GBD 2013 Mortality and Causes of Death Collaborators Global, regional, and national age–sex specific all-cause and cause-specific mortality for 240 causes of death, 1990–2013: a systematic analysis for the Global Burden of Disease Study 2013. Lancet 2015;385:117–71. - PMC - PubMed
    1. Leenders M, Sluijs I, Ros MM, Boshuizen HC, Siersema PD, Ferrari P, Weikert C, Tjonneland A, Olsen A, Boutron-Ruault MC et al. .. Fruit and vegetable consumption and mortality: European Prospective Investigation into Cancer and Nutrition. Am J Epidemiol 2013;178:590–602. - PubMed
    1. Boffetta P, Couto E, Wichmann J, Ferrari P, Trichopoulos D, Bueno-de-Mesquita HB, van Duijnhoven FJ, Buchner FL, Key T, Boeing H et al. .. Fruit and vegetable intake and overall cancer risk in the European Prospective Investigation into Cancer and Nutrition (EPIC). J Natl Cancer Inst 2010;102:529–37. - PubMed
    1. Aune D, Lau R, Chan DS, Vieira R, Greenwood DC, Kampman E, Norat T. Nonlinear reduction in risk for colorectal cancer by fruit and vegetable intake based on meta-analysis of prospective studies. Gastroenterology 2011;141:106–18. - PubMed
    1. Aune D, Chan DS, Vieira AR, Rosenblatt DA, Vieira R, Greenwood DC, Norat T. Fruits, vegetables and breast cancer risk: a systematic review and meta-analysis of prospective studies. Breast Cancer Res Treat 2012;134:479–93. - PubMed

Publication types

MeSH terms