. 2018 Nov 1;20(suppl_3):iii3-iii15.
doi: 10.1093/europace/euy235.

Determinants of new wavefront locations in cholinergic atrial fibrillation

Affiliations

Determinants of new wavefront locations in cholinergic atrial fibrillation

Caroline H Roney et al. Europace. .

Abstract

Aims: Atrial fibrillation (AF) wavefront dynamics are complex and difficult to interpret, contributing to uncertainty about the mechanisms that maintain AF. We aimed to investigate the interplay between rotors, wavelets, and focal sources during fibrillation.

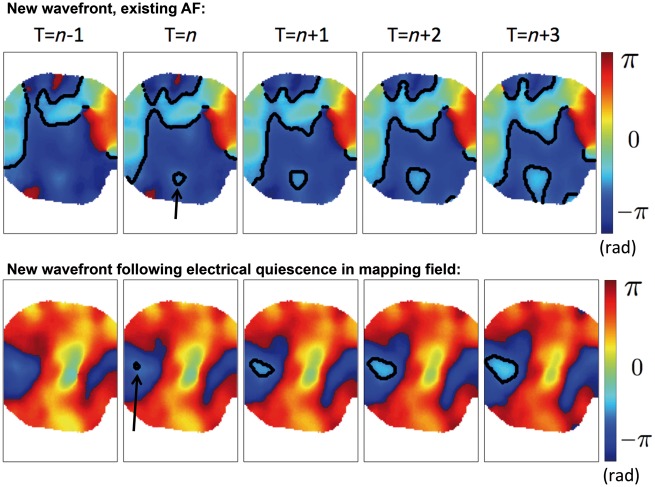
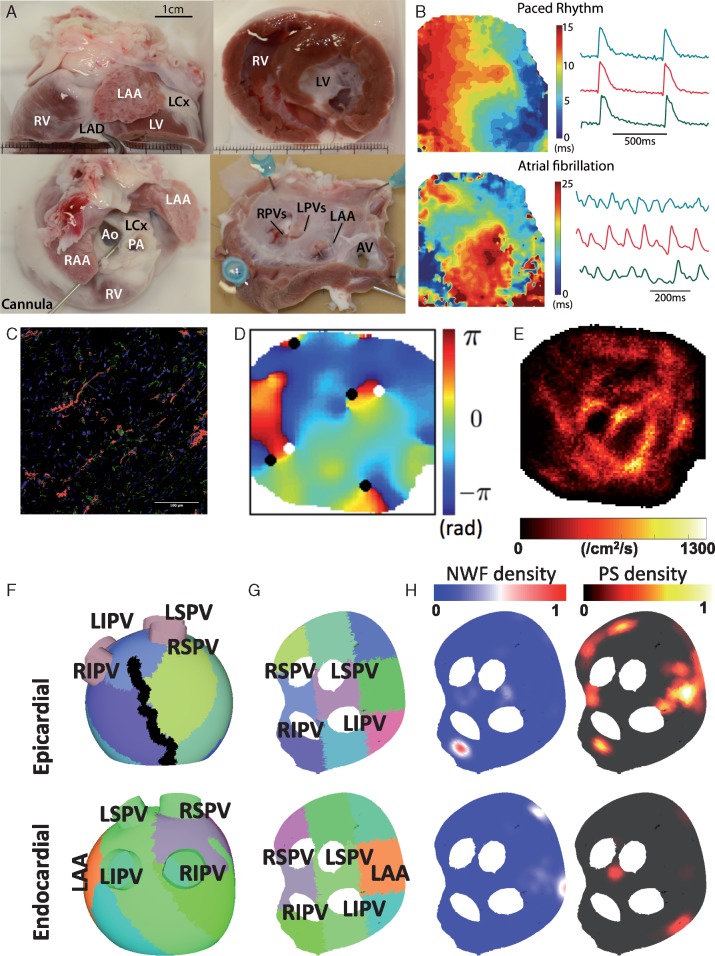
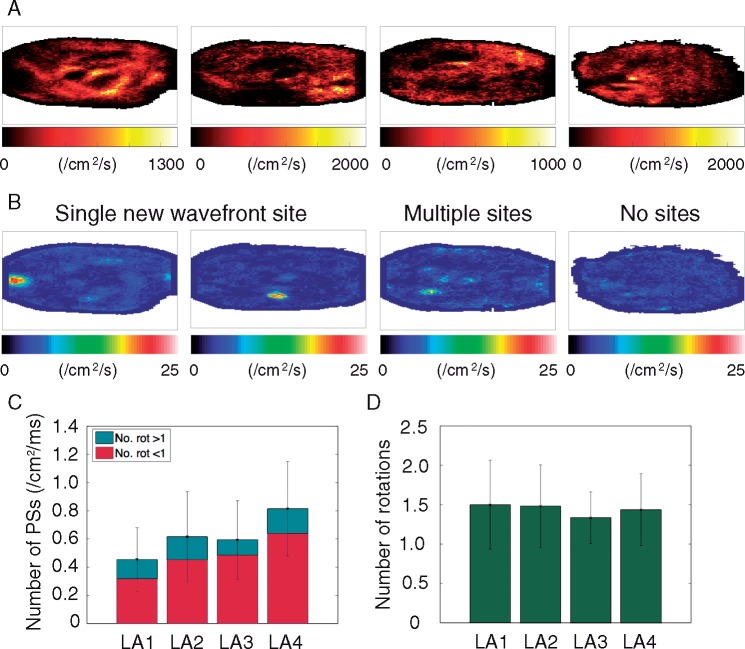
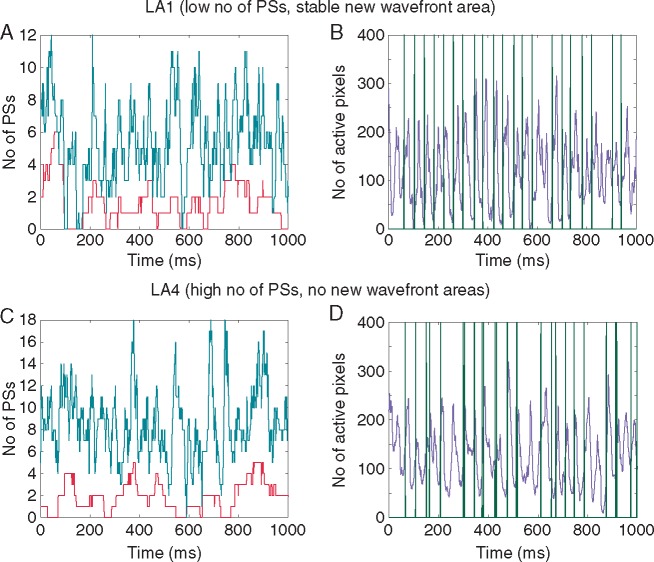
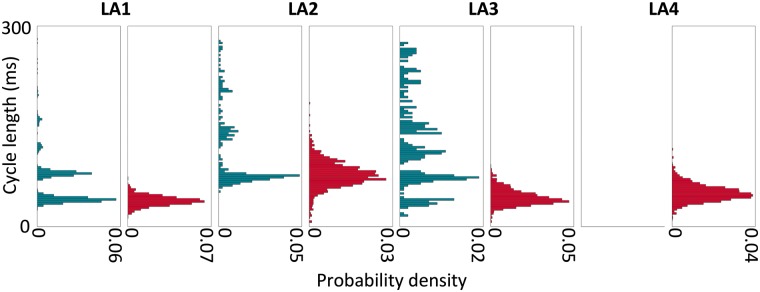
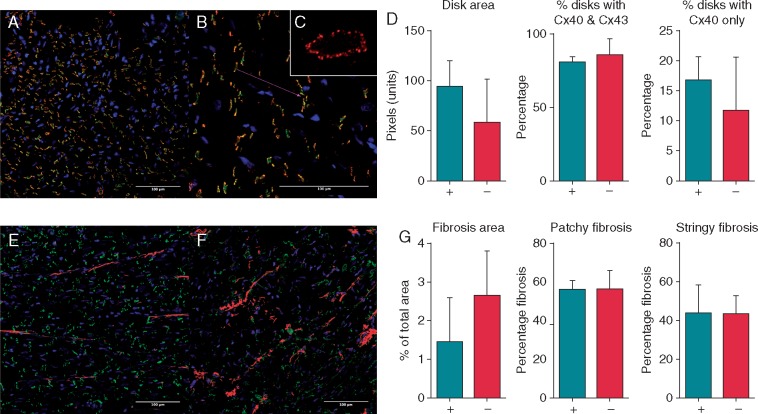
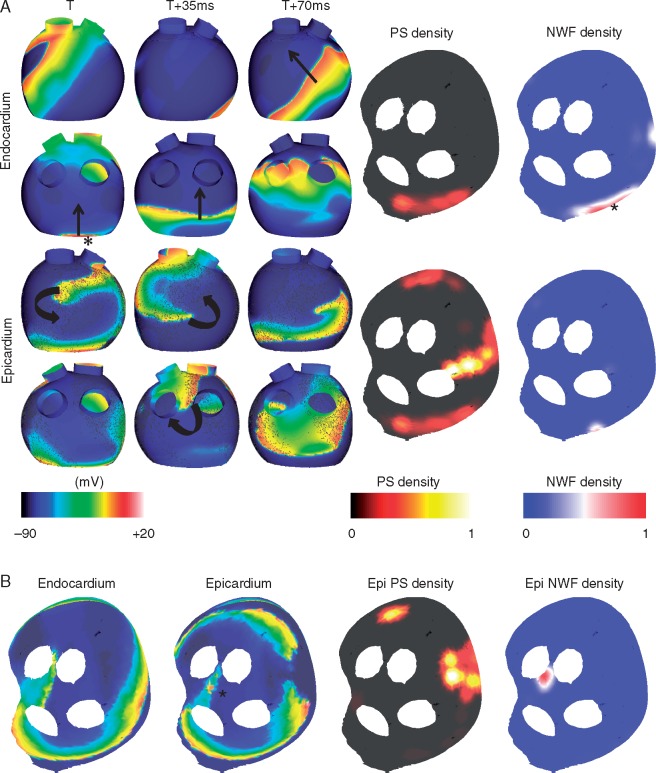
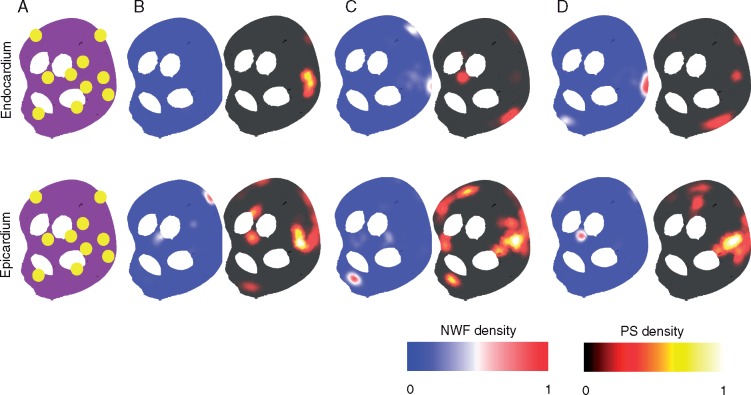
Methods and results: Arrhythmia wavefront dynamics were analysed for four optically mapped canine cholinergic AF preparations. A bilayer computer model was tuned to experimental preparations, and varied to have (i) fibrosis in both layers or the epicardium only, (ii) different spatial acetylcholine distributions, (iii) different intrinsic action potential duration between layers, and (iv) varied interlayer connectivity. Phase singularities (PSs) were identified and tracked over time to identify rotational drivers. New focal wavefronts were identified using phase contours. Phase singularity density and new wavefront locations were calculated during AF. There was a single dominant mechanism for sustaining AF in each of the preparations, either a rotational driver or repetitive new focal wavefronts. High-density PS sites existed preferentially around the pulmonary vein junctions. Three of the four preparations exhibited stable preferential sites of new wavefronts. Computational simulations predict that only a small number of connections are functionally important in sustaining AF, with new wavefront locations determined by the interplay between fibrosis distribution, acetylcholine concentration, and heterogeneity in repolarization within layers.

Conclusion: We were able to identify preferential sites of new wavefront initiation and rotational activity, in order to determine the mechanisms sustaining AF. Electrical measurements should be interpreted differently according to whether they are endocardial or epicardial recordings.


Figures

Figure 1
Figure 1
New wavefronts are identified as instances of active pixels that cannot be explained by propagation from active pixels in the previous frame, and occur during existing AF or following electrical quiescence in the mapping field. Sequential frames are shown in which a new wavefront in the mapping field is seen in frame T = n, which cannot be explained by any nearby active pixels in frame T = n−1. The new wavefront is seen to propagate focally. Top row: there are other wavefronts within the mapping field at T = n-1, and so this is termed to be a new wavefront, in which there is existing AF. Bottom row: there are no active pixels in frame T = n−1, and so this is termed to be a new wavefront following electrical quiescence in the mapping field. AF, atrial fibrillation.
Figure 2
Figure 2
Experimental and computational model set-up. (A) Experimental preparation—canine hearts donated by collaborators were dissected and the isolated left atrium perfused via the circumflex artery for left atrial endocardial optical mapping. (B) Examples of activation maps and optical action potentials during pacing and in AF for this experimental set-up, generated using the Rhythm GUI. (C) Areas of fibrosis quantified using autofluorescence (red). (D) Phase map showing phase singularities (black and white circles, depending on chirality). (E) PS density map. (F) Computational mesh used for simulations divided into nine regions to correspond with experimental sections used for histomorphometry and immunohistochemistry. An ablation line corresponding to the location used to open the tissue for endocardial optical mapping is also marked in black. The LAA location is also marked for comparison with B. (G) The mesh is flattened for visualization purposes, in the same way as the experimental preparation. (H) Example NWF density and PS density maps. AF, atrial fibrillation; Ao, aorta; AV, aortic valve; LAA, left atrial appendage; LAD, left anterior descending artery; LCX, left circumflex artery; LIPV, left inferior PV; LV, left ventricle; LPVs, left pulmonary veins; LSPV, left superior PV; PA, pulmonary artery; PS, phase singularity; PV, pulmonary vein; RAA, right atrial appendage; RV, right ventricle; RIPV, right inferior PV; RPVs, right pulmonary veins; RSPV, right superior pulmonary vein; NWF, new wavefront.
Figure 3
Figure 3
Three out of four of the preparations exhibit clear sites of new wavefront initiation. (A) PS density maps. (B) Two of the preparations exhibit a single high-density new wavefront initiation site (LA1 and LA2); one preparation shows multiple preferential sites (LA3); and one preparation demonstrates no preferential sites (LA4). (C) Average number of phase singularities and rotors vary across preparations and are highest for LA4. (D) Average number of rotations are similar across preparations. PS, phase singularity; Rot, rotations.
Figure 4
Figure 4
Investigating the number of rotors, PSs, active tissue pixels and new wavefronts over time indicates the nature of AF. For LA1, AF is sustained by new wavefronts (A and B). For LA4, AF is sustained by rotational activity (C and D). (A) Number of rotors (PS lasting greater than one rotation, in red) and number of PSs (teal line) over time; (B) Number of active pixels in violet and timings of new wavefront initiations in green. The timings of the new wavefront initiations can be seen to coincide with times when the number of active tissue pixels drops to zero, triggering the re-initiation of AF in the mapping field. (C) Number of rotors (PS lasting greater than one rotation, in red) and number of PSs (teal line) over time. (D) Number of active pixels in violet and timings of new wavefront initiations in green, where the new wavefront initiations can occur anywhere in the domain. In this preparation, new wavefront initiations do not appear to play a dominant role in the wavefront patterns observed on the endocardium. AF, atrial fibrillation; PS, phase singularity.
Figure 5
Figure 5
Probability density histograms show distributions of CLs for the high-density site of new wavefronts and for rotors exhibit differences between preparations. CLs measured during the recordings are displayed as probability density histograms, with teal histograms showing new wavefront CLs and red histograms showing rotor CLs. For LA4, there were no preferential sites of new wavefront initiations, so only the distribution of rotor CLs is considered. CL, cycle length.
Figure 6
Figure 6
No correlation between phase singularity location and connexin or fibrosis content. (A and B) Connexin40 (green) and connexin43 (red) immunolabel viewed at ×20 and ×40 magnification, respectively. Areas of Cx40 and Cx43 colocalization shown in yellow. (C) Intercalated disk viewed en face at ×60 magnification for disk size quantification. (D) Comparison of regions with high rotor densities (+) vs. regions with low rotor densities (−) showed no differences in intercalated disk size or Cx40 or Cx43 distribution/percentage. (E and F) Areas of fibrosis quantified using autofluorescence (red). (G) Percentage of fibrosis by area was compared between left atrial regions with high rotor densities (+) vs. regions with low rotor densities (×). Fibrosis area was not different between these regions. Fibrosis was subdivided into stringy (interstitial fibrosis) (shown in E) and patchy fibrosis (F), which was also not different between groups.
Figure 7
Figure 7
Simulations demonstrate preferential sites of new wavefront breakthrough, together with rotational activity anchored to fibrosis and long APD, or meandering around the LA/PV junction. (A) A site of wavefront breakthrough can be seen on the posterior wall of the endocardium, by the mitral valve (indicated by the asterisk). Transmembrane plots are shown in anteroposterior (top) and posteroanterior view (bottom), for the endocardium and epicardium. PS density and NWF density maps are shown in the flattened view for the endocardium and epicardium (see Figure 2G for orientation). The asterisk shows the site of breakthrough. High PS density is seen on the epicardium, in an area of increased fibrosis and long APD. (B) This simulation exhibits epicardial breakthrough (asterisk), and endocardial reentry around the LA/PV junction. No breakthrough is observed on the endocardium so PS density and NWF density maps are shown for the epicardium only. A single NWF site is seen on the epicardium. APD, action potential duration; LA, left atrium; PV, pulmonary vein; PS, phase singularity; NWF, new wavefront.
Figure 8
Figure 8
A small number of preferential sites for new wavefronts are observed in simulations with a larger number of connection points. (A) Ten randomly generated connection locations shown in yellow. (B) Set-up with epicardial fibrosis, identical acetylcholine islands, and an APD gradient between surfaces. The APD gradient between the surfaces means that no new wavefronts are seen on the endocardial surface. A single preferential site of new wavefronts can be seen on the epicardium. (C) Set-up with epicardial fibrosis, identical acetylcholine islands, and no APD gradient between surfaces. The removal of the APD gradient means breakthrough occurs on both surfaces. There is more complicated conduction on the epicardium than endocardium due to the epicardial fibrosis, leading to more areas of high PS density. (D) Set-up with epicardial fibrosis, identical acetylcholine islands with increased endocardial acetylcholine concentration, and no APD gradient between surfaces. PS density maps are similar to C, but preferential sites of breakthrough are in different locations. These sites are different for the endocardium and epicardium. APD, action potential duration; PS, phase singularity; NWF, new wavefront.

Similar articles

Cited by

References

    1. Moe G, Rheinboldt W, Abildskov J.. A computer model of atrial fibrillation. Am Heart J 1964;67:200–20. - PubMed
    1. Verheule S, Tuyls E, van Hunnik A, Kuiper M, Schotten U, Allessie M.. Fibrillatory conduction in the atrial free walls of goats in persistent and permanent atrial fibrillation. Circ Arrhythm Electrophysiol 2010;3:590–9. - PubMed
    1. Lee S, Sahadevan J, Khrestian CM, Durand DM, Waldo AL.. High density mapping of atrial fibrillation during vagal nerve stimulation in the canine heart: restudying the Moe hypothesis. J Cardiovasc Electrophysiol 2013;24:328–35. - PubMed
    1. Narayan SM, Krummen DE, Rappel W-J.. Clinical mapping approach to diagnose electrical rotors and focal impulse sources for human atrial fibrillation. J Cardiovasc Electrophysiol 2012;23:447–54. - PMC - PubMed
    1. Sanders P, Berenfeld O, Hocini M, Jaïs P, Vaidyanathan R, Hsu L-F.. Spectral analysis identifies sites of high-frequency activity maintaining atrial fibrillation in humans. Circulation 2005;112:789–97. - PubMed