

A Quantitative Analysis of Colonic Mucosal Oxylipins and Endocannabinoids in Treatment-Naïve and Deep Remission Ulcerative Colitis Patients and the Potential Link With Cytokine Gene Expression
- PMID: 30476077
- PMCID: PMC6383859
- DOI: 10.1093/ibd/izy349
A Quantitative Analysis of Colonic Mucosal Oxylipins and Endocannabinoids in Treatment-Naïve and Deep Remission Ulcerative Colitis Patients and the Potential Link With Cytokine Gene Expression
Abstract
Background: The bioactive metabolites of omega 3 and omega 6 polyunsaturated fatty acids (ω-3 and ω-6) are known as oxylipins and endocannabinoids (eCBs). These lipid metabolites are involved in prompting and resolving the inflammatory response that leads to the onset of inflammatory bowel disease (IBD). This study aims to quantify these bioactive lipids in the colonic mucosa and to evaluate the potential link to cytokine gene expression during inflammatory events in ulcerative colitis (UC).
Methods: Colon biopsies were taken from 15 treatment-naïve UC patients, 5 deep remission UC patients, and 10 healthy controls. Thirty-five oxylipins and 11 eCBs were quantified by means of ultra-high-performance liquid chromatography coupled with tandem mass spectrometry. Levels of mRNA for 10 cytokines were measured by reverse transcription polymerase chain reaction.
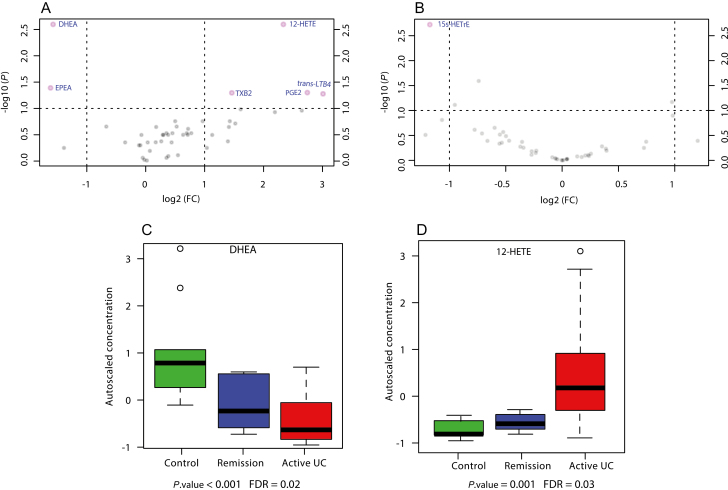
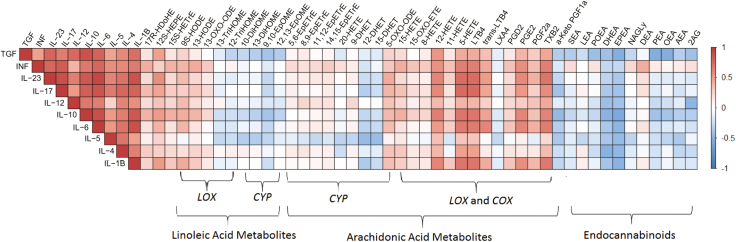
Results: Levels of ω-6-related oxylipins were significantly elevated in treatment-naïve patients with respect to controls, whereas the levels of ω-3 eCBs were lower. 15S-Hydroxy-eicosatrienoic acid (15S-HETrE) was significantly upregulated in UC deep remission patients compared with controls. All investigated cytokines had significantly higher mRNA levels in the inflamed mucosa of treatment-naïve UC patients. Cytokine gene expression was positively correlated with several ω-6 arachidonic acid-related oxylipins, whereas negative correlation was found with lipoxin, prostacyclin, and the eCBs.
Conclusions: Increased levels of ω-6-related oxylipins and decreased levels of ω-3-related eCBs are associated with the debut of UC. This highlights the altered balance between pro- and anti-inflammatory lipid mediators in IBD and suggests potential targets for intervention.
Keywords: DHEA; EPEA; IBD; PUFA; eicosanoids.
© 2018 Crohn’s & Colitis Foundation. Published by Oxford University Press on behalf of Crohn’s & Colitis Foundation.
Figures
References
-
- Kaplan GG. The global burden of IBD: from 2015 to 2025. Nat Rev Gastroenterol Hepatol. 2015;12:720–727. - PubMed
-
- Sjöqvist U, Hertervig E, Nilsson A, et al. Chronic colitis is associated with a reduction of mucosal alkaline sphingomyelinase activity. Inflamm Bowel Dis. 2002;8:258–263. - PubMed
-
- Wolfer AM, Gaudin M, Taylor-Robinson SD, et al. Development and validation of a high-throughput ultrahigh-performance liquid chromatography-mass spectrometry approach for screening of oxylipins and their precursors. Anal Chem. 2015;87:11721–11731. - PubMed
Publication types
MeSH terms
Substances
LinkOut - more resources
Full Text Sources
Medical
Molecular Biology Databases
