. 2019 Apr 1;28(7):1199-1211.
doi: 10.1093/hmg/ddy409.

Sequence variants associating with urinary biomarkers

Affiliations

Sequence variants associating with urinary biomarkers

Stefania Benonisdottir et al. Hum Mol Genet. .

Abstract

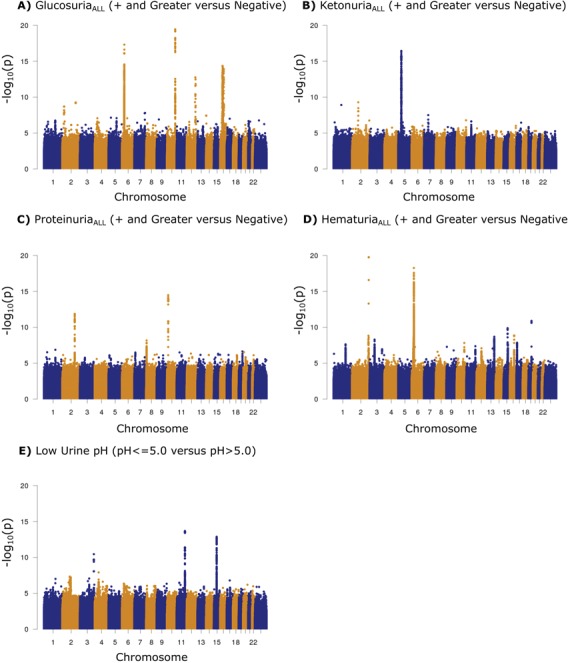
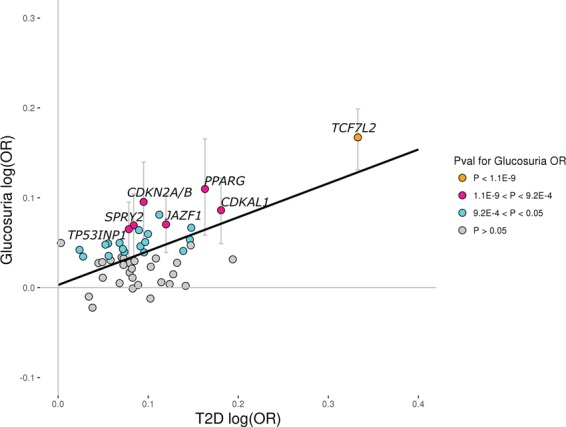
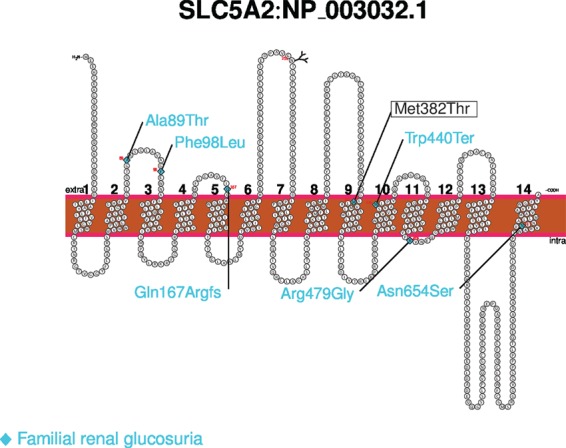
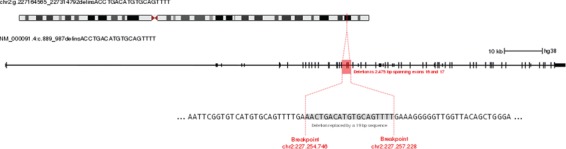
Urine dipstick tests are widely used in routine medical care to diagnose kidney and urinary tract and metabolic diseases. Several environmental factors are known to affect the test results, whereas the effects of genetic diversity are largely unknown. We tested 32.5 million sequence variants for association with urinary biomarkers in a set of 150 274 Icelanders with urine dipstick measurements. We detected 20 association signals, of which 14 are novel, associating with at least one of five clinical entities defined by the urine dipstick: glucosuria, ketonuria, proteinuria, hematuria and urine pH. These include three independent glucosuria variants at SLC5A2, the gene encoding the sodium-dependent glucose transporter (SGLT2), a protein targeted pharmacologically to increase urinary glucose excretion in the treatment of diabetes. Two variants associating with proteinuria are in LRP2 and CUBN, encoding the co-transporters megalin and cubilin, respectively, that mediate proximal tubule protein uptake. One of the hematuria-associated variants is a rare, previously unreported 2.5 kb exonic deletion in COL4A3. Of the four signals associated with urine pH, we note that the pH-increasing alleles of two variants (POU2AF1, WDR72) associate significantly with increased risk of kidney stones. Our results reveal that genetic factors affect variability in urinary biomarkers, in both a disease dependent and independent context.


Figures

Figure 1
Figure 1
Manhattan plots for the five urinary traits with significant variant associations. Variants are plotted by chromosomal position (x-axis) and −log10P-values (y-axis). The five traits were tested as categorical traits. We divided Icelanders with urine dipstick measurements (N = 150 274) into cases and controls based on their measured strength of the trait in question: (A) glucosuriaALL (Ncases = 10 857, Ncontrols = 135 512), (B) ketonuriaALL (Ncases = 41 130, Ncontrols = 95 568), (C) proteinuriaALL (Ncases = 54 009, Ncontrols = 91 538), (D) hematuriaALL (Ncases = 68 051, Ncontrols = 68 903) and (E) low urine pH (Ncases = 35 897, Ncontrols = 112 302). A likelihood ratio test was used when testing for association.
Figure 2
Figure 2
Reported T2D variants and the risk of glucosuria. Scatter plot showing 54 previously reported lead T2D SNPs at established T2D loci that, in a study by the DIAGRAM Consortium (2014) (11), associate with T2D in a subset of Europeans with P < 0.05. The x-axis shows their effect on T2D in the DIAGRAM (2012) data (12), excluding Icelanders (Ncases = 10 706; Ncontrols = 33 668), and the y-axis shows their effect on glucosuria risk (mild, moderate and severe cases (+ and greater) versus negative controls) in the Icelandic dataset (Ncases = 10 857; Ncontrols = 135 512). The black solid line (y = 0.003 + 0.38×) represents results from a simple linear regression using MAF(1-MAF) as weights with R2 = 0.36 (P = 1.6E-6; two-sided t-test). The colors of the circles represent their P-values for the glucosuria OR in the Icelandic dataset. Orange dots represent variants that associate with glucosuria with P < 1.1E-9, pink dots represent variants that associate with glucosuria with 1.1E-9 < P < 9.2E-4, cyan dots represent variants that associate with glucosuria with 9.2E-4 < P < 0.05 and gray dots represent variants that associate with glucosuria with P > 0.05. 95% confidence intervals for the glucosuria OR are shown for variants that associate with glucosuria risk in the Icelandic dataset with P < 9.2E-4 (0.05/54) and are depicted as gray vertical lines. Our data indicate that the effect on glucosuria is proportional to effect on T2D, as expected.
Figure 3
Figure 3
The Met382Thr variant in SLC5A2 schematic diagram showing the Met382Thr missense variant in the SLC5A2 gene product (NP_003032.1), in relation to mutations causing familial renal glucosuria classified as pathogenic and likely pathogenic according to the ClinVar database (shown in blue here).
Figure 4
Figure 4
The 2.5 kb deletion in COL4A3 Schematic diagram showing the location of the COL4A3 deletion in the context of the exon structure of the transcript NM_00091.

References

    1. Suhre K., Wallaschofski H., Raffler J., Friedrich N., Haring R., Michael K., Wasner C., Krebs A., Kronenberg F., Chang D. et al. (2011) A genome-wide association study of metabolic traits in human urine. Nat. Genet., 43, 565–569. - PubMed
    1. Tesch G.H. (2010) Review: Serum and urine biomarkers of kidney disease: a pathophysiological perspective. Nephrology, 15, 609–616. - PubMed
    1. Simerville J.A., Maxted W.C. and Pahira J.J. (2005) Urinalysis: a comprehensive review. Am. Fam. Physician, 71, 1153–1162. - PubMed
    1. Rao P.K. and Jones J.S. (2008) How to evaluate ‘dipstick hematuria’: what to do before you refer. Cleve. Clin. J. Med., 75, 227–233. - PubMed
    1. Kong A., Masson G., Frigge M.L., Gylfason A., Zusmanovich P., Thorleifsson G., Olason P.I., Ingason A., Steinberg S., Rafnar T. et al. (2008) Detection of sharing by descent, long-range phasing and haplotype imputation. Nat. Genet., 40, 1068–1075. - PMC - PubMed

MeSH terms