. 2019 Jan 28;58(5):1361-1365.
doi: 10.1002/anie.201811257. Epub 2018 Dec 21.

A Chemiluminescent Probe for HNO Quantification and Real-Time Monitoring in Living Cells

Affiliations

A Chemiluminescent Probe for HNO Quantification and Real-Time Monitoring in Living Cells

Weiwei An et al. Angew Chem Int Ed Engl. .

Abstract

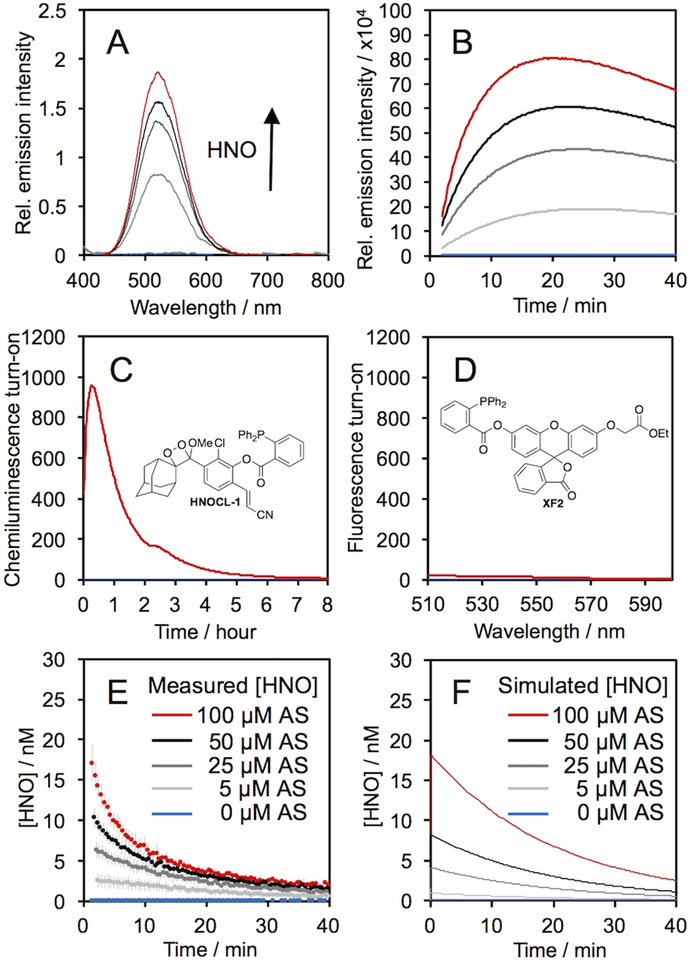
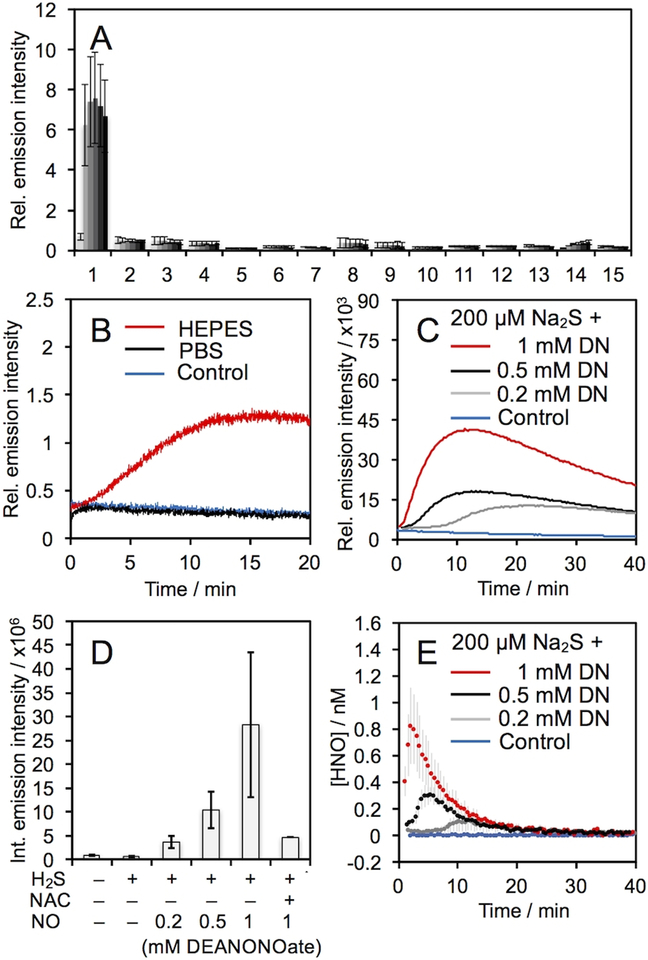
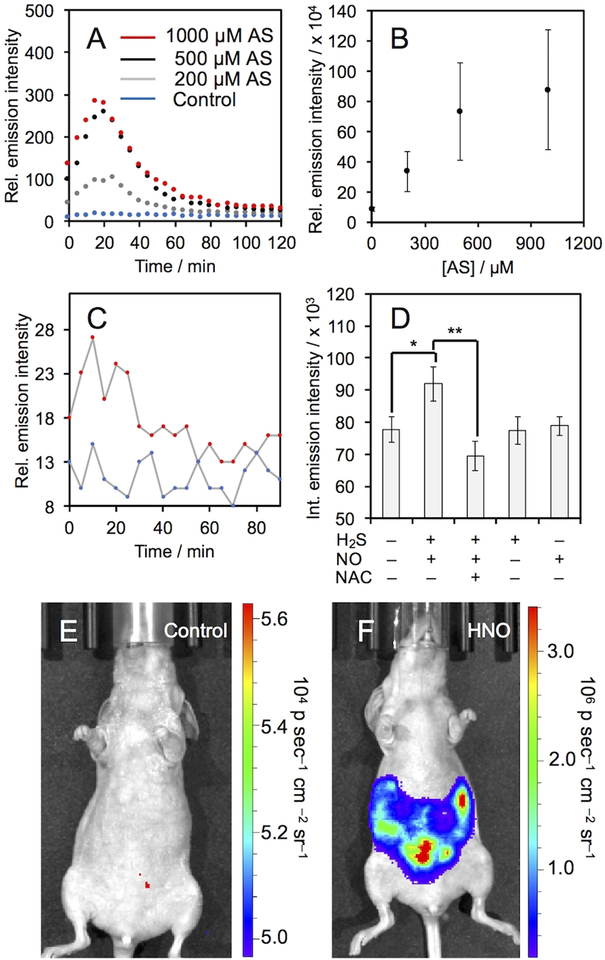
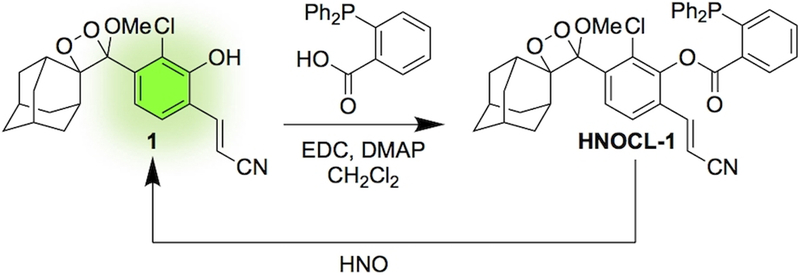
Azanone (HNO) is a reactive nitrogen species with pronounced biological activity and high therapeutic potential for cardiovascular dysfunction. A critical barrier to understanding the biology of HNO and furthering clinical development is the quantification and real-time monitoring of its delivery in living systems. Herein, we describe the design and synthesis of the first chemiluminescent probe for HNO, HNOCL-1, which can detect HNO generated from concentrations of Angeli's salt as low as 138 nm with high selectivity based on the reaction with a phosphine group to form a self-cleavable azaylide intermediate. We have capitalized on this high sensitivity to develop a generalizable kinetics-based approach, which provides real-time quantitative measurements of HNO concentration at the picomolar level. HNOCL-1 can monitor dynamics of HNO delivery in living cells and tissues, demonstrating the versatility of this method for tracking HNO in living systems.

Keywords: bioanalysis; chemiluminescence; nitroxyl; phosphine.


Figures

Figure 1.
Figure 1.
Chemiluminescence response of HNOCL-1 and Angeli’s salt, Na2N2O3 (AS). (A) Chemiluminescence emission spectra at 525 nm of 20 μM HNOCL-1 and 0 (blue trace), 50, 100, 150, and 200 μM (red trace) AS. (B) Time course of chemiluminescence emission of 0 (blue trace), 5, 25, 50, and 100 μM (red trace) AS. (C) Time course of chemiluminescence emission of 10 μM HNOCL-1 and 0 (blue trace) or 200 μM (red trace) AS. (D) Fluorescence emission spectra of 10 μM XF2 after reacting with 0 (blue trace) or 200 μM (red trace) AS for 25 minutes. (E)–(F) Concentration of HNO generated from AS (E) measured from the raw chemiluminescence emission of 20 μM HNOCL-1 or (F) computationally simulated. All experiments were performed in 20 mM HEPES or PBS (pH 7.4), containing ≤1% DMSO. Error bars are ± S.D. from n = 6 replicates.
Figure 2.
Figure 2.
Chemiluminescent responses of 20 μM HNOCL-1 and 200 μM RSON species. Legend: 1. AS, 2. GSH (2 mM), 3. GSNO, 4. H2O2, 5. KO2, 6. Cys (1 mM), 7. Na2S, 8. Na2S2O3, 9. NaNO2, 10. HO, 11. ONOO, 12. tBuOOH, 13. OCl, 14. DEA NONOate, 15. Blank. (B) Time-course of the chemiluminescent emission of 20 μM HNOCL-1 alone (blue trace), with 1 mM DEA NONOate (DN) in PBS (black trace), and with 1 mM DN in HEPES (red trace). (C) Time course of chemiluminescent emission and (D) integrated emission intensity of 20 μM HNOCL-1 alone (blue trace), 200 μM Na2S alone or with 0.2, 0.5, and 1 mM (red trace) DN, and 200 μM Na2S, 1 mM DN, and 2 mM N-acetyl cysteine (NAC). (E) Concentration of HNO produced from 20 μM HNOCL-1 alone (blue trace), and 200 μM Na2S and 0.2, 0.5, and 1 mM (red trace) DN as determined from Eq. (1) and the data shown in (C). All experiments were performed in 20 mM HEPES or PBS (pH 7.4), containing ≤1% DMSO. Error bars are ± S.D. from n = 3–6 replicates.
Figure 3.
Figure 3.
Chemiluminescent measurement of HNO in living cells. (A) Time course of chemiluminescent emission and (B) integrated emission intensity of A549 cells incubated with 20 μM HNOCL-1 for 30 minutes, washed and then treated with AS. Error bars are ±S.D. from n = 9 wells across 3 biological replicates. (C) Time course of chemiluminescence emission of A549 cells incubated with 20 μM HNOCL-1 for 30 minutes, washed and then incubated without (blue trace) or with 1 mM DEA NONOate (DN) and 200 μM Na2S (red trace). (D) Integrated emission intensity of A549 cells incubated with 20 μM HNOCL-1 for 30 minutes, washed and then treated as indicated with H2S as 200 μM Na2S, NO as 1 mM DN, and NAC at 2 mM. Error bars are ±S.E. from n = 6–11 wells and 2–4 biological replicates. Statistical significance was assessed using a two-tailed student’s t-test. **p<0.01, *p<0.05. All cellular experiments were performed at 37 °C. (E)–(F) Images of BALB/c nude mice 2 minutes after IP injection with 40 μM HNOCL-1 and (E) vehicle control or (F) 1 mM Angeli’s salt in 20 mM PBS (pH 7.4) containing 5% DMSO.
Scheme 1.
Scheme 1.
Design and synthesis of the chemiluminescent HNO probe HNOCL-1.

References

    1. Shafirovich V, Lymar SV, Proc. Natl. Acad. Sci. USA 2002, 99, 7340–7345. - PMC - PubMed
    1. Miranda KM, et al., Proc. Natl. Acad. Sci. USA 2003, 100, 9196–9201. - PMC - PubMed
    1. Liochev SI; Fridovich I, Free Radic. Biol. Med 2003, 34, 1399–1404. - PubMed
    1. Smulik R; Debski D, Zielonka J; Michalowski B, Adamus J, Marcinek A, Kalyanaraman B, Sikora A, J. Biol. Chem 2014, 289, 35570–35581. - PMC - PubMed
    1. Smulik-Izydorczyk R, Mesjasz A, Gerbich A, Adamus J, Michalski R, Sikora A, Nitric Oxide 2017, 69, 61–68. - PubMed

Publication types

LinkOut - more resources