. 2018 Nov 23;16(12):465.
doi: 10.3390/md16120465.

Elicited ROS Scavenging Activity, Photoprotective, and Wound-Healing Properties of Collagen-Derived Peptides from the Marine Sponge Chondrosia reniformis

Affiliations

Elicited ROS Scavenging Activity, Photoprotective, and Wound-Healing Properties of Collagen-Derived Peptides from the Marine Sponge Chondrosia reniformis

Marina Pozzolini et al. Mar Drugs. .

Abstract

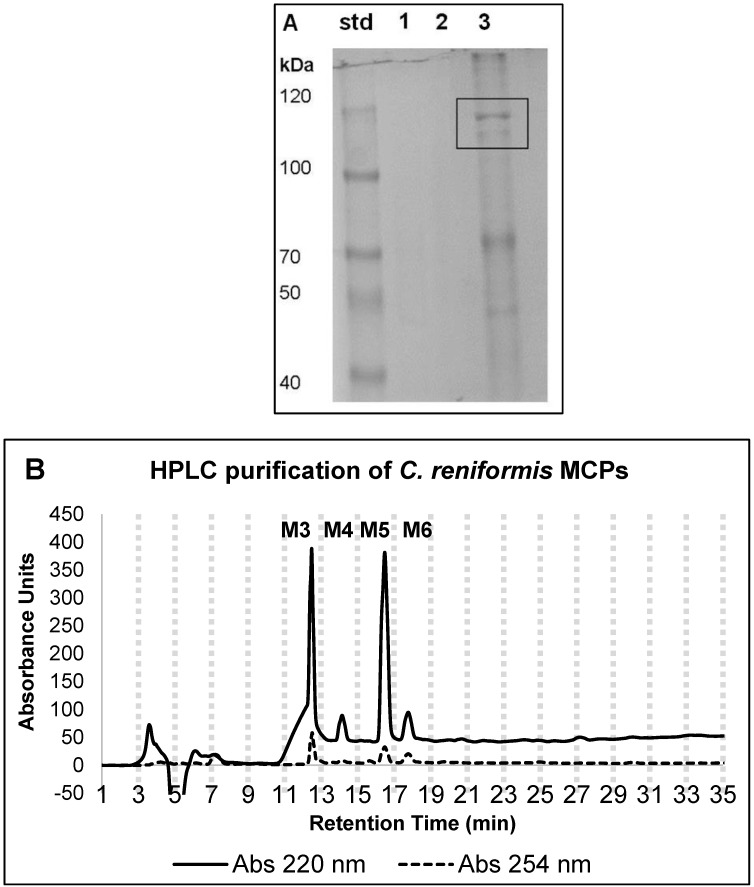
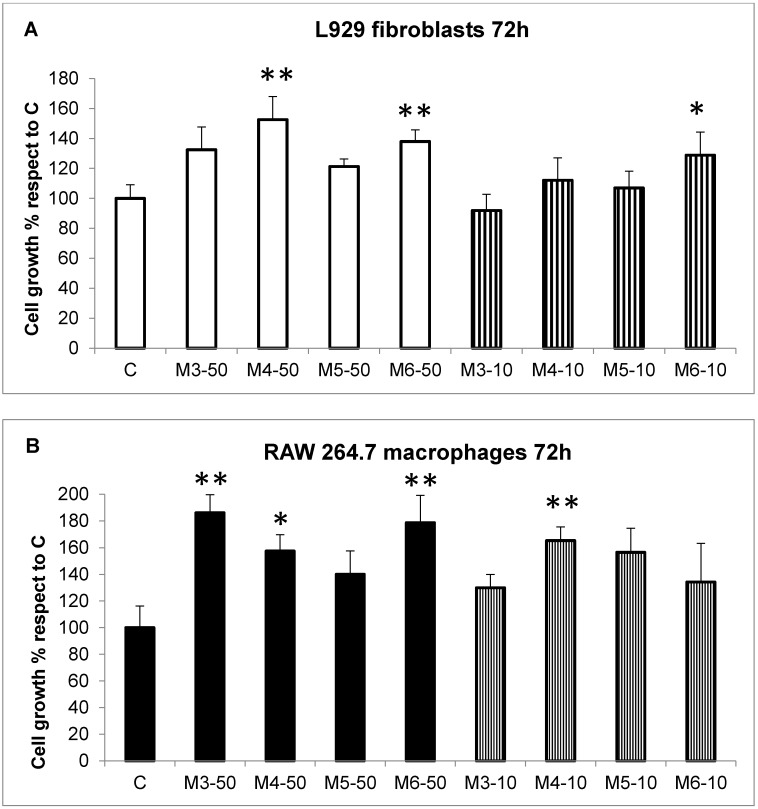
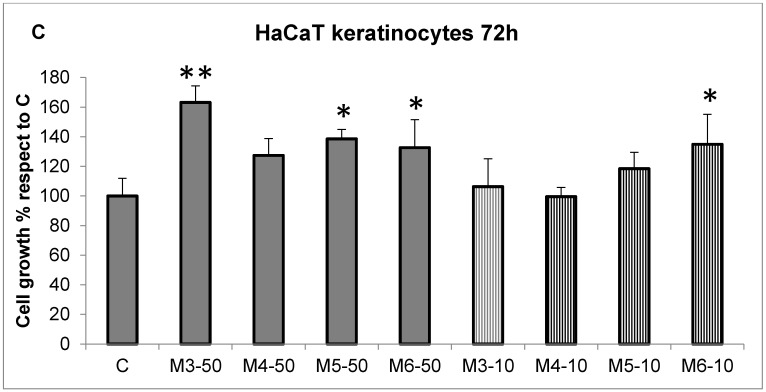
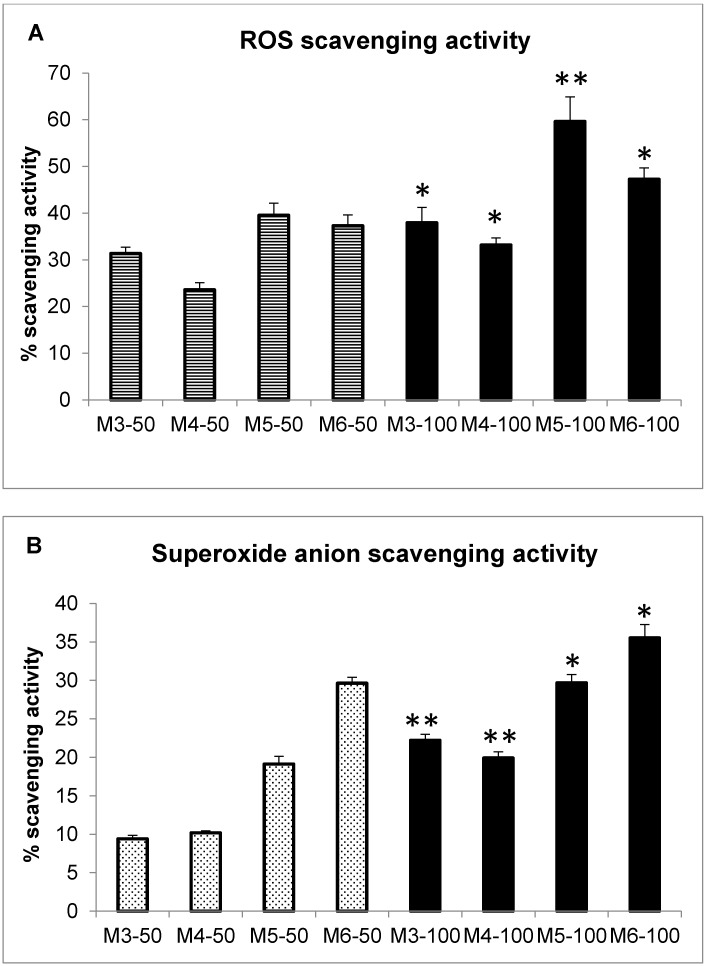
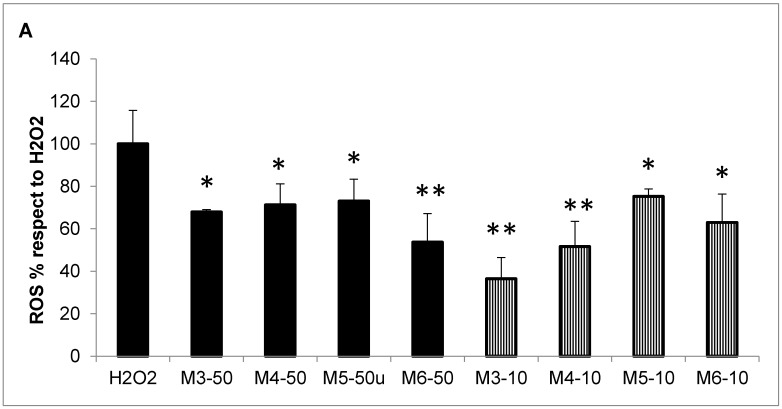
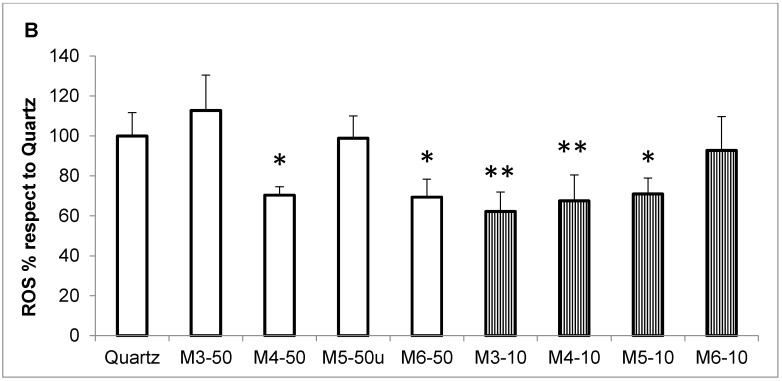
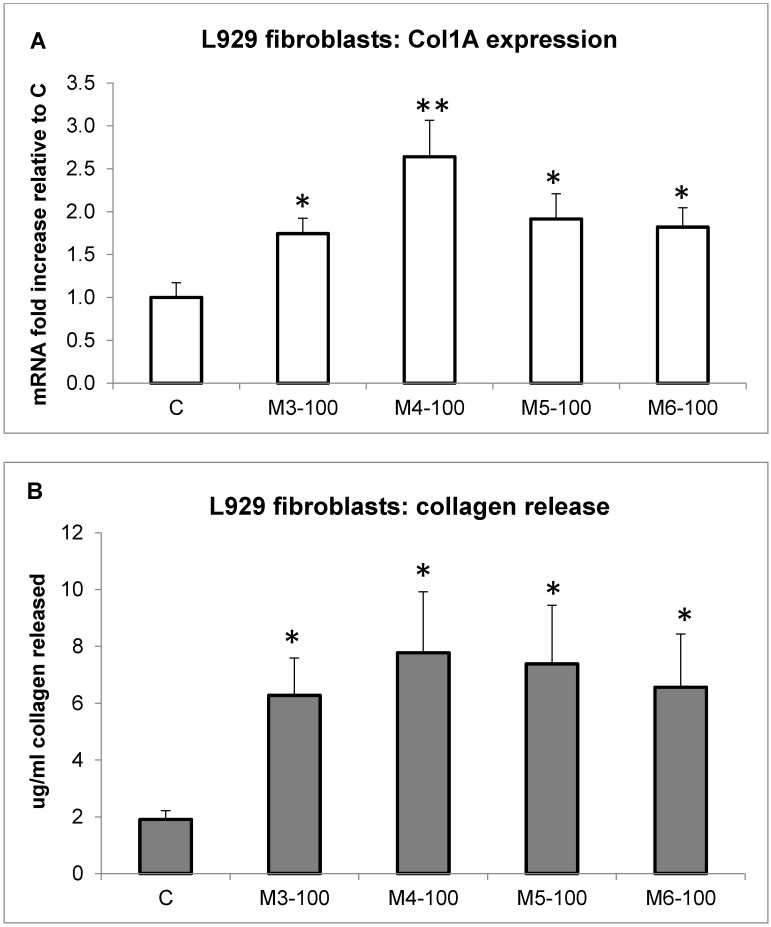
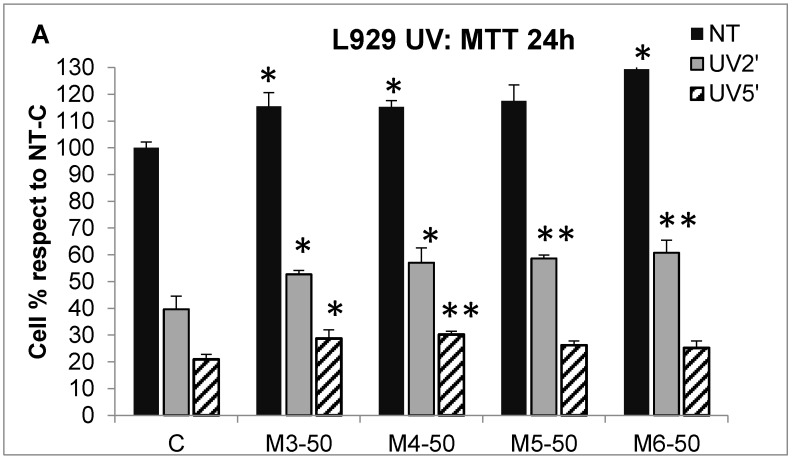
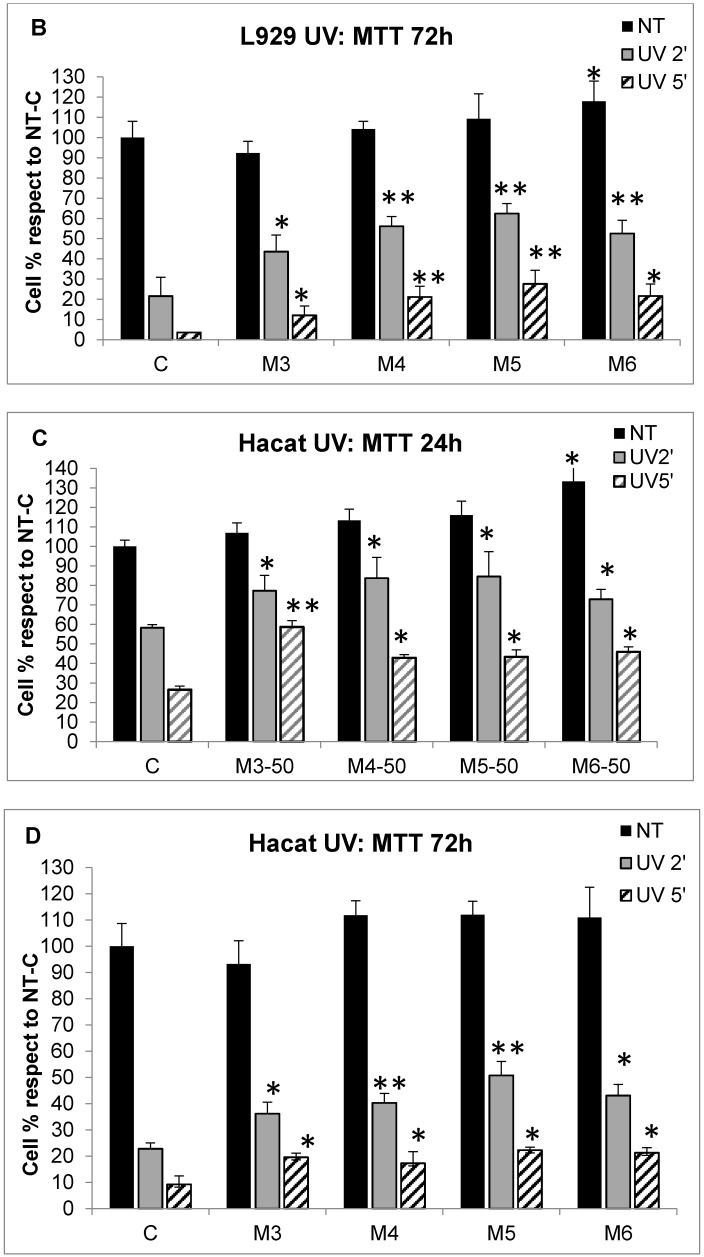
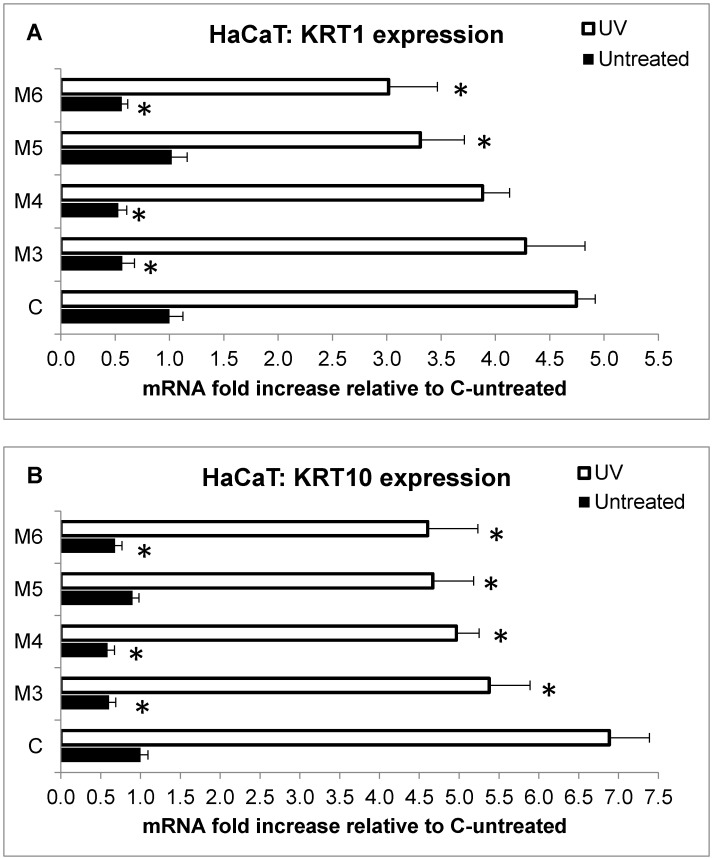
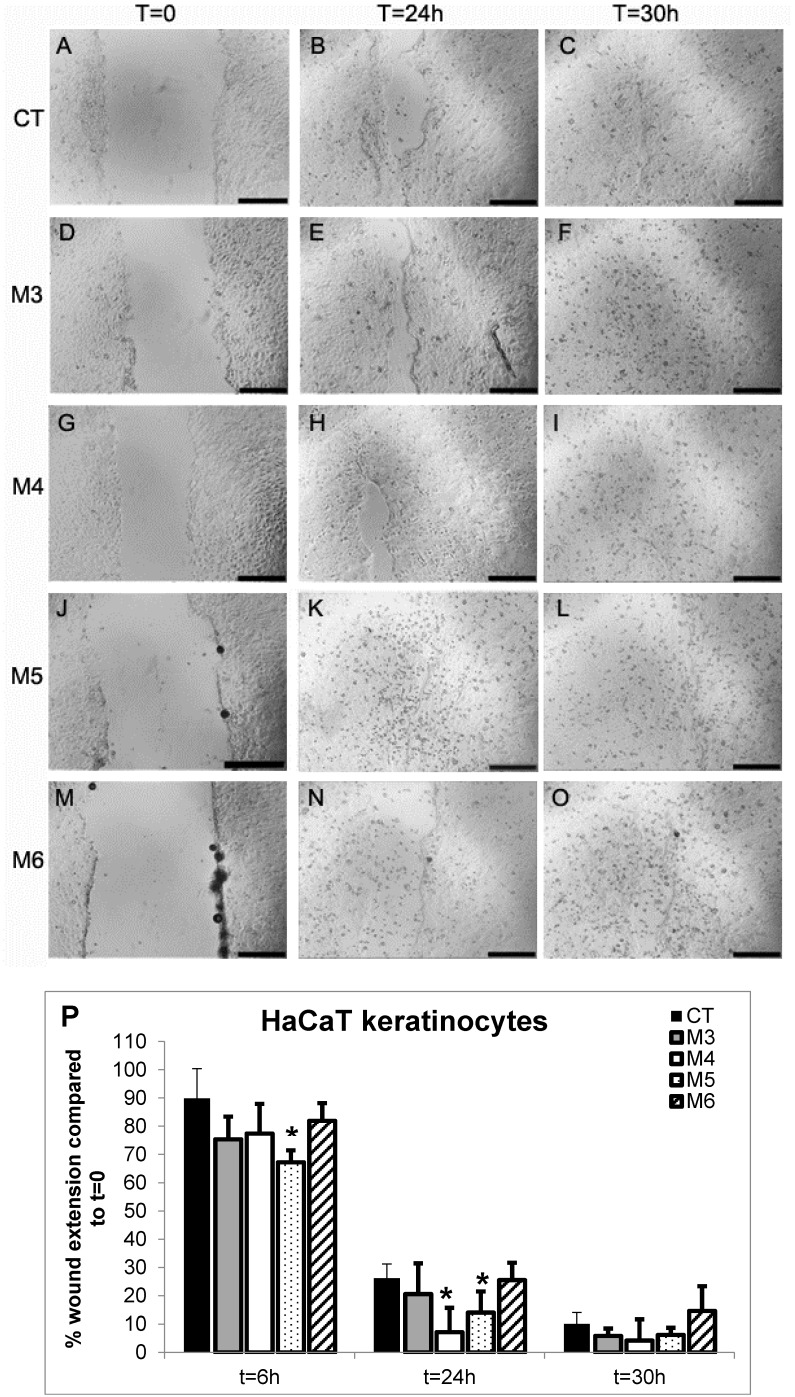
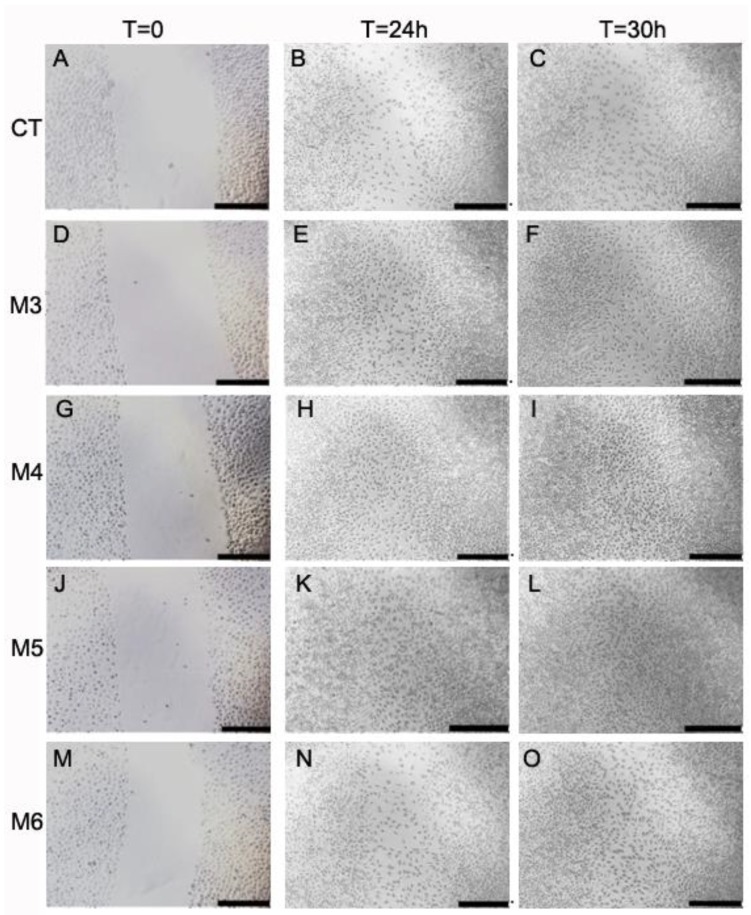
Recently, the bioactive properties of marine collagen and marine collagen hydrolysates have been demonstrated. Although there is some literature assessing the general chemical features and biocompatibility of collagen extracts from marine sponges, no data are available on the biological effects of sponge collagen hydrolysates for biomedical and/or cosmetic purposes. Here, we studied the in vitro toxicity, antioxidant, wound-healing, and photoprotective properties of four HPLC-purified fractions of trypsin-digested collagen extracts-marine collagen hydrolysates (MCHs)-from the marine sponge C. reniformis. The results showed that the four MCHs have no degree of toxicity on the cell lines analyzed; conversely, they were able to stimulate cell growth. They showed a significant antioxidant activity both in cell-free assays as well as in H₂O₂ or quartz-stimulated macrophages, going from 23% to 60% of reactive oxygen species (ROS) scavenging activity for the four MCHs. Finally, an in vitro wound-healing test was performed with fibroblasts and keratinocytes, and the survival of both cells was evaluated after UV radiation. In both experiments, MCHs showed significant results, increasing the proliferation speed and protecting from UV-induced cell death. Overall, these data open the way to the use of C. reniformis MCHs in drug and cosmetic formulations for damaged or photoaged skin repair.

Keywords: antioxidant; collagen hydrolysates; cosmetics; inflammation; marine collagen peptide.


Conflict of interest statement

The authors declare no conflict of interest.

Figures

Figure 1
Figure 1
Characterization and purification of C. reniformis marine collagen hydrolysates (MCHs). (A) SDS-PAGE analysis of undigested and digested sponge collagen. C. reniformis trypsin-digested collagen solutions, two different preparations (lane 1 and 2), and undigested collagen suspension (lane 3) were analyzed on 7.5% SDS polyacrylamide gel and Coomassie blue stained. std = standard molecular weight markers. In lane 3, highlighted in the box, α1-chain and α2-chain of fibrillar collagen. (B) RP-HPLC (reversed phase high-performance liquid chromatography) profile of the C. reniformis trypsin-digested collagen solution in the chromatography used to obtain the MCH fractions. During the purification, fractions were collected every two minutes, as indicated by the vertical dotted grey lines on the chromatogram. The fractions of interest are indicated by the abbreviations M3, M4, M5, and M6, respectively. The analytical conditions are reported in the Materials and Methods (Section 4.4). The continuous line indicates the chromatogram registered at 220 nm, while the dotted line indicates the chromatogram of the same run at 254 nm.
Figure 2
Figure 2
Cell toxicity evaluation. (A) L929 fibroblast cell growth quantitative evaluation, by the cell viability MTT test at 72 h, in the presence or absence of the four different MCHs (M3–M6) at the concentration of 50 g/mL (white bars) and 10 g/mL (striped bars). Results are expressed as cell percentages with respect to controls, and are the mean ± S.D. of three experiments performed in quadruplicate. Asterisks indicate the significance in a paired Tukey test (ANOVA, p < 0.0005; Tukey vs. C: * p < 0.05, ** p < 0.005, respectively). (B) RAW 264.7 macrophages cell growth quantitative evaluation, in the same conditions as (A). Black bars: MCH fractions 50 g/mL, striped bars: MCH fractions 10 g/mL. Results are expressed as cell percentages with respect to controls, and are the mean ± S.D. of three experiments performed in quadruplicate. Asterisks indicate significance in a paired Tukey test (ANOVA, p < 0.005; Tukey vs. C: * p < 0.05, ** p < 0.01, respectively). (C) HaCaT keratinocytes cell growth quantitative evaluation, in the same conditions as (A). Grey bars: MCH fractions 50 g/mL, striped bars: MCH fractions 10 g/mL. Results are expressed as cell percentages with respect to controls, and are the mean ± S.D. of three experiments performed in quadruplicate. Asterisks indicate significance in paired Tukey test (ANOVA, p < 0.00005; Tukey vs. C: * p < 0.05, ** p < 0.0005, respectively).
Figure 2
Figure 2
Cell toxicity evaluation. (A) L929 fibroblast cell growth quantitative evaluation, by the cell viability MTT test at 72 h, in the presence or absence of the four different MCHs (M3–M6) at the concentration of 50 g/mL (white bars) and 10 g/mL (striped bars). Results are expressed as cell percentages with respect to controls, and are the mean ± S.D. of three experiments performed in quadruplicate. Asterisks indicate the significance in a paired Tukey test (ANOVA, p < 0.0005; Tukey vs. C: * p < 0.05, ** p < 0.005, respectively). (B) RAW 264.7 macrophages cell growth quantitative evaluation, in the same conditions as (A). Black bars: MCH fractions 50 g/mL, striped bars: MCH fractions 10 g/mL. Results are expressed as cell percentages with respect to controls, and are the mean ± S.D. of three experiments performed in quadruplicate. Asterisks indicate significance in a paired Tukey test (ANOVA, p < 0.005; Tukey vs. C: * p < 0.05, ** p < 0.01, respectively). (C) HaCaT keratinocytes cell growth quantitative evaluation, in the same conditions as (A). Grey bars: MCH fractions 50 g/mL, striped bars: MCH fractions 10 g/mL. Results are expressed as cell percentages with respect to controls, and are the mean ± S.D. of three experiments performed in quadruplicate. Asterisks indicate significance in paired Tukey test (ANOVA, p < 0.00005; Tukey vs. C: * p < 0.05, ** p < 0.0005, respectively).
Figure 3
Figure 3
Antioxidant activity of C. reniformis MCHs in spectrophotometric tests. (A) MCH reactive oxygen species (ROS) scavenging activity by DPPH assay. Data are the mean ± S.D. of three experiments performed in duplicate, and are expressed as a percentage of antioxidant activity with respect to the absorbance of the negative control (calculated as specified in Methods (Section 4.6)). Striped bars: MCH concentration 50 g/mL; black bars: MCH concentration 100 g/mL. Asterisks indicate significance in a paired Tukey test between the same MCH fraction at 100 g/mL and at 50 g/mL concentration (* p < 0.05, ** p < 0.005, respectively). (B) MCH superoxide scavenging activity by Nitro Blue Tetrazolium (NBT)/riboflavin assay. Data are the mean ± S.D. of three experiments performed in duplicate, and are expressed as a percentage of antioxidant activity with respect to the absorbance of the negative control (calculated as specified in the Methods (Section 4.7)). Dotted bars: MCH concentration 50 g/mL; black bars: MCH concentration 100 g/mL. Asterisks indicate significance in a paired Tukey test between the same MCH fraction at 100 g/mL and at 50 g/mL concentration (* p < 0.05, ** p < 0.005, respectively).
Figure 4
Figure 4
C. reniformis MCH ROS scavenging activity in in vitro assays. (A) Intracellular ROS production measured by H2DCF-dA (2′,7′-dichlorodihydrofluorescein diacetate) fluorimetric analysis in RAW 264.7 murine macrophages incubated for two hours with 200 µM of H2O2 (positive control) in the presence or absence of 50 µg/mL (black bars) or 10 µg/mL (striped bars) of MCH fractions. Results are expressed as percentages of ROS production with respect to the positive control (H2O2), and are the mean ± SD of three experiments performed in quadruplicate. Asterisks indicate significance in Tukey test (ANOVA p < 0.0001; Tukey vs. H2O2, * p < 0.05, ** p < 0.005, respectively). (B) Intracellular ROS production in RAW 264.7 cells incubated for two hours with 100 µg/mL of quartz (positive control) in the presence or absence of 50 µg/mL (white bars) or 10 µg/mL (striped bars) MCH fractions. Results are expressed as percentages of ROS production with respect to the positive control (quartz), and are the mean ± SD of three experiments performed in quadruplicate. Asterisks indicate significance in Tukey test (ANOVA p < 0.005; Tukey vs. quartz, * p < 0.05, ** p < 0.01, respectively).
Figure 4
Figure 4
C. reniformis MCH ROS scavenging activity in in vitro assays. (A) Intracellular ROS production measured by H2DCF-dA (2′,7′-dichlorodihydrofluorescein diacetate) fluorimetric analysis in RAW 264.7 murine macrophages incubated for two hours with 200 µM of H2O2 (positive control) in the presence or absence of 50 µg/mL (black bars) or 10 µg/mL (striped bars) of MCH fractions. Results are expressed as percentages of ROS production with respect to the positive control (H2O2), and are the mean ± SD of three experiments performed in quadruplicate. Asterisks indicate significance in Tukey test (ANOVA p < 0.0001; Tukey vs. H2O2, * p < 0.05, ** p < 0.005, respectively). (B) Intracellular ROS production in RAW 264.7 cells incubated for two hours with 100 µg/mL of quartz (positive control) in the presence or absence of 50 µg/mL (white bars) or 10 µg/mL (striped bars) MCH fractions. Results are expressed as percentages of ROS production with respect to the positive control (quartz), and are the mean ± SD of three experiments performed in quadruplicate. Asterisks indicate significance in Tukey test (ANOVA p < 0.005; Tukey vs. quartz, * p < 0.05, ** p < 0.01, respectively).
Figure 5
Figure 5
MCH-stimulated collagen gene expression and release. (A) L929 fibroblast gene expression measured by qPCR analysis of collagen 1A after 24 h of incubation with 100 µg/mL of the four MCH fractions. Data are normalized on the ubiquitin housekeeping gene, and expressed as an mRNA fold increase compared to control cells. Results are the mean ± SD of three experiments performed in triplicate. Asterisks indicate significance in Tukey test (ANOVA p < 0.0001, Tukey vs. C, * p < 0.05, ** p < 0.005, respectively). (B) Colorimetric collagen quantification by Sircol assay in the cell medium of L929 fibroblasts incubated in the same conditions as (A). Results are the mean ± SD of three experiments performed in duplicate. Asterisks indicate significance in Tukey test (ANOVA p < 0.001, Tukey vs. C, * p < 0.05).
Figure 6
Figure 6
MCH cell death rescue after UV radiation. (A) Cell death evaluation by the MTT test at 24 h in L929 fibroblasts after UV radiation for two minutes and five minutes (corresponding to total radiation doses of 90 mJ/cm2 and 227 mJ cm2, respectively) in the presence or absence of 50 µg/mL MCH fractions. Black bars, untreated cells; grey bars, cells irradiated for two minutes; striped bars, cells irradiated for five minutes. Results are expressed as cell percentage compared to control cells (NT-C bar), and are the mean ± SD of three experiments performed in quadruplicate. Asterisks indicate significance in Tukey test (ANOVA p < 0.001, Tukey vs. the respective C, * p < 0.05, ** p < 0.01). (B) L929 in the same conditions as (A) evaluated at 72 h. Asterisks indicate significance in Tukey test (ANOVA p < 0.0001, Tukey vs. the respective C, * p < 0.05, ** p < 0.01). (C) Cell death evaluation by the MTT test at 24 h in HaCaT keratinocytes after UV radiation for two minutes and five minutes in the presence or absence of 50 µg/mL MCH fractions. Black bars, untreated cells; grey bars, cells irradiated for two minutes; striped bars, cells irradiated for five minutes. Results are expressed as cell percentage compared to control cells (NT-C bar), and are the mean ± SD of three experiments performed in quadruplicate. Asterisks indicate significance in Tukey test (ANOVA p < 0.01, Tukey vs. the respective C, * p < 0.05, ** p < 0.01). (D) HaCaT cells in the same conditions as (C) evaluated at 72 h. Asterisks indicate significance in Tukey test (ANOVA p < 0.01, Tukey vs. the respective C, * p < 0.05, ** p < 0.01).
Figure 6
Figure 6
MCH cell death rescue after UV radiation. (A) Cell death evaluation by the MTT test at 24 h in L929 fibroblasts after UV radiation for two minutes and five minutes (corresponding to total radiation doses of 90 mJ/cm2 and 227 mJ cm2, respectively) in the presence or absence of 50 µg/mL MCH fractions. Black bars, untreated cells; grey bars, cells irradiated for two minutes; striped bars, cells irradiated for five minutes. Results are expressed as cell percentage compared to control cells (NT-C bar), and are the mean ± SD of three experiments performed in quadruplicate. Asterisks indicate significance in Tukey test (ANOVA p < 0.001, Tukey vs. the respective C, * p < 0.05, ** p < 0.01). (B) L929 in the same conditions as (A) evaluated at 72 h. Asterisks indicate significance in Tukey test (ANOVA p < 0.0001, Tukey vs. the respective C, * p < 0.05, ** p < 0.01). (C) Cell death evaluation by the MTT test at 24 h in HaCaT keratinocytes after UV radiation for two minutes and five minutes in the presence or absence of 50 µg/mL MCH fractions. Black bars, untreated cells; grey bars, cells irradiated for two minutes; striped bars, cells irradiated for five minutes. Results are expressed as cell percentage compared to control cells (NT-C bar), and are the mean ± SD of three experiments performed in quadruplicate. Asterisks indicate significance in Tukey test (ANOVA p < 0.01, Tukey vs. the respective C, * p < 0.05, ** p < 0.01). (D) HaCaT cells in the same conditions as (C) evaluated at 72 h. Asterisks indicate significance in Tukey test (ANOVA p < 0.01, Tukey vs. the respective C, * p < 0.05, ** p < 0.01).
Figure 7
Figure 7
Gene expression of keratins in UV-radiated HaCaT keratinocytes. (A) Keratin 1 (KRT1) gene expression after 24 h measured by qPCR analysis in HaCaT keratinocytes irradiated (white bars) or not (black bars) by UV for two minutes in the presence or absence of 50 g/mL MCH fractions. Data are normalized on the ubiquitin housekeeping gene and expressed as an mRNA fold increase compared to the control, which was untreated cells (C, black bar), and are the mean ± SD of three experiments performed in triplicate. Asterisks indicate significance in Tukey test (ANOVA p < 0.00001, Tukey vs. the respective C, * p < 0.05). (B) Keratin 10 (KRT10) gene expression in HaCaT keratinocytes in the same conditions as (A). Asterisks indicate significance in Tukey test (ANOVA p < 0.00001, Tukey vs. the respective C, * p < 0.05).
Figure 8
Figure 8
Wound-healing assay in MCH-treated HaCaT keratinocytes. (AO) Microphotographs taken at 0 h, 24 h, and 30 h with a 4× objective of HaCaT keratinocyte monolayers during the wound-healing assay in the presence or absence of 50 µg/mL MCH fractions, in the area of the scratch made at time = 0. A–C control cells, D–F M3-treated cells, G–I M4-treated cells, J–L M5-treated cells, and M–O M6-treated cells. Black bars span 50 µm. (P) Quantitative evaluation of the wound-healing degree of HaCaT cells over time. To determine the degree of wound healing, the closing distance of the scratch was measured two times in each photograph by using the ImageJ program free software (http://imagej.nih.gov/ij/). Data are expressed as percentages of the closing distance of each sample with respect to the same sample at time = 0. Experiments were repeated twice in quadruplicate, and data are the mean ± SD. Asterisks indicate significance in Tukey test (ANOVA p < 0.00001, Tukey vs. the same sample at t = 0, * p < 0.05).
Figure 9
Figure 9
Wound-healing assay in MCH-treated L929 fibroblasts. (AO) Microphotographs taken at 0 h, 24 h, and 30 h with a 4× objective of L929 fibroblast monolayers during the wound-healing assay in the presence or absence of 50 µg/mL MCH fractions, in the area of the scratch made at time = 0. A–C control cells, D–F M3-treated cells, G–I M4-treated cells, J–L M5-treated cells, and M–O M6-treated cells. Black bars span 50 µm.

Similar articles

Cited by

References

    1. Meena C., Mengi S., Deshpande S. Biomedical and industrial applications of collagen. J. Chem. Sci. 1999;111:319–329.
    1. Nur Hanani Z.A., Roos Y.H., Kerry J.P. Use and application of gelatin as potential biodegradable packaging materials for food products. Int. J. Biol. Macromol. 2014;71:94–102. doi: 10.1016/j.ijbiomac.2014.04.027. - DOI - PubMed
    1. Silva T., Moreira-Silva J., Marques A., Domingues A., Bayon Y., Reis R. Marine origin collagens and its potential applications. Mar. Drugs. 2014;12:5881–5901. doi: 10.3390/md12125881. - DOI - PMC - PubMed
    1. Pati F., Adhikar B., Dhara S. Isolation and characterization of fish scale collagen of higher thermal stability. Bioresour. Technol. 2010;101:3737–3742. doi: 10.1016/j.biortech.2009.12.133. - DOI - PubMed
    1. Jridi M., Bardaa S., Moalla D., Rebaii T., Souissi N., Sahnoun Z., Nasri M. Microstructure, rheological and wound healing properties of collagen-based gel from cuttlefish skin. Int. J. Biol. Macromol. 2015;77:369–374. doi: 10.1016/j.ijbiomac.2015.03.020. - DOI - PubMed

MeSH terms