. 2018 Nov 23;19(12):3731.
doi: 10.3390/ijms19123731.

Vascular Plant One-Zinc-Finger (VOZ) Transcription Factors Are Positive Regulators of Salt Tolerance in Arabidopsis

Affiliations

Vascular Plant One-Zinc-Finger (VOZ) Transcription Factors Are Positive Regulators of Salt Tolerance in Arabidopsis

Kasavajhala V S K Prasad et al. Int J Mol Sci. .

Abstract

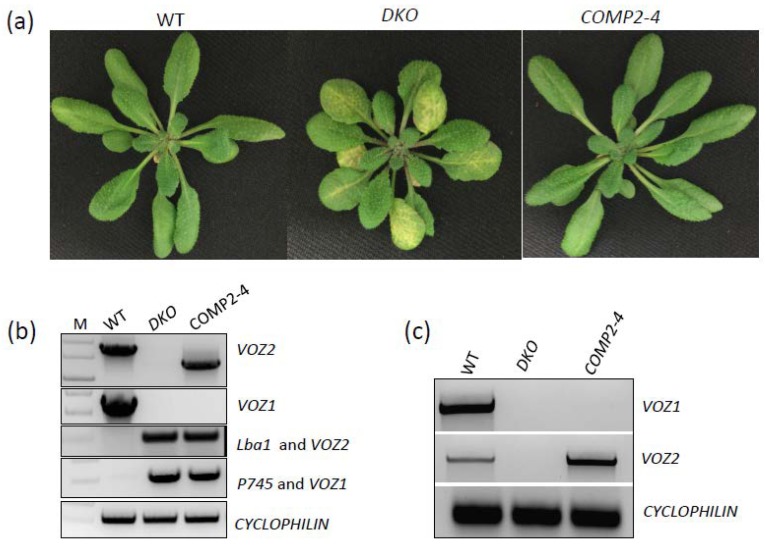
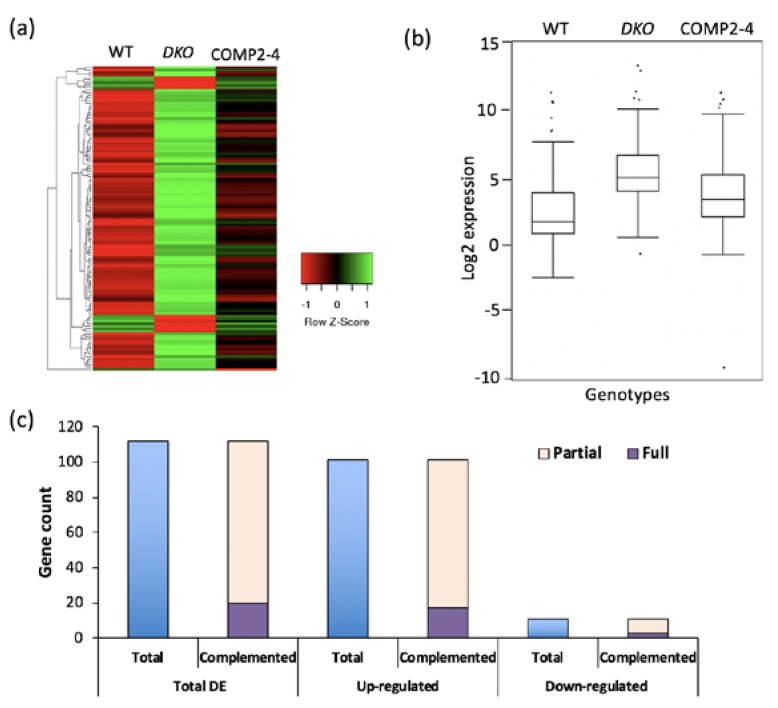
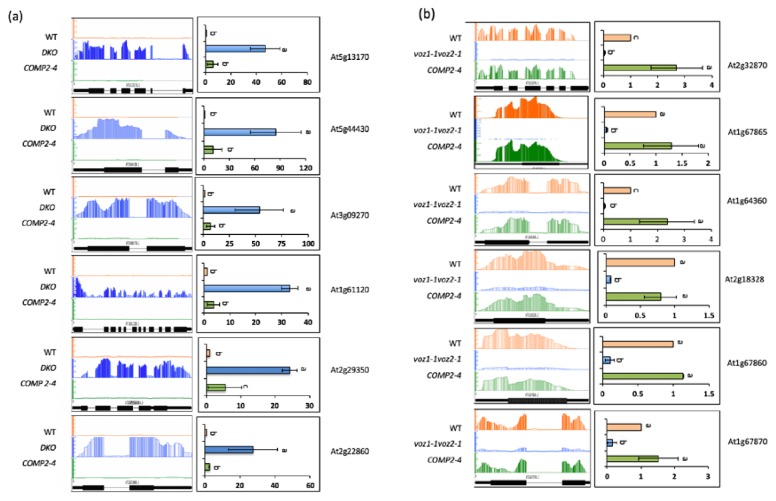
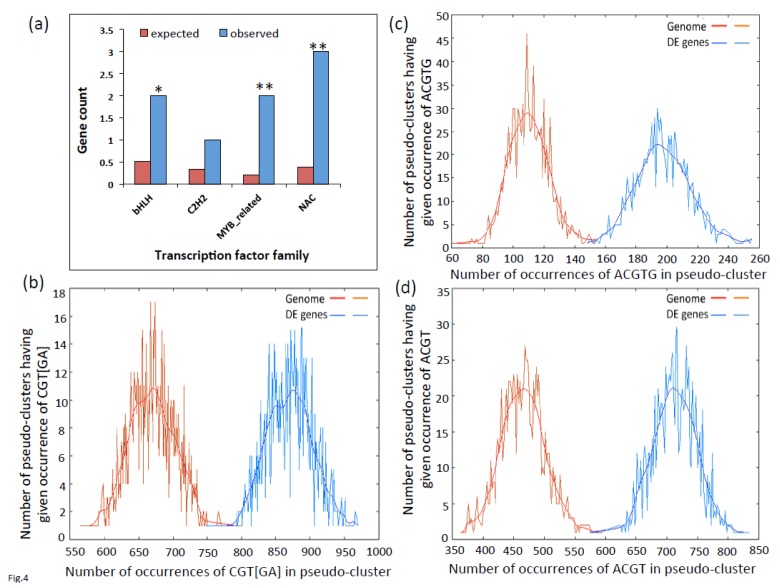
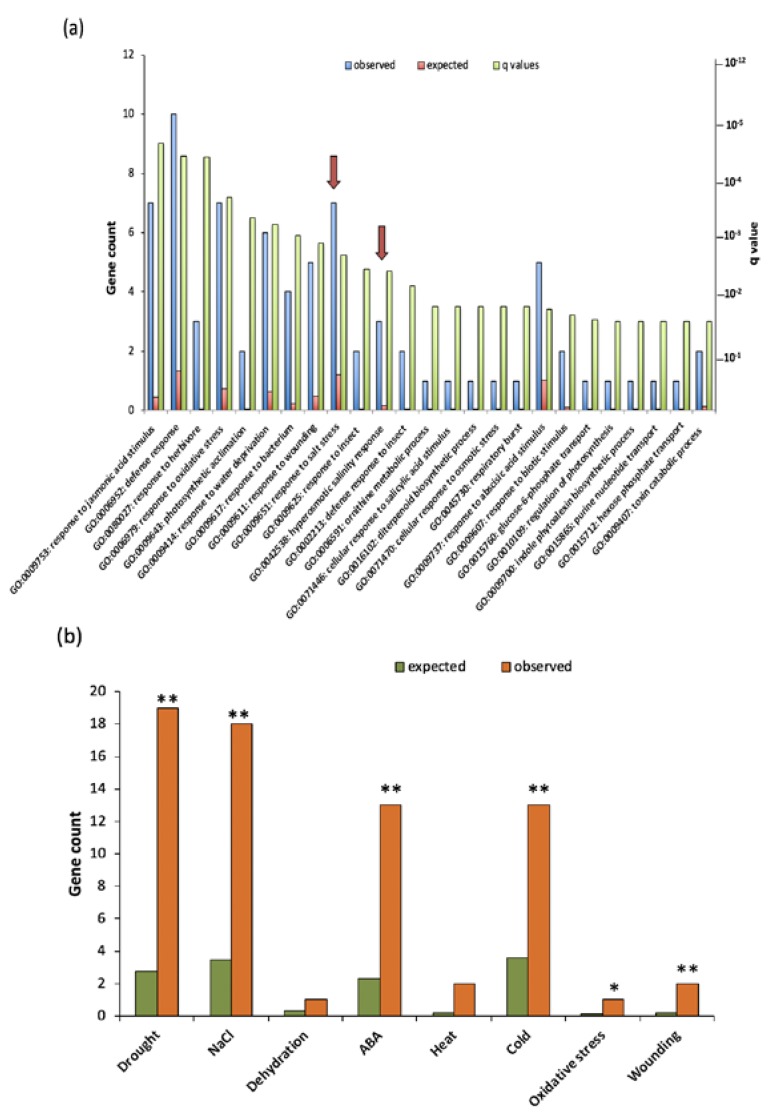
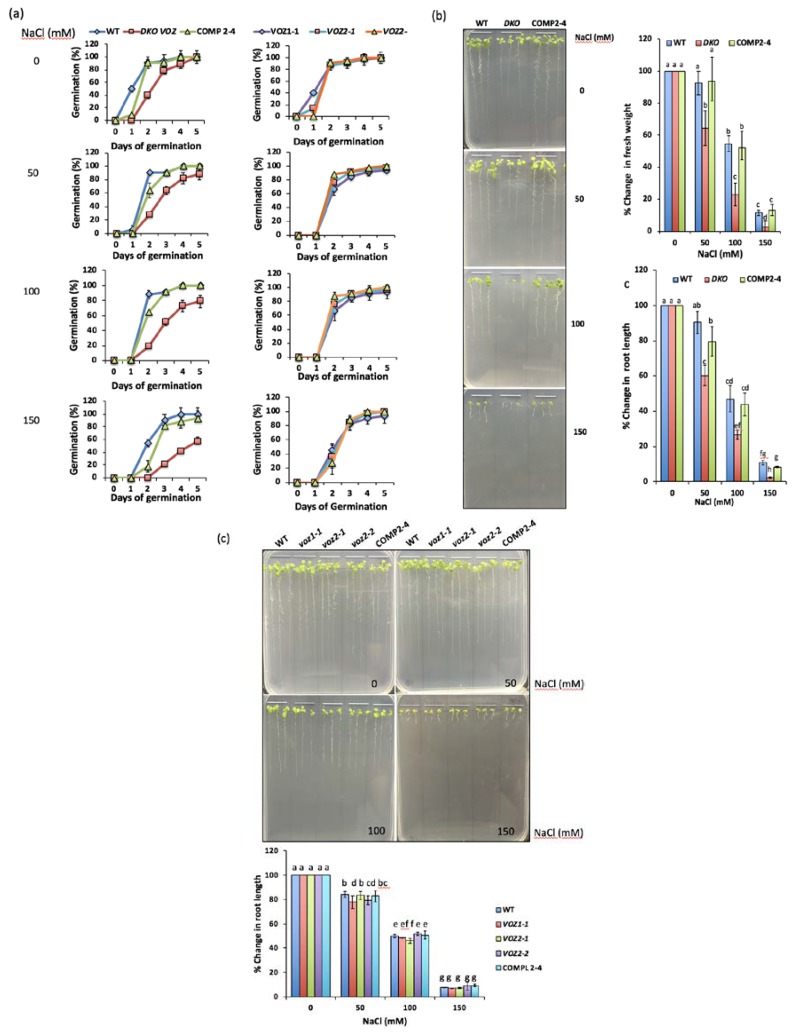
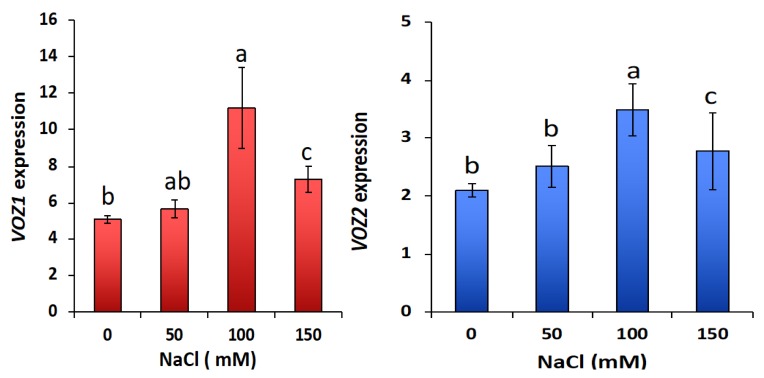
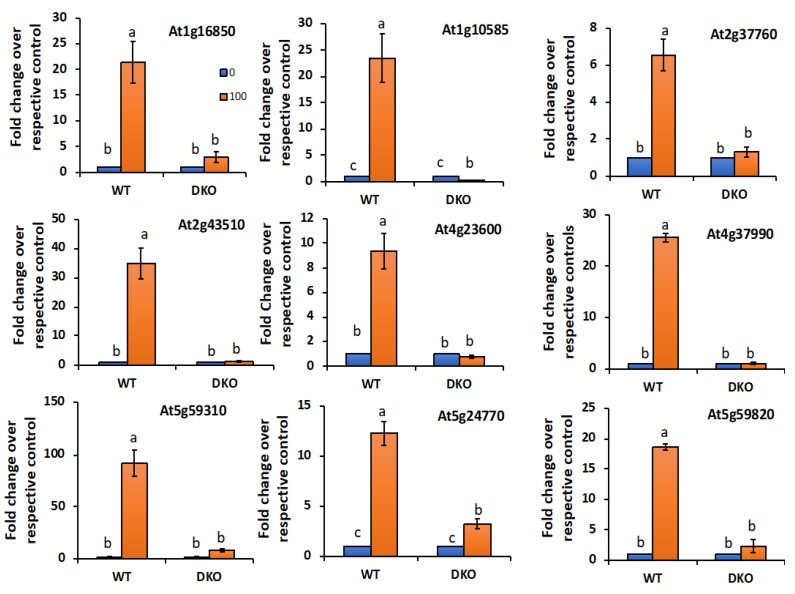
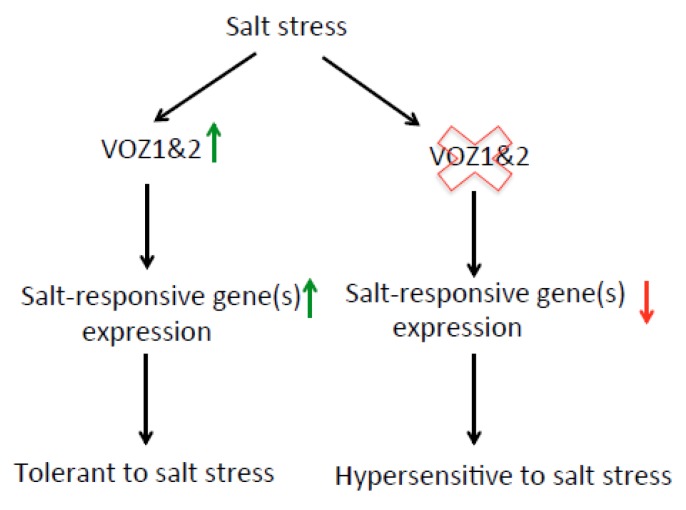
Soil salinity, a significant problem in agriculture, severely limits the productivity of crop plants. Plants respond to and cope with salt stress by reprogramming gene expression via multiple signaling pathways that converge on transcription factors. To develop strategies to generate salt-tolerant crops, it is necessary to identify transcription factors that modulate salt stress responses in plants. In this study, we investigated the role of VOZ (VASCULAR PLANT ONE-ZINC FINGER PROTEIN) transcription factors (VOZs) in salt stress response. Transcriptome analysis in WT (wild-type), voz1-1, voz2-1 double mutant and a VOZ2 complemented line revealed that many stress-responsive genes are regulated by VOZs. Enrichment analysis for gene ontology terms in misregulated genes in voz double mutant confirmed previously identified roles of VOZs and suggested a new role for them in salt stress. To confirm VOZs role in salt stress, we analyzed seed germination and seedling growth of WT, voz1, voz2-1, voz2-2 single mutants, voz1-1 voz2-1 double mutant and a complemented line under different concentrations of NaCl. Only the double mutant exhibited hypersensitivity to salt stress as compared to WT, single mutants, and a complemented line. Expression analysis showed that hypersensitivity of the double mutant was accompanied by reduced expression of salt-inducible genes. These results suggest that VOZ transcription factors act as positive regulators of several salt-responsive genes and that the two VOZs are functionally redundant in salt stress.

Keywords: Arabidopsis thaliana; VOZ; salt stress; transcription factor; transcriptional activator.


Conflict of interest statement

The authors declare no conflicts interests. The founding sponsors had no role in the design of the study, in the collection, analysis or interpretation of the data, in writing of the manuscript, and in the decision to publish the results.

Figures

Figure 1
Figure 1
Validation of genotypes used for RNA-Seq. (a) Top panel: Phenotype of 30-day-old plants of wild-type (WT), double knockout (DKO) mutant (voz1-1 voz2-1) and DKO complemented line (COMP2-4) grown at 21 °C under day neutral conditions at 60% humidity. (b) Genomic PCR of three genotypes used for RNA-Seq. Top panel (PCR with VOZ2-specific primers); second panel (PCR with VOZ1-specific primers); third panel (PCR with T-DNA specific Lba1 and VOZ2-specific reverse primer); fourth panel (PCR with Tn insertion specific primer P745 and VOZ1-specific forward primer); bottom panel (PCR with CYCLOPHILIN-specific primers). In all cases expected size PCR product was obtained. (c) Analysis of expression of VOZ1 (top panel), VOZ2 (middle panel) and CYCLOPHILIN (bottom panel) using sqRT-PCR in 30-day-old seedlings of WT, DKO mutant (voz1-1 voz2-1) and DKO complemented line (COMP2-4).
Figure 2
Figure 2
Analysis of differentially expressed genes. (a) Heatmap representation of differentially expressed genes in WT, DKO and COMP2-4 (COMP) plants. Expression values were used to generate the heatmap using the Heatmapper. Columns represent samples and rows represent genes. Color scale indicates the gene expression level. Green indicates high expression and red Indicates low expression. (b) Box-and-whisker plots showing expression of differentially expressed (DE) genes in different genotypes. (c) Gene counts of total, up and down-regulated DE genes that are either fully or partially complemented in COMP2-4 line.
Figure 3
Figure 3
Validation of up- and down-regulated genes in DKO. (a) RT-qPCR validation of randomly selected up-regulated genes. (b) RT-qPCR of randomly selected down-regulated genes. Left panels in (a,b) show relative sequence read abundance (Integrated Genome Browser view) as histograms in WT, DKO (voz1-1 voz2-1) and COMP2-4 lines. The Y-axis indicates read depth with the same scale for all three lines. The gene structure is shown below the read depth profile. The lines represent introns and the boxes represent exons. The thinner boxes represent 5′ and 3′ UTRs. Right panels in (a,b) show fold change in expression level relative to WT. WT values were considered as 1. Student’s t-test was performed and significant differences (p < 0.05) among samples are labeled with different letters. The error bars represent SD. The genes that were randomly picked include At1g61120 (terpene synthase 4), At1g64360 (enescence-associated and QQS-related), At1g67860 (hypothetical protein), At1g67865 (hypothetical protein), At1g67870 (hypothetical protein), At2g18328 (RAD-like4), At2g22860 (phytosulfokine 2 Precursor), At2g29350 (senescence-associated gene 13), At3g09270 (glutathione S-transferase TAU8), At2g32870 (TRAF-like protein), At5g13170 (senescence-associated gene29), and At5g44430 (plant defensing 1.2C).
Figure 4
Figure 4
Enrichment of transcription factor families and VOZ binding sites in the promoters of DE genes. (a) DE genes are enriched for specific TF families. Observed: Number of genes associated with particular TF family in DE genes. Expected: Number of genes expected in each individual TF family in the genome. Asterisks on the bar represent significant overrepresentation of TFs with a (* p ≤ 0.05) and (** p ≤ 0.0001), respectively. (bd) POBO analysis of NAC consensus sequence (CGT[GA]), G-box core sequence (ACGTG) and LS-7 cis-element (ACGT), respectively, in the −1000 bp upstream of TSS. One thousand pseudoclusters were generated from top 112 DE genes and genome background. The jagged lines show the motif frequencies from which the best-fit curve is derived. CGT[GA], ACGTG and ACGT elements are significantly overrepresented (two-tailed p < 0.0001) in the upstream sequences of DE genes.
Figure 5
Figure 5
VOZ-binding sites in the promoters of up- and down-regulated DE genes. POBO analysis of VOZs binding motif, G-box core sequence (ACGTG) (top panels), NAC consensus sequence (CGT[GA]) (middle panels), and LS-7 cis-element (ACGT) (bottom panels) in the −1000 bp upstream of TSS. A total of 1000 pseudoclusters were generated from 101 up-regulated (left panels) and 11 down-regulated genes (right panels) and genome background. The jagged lines show the motif frequencies from which best-fitted curve is derived. VOZs binding sites are significantly (two-tailed p < 0.0001) over-represented in the upstream sequences of both up- and down-regulated genes.
Figure 6
Figure 6
Gene ontology (GO) enrichment analysis of DE genes. (a) GO term enrichment analysis for biological processes of up-regulated genes. For each GO term, the expected and observed gene numbers along with the statistical significance (p-value) for the enrichment is presented. Observed: Number of DE genes associated with a GO term for biological processes. Expected: Number of genes expected for each GO term in the genome. “Response to salt stress” and “Hyperosmotic salinity response” GO terms are indicated with an arrow. (b) A significant number of DE genes are associated with abiotic stress response in comparison with genome background with a ** p ≤ 0.0001 and * p ≤ 0.05.
Figure 7
Figure 7
Germination and seedling growth of WT, mutants and complemented line in the presence of NaCl. (a) VOZ Double mutant (DKO) exhibits delayed germination under salt stress. The time course of seed germination of WT, DKO, COMP2-4 (left panels), voz1-1, voz2-1 and voz2-2 (right panels) in the presence of 0, 50, 100 and 150 mM NaCl. Each value shown here is mean of three biological replicates with n = 10. The error bars represent SD. (b) VOZ Double mutant (DKO) is hypersensitive to salt stress. Left panel: Growth of seedlings of WT, DKO and COMP2-4 on MS (Murashige and Skoog medium) plates containing different concentrations of NaCl. Seeds were plated on 1/2 strength MS medium supplemented with 0, 50, 100 and 150 mM of NaCl and were allowed to germinate and grow for two weeks. The photographs were taken after two weeks. Right panel, top: Seedling fresh weight. Right panel, bottom: Seedling root length at different concentrations of NaCl was measured for all genotypes and plotted as % relative to growth on normal (0 mM) MS medium. Three biological replicates were used. Eight to ten seedlings for each genotype per treatment for each biological replicate were included. Student’s t-test was performed and significant differences (p ≤ 0.05) among samples are labeled with different letters. The error bars represent SD. (c) Single mutants of VOZs are not hypersensitive to salt stress. Top: Growth of seedlings of WT, COMP2-4, voz1-1, voz2-1 and voz2-2 on MS plates containing different concentrations of salt. Seeds were plated on half-strength MS medium supplemented with 0, 50, 100 or 150 mM of NaCl and were allowed to germinate and grow for two weeks. The photographs were taken after two weeks. Bottom: Seedling root length at different concentrations of NaCl was measured for all genotypes and plotted as % relative to growth on normal (0 mM) MS medium. Three biological replicates were used. For each genotype, eight to ten seedlings per treatment and for each biological replicate were used. Student’s t-test was performed and significant differences (p ≤ 0.05) among samples are labeled with different letters. The error bars represent SD.
Figure 8
Figure 8
Expression of VOZs in response to salt stress. Expression of VOZ1 (top panel) and VOZ2 (bottom panel) in 10-day-old seedlings of WT seedlings grown on 1/2 MS medium supplemented with 0, 50, 100 or 150 mM NaCl was determined by RT-qPCR. The expression of VOZs was normalized with ACTIN2.
Figure 9
Figure 9
VOZs positively regulate the expression of salt-responsive genes. Expression of salt-responsive genes in 10-day-old seedlings of WT and DKO lines on 1/2 MS medium supplemented with 0 or 100 mM NaCl was determined by RT-qPCR. The expression level of salt-responsive genes was normalized with ACTIN2. Fold change in expression level relative to their respective controls (0 mM) is presented. 0 mM values were considered as 1. Three biological replicates were used. Student’s t-test was performed and significant differences (p ≤ 0.05) among samples are labeled with different letters. The error bars represent SD.
Figure 10
Figure 10
A proposed model for the role of VOZs in salt stress response (see text for details). Green and red arrows indicate the increased and decreased expression levels, respectively.

References

    1. Cheeseman J.M. The evolution of halophytes, glycophytes and crops, and its implications for food security under saline conditions. New Phytol. 2015;206:557–570. doi: 10.1111/nph.13217. - DOI - PubMed
    1. Zhu J.K. Abiotic stress signaling and responses in plants. Cell. 2016;167:313–324. doi: 10.1016/j.cell.2016.08.029. - DOI - PMC - PubMed
    1. Reddy A.S., Ali G.S., Celesnik H., Day I.S. Coping with stresses: Roles of calcium- and calcium/calmodulin-regulated gene expression. Plant Cell. 2011;23:2010–2032. doi: 10.1105/tpc.111.084988. - DOI - PMC - PubMed
    1. Ohama N., Sato H., Shinozaki K., Yamaguchi-Shinozaki K. Transcriptional Regulatory Network of Plant Heat Stress Response. Trends Plant Sci. 2017;22:53–65. doi: 10.1016/j.tplants.2016.08.015. - DOI - PubMed
    1. Kim Y.S., An C., Park S., Gilmour S.J., Wang L., Renna L., Brandizzi F., Grumet R., Thomashow M.F. CAMTA-Mediated Regulation of Salicylic Acid Immunity Pathway Genes in Arabidopsis Exposed to Low Temperature and Pathogen Infection. Plant Cell. 2017;29:2465–2477. doi: 10.1105/tpc.16.00865. - DOI - PMC - PubMed

MeSH terms

LinkOut - more resources