

Diagnostic and predictive performance of biomarkers in patients with sepsis in an intensive care unit
- PMID: 30477377
- PMCID: PMC6384460
- DOI: 10.1177/0300060518793791
Diagnostic and predictive performance of biomarkers in patients with sepsis in an intensive care unit
Abstract
Objective: This study was performed to compare the predictive performance of serum procalcitonin (PCT), N-terminal brain natriuretic propeptide (NT-proBNP), interleukin-6 (IL-6), prothrombin time (PT), thrombin time (TT), and Sequential Organ Failure Assessment (SOFA) score in the intensive care unit (ICU).
Methods: This retrospective cohort study enrolled 150 patients with sepsis and septic shock and 30 control patients without sepsis. Each patient was followed until death or 28 days. Correlations between variables were assessed with Spearman's rho test. The Kruskal-Wallis and Mann-Whitney U tests were used for between-group comparisons.
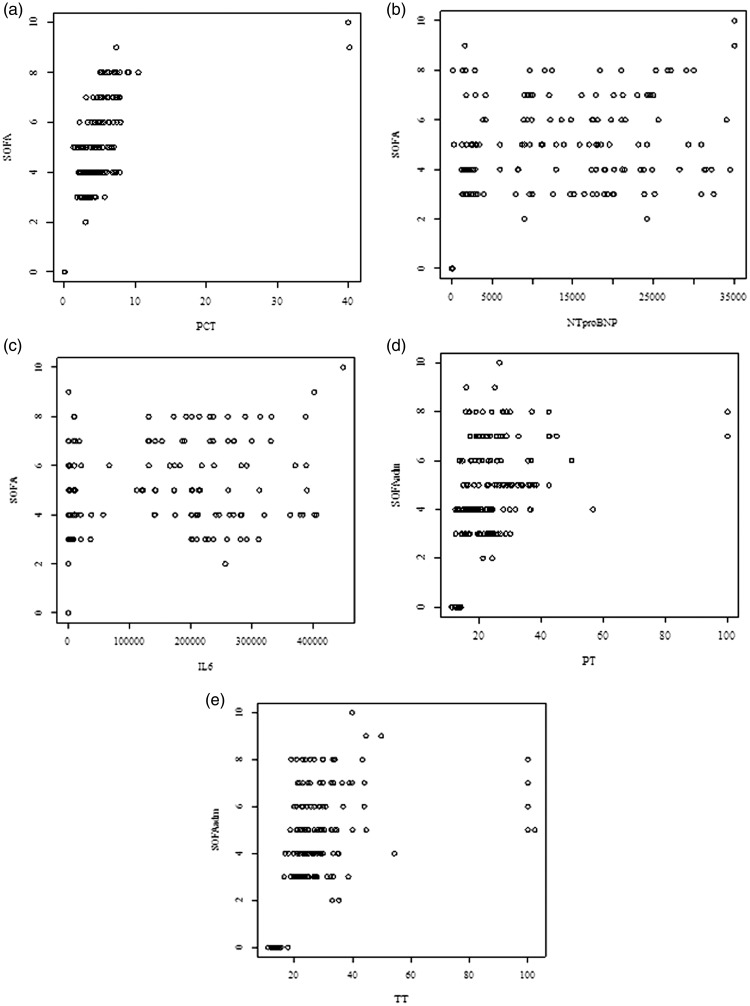
Results: Receiver operating characteristic curve analysis of the SOFA score, PCT, NT-proBNP, IL-6, PT, and TT showed an area under the curve of 0.872, 0.732, 0.711, 0.706, 0.806, and 0.691, respectively, for diagnosing sepsis. Binary logistic regression demonstrated that the SOFA score was an independent predictor of 28-day mortality and septic shock. The correlation coefficient (r) between SOFA and PCT, NT-proBNP and SOFA, IL-6 and SOFA, PT and SOFA, and TT and SOFA was 0.79, 0.52, 0.57, 0.56, and 0.58, respectively.
Conclusion: While the SOFA score is the gold standard, analysis of multiple biomarkers could increase the performance capacity for diagnosis and prognosis in patients with sepsis in the ICU.
Keywords: Interleukin-6; N-terminal brain natriuretic propeptide; Sequential Organ Failure Assessment score; prothrombin time; sepsis; septic shock; thrombin time.
Figures


Similar articles
-
[The predictive value of plasma N-terminal pro-B-type natriuretic peptide levels in the evaluation of prognosis and the severity of patients with septic shock induced myocardial suppression].Zhonghua Wei Zhong Bing Ji Jiu Yi Xue. 2013 Jan;25(1):40-4. doi: 10.3760/cma.j.issn.2095-4352.2013.01.011. Zhonghua Wei Zhong Bing Ji Jiu Yi Xue. 2013. PMID: 23611096 Chinese.
-
[Prediction value of plasma histone in prognosis of sepsis patients].Zhonghua Wei Zhong Bing Ji Jiu Yi Xue. 2019 Jun;31(6):674-679. doi: 10.3760/cma.j.issn.2095-4352.2019.06.003. Zhonghua Wei Zhong Bing Ji Jiu Yi Xue. 2019. PMID: 31315721 Chinese.
-
Procalcitonin and N-Terminal Pro-B-Type Natriuretic Peptide for Prognosis in Septic Acute Kidney Injury Patients Receiving Renal Replacement Therapy.Blood Purif. 2019;48(3):262-271. doi: 10.1159/000501388. Epub 2019 Jul 16. Blood Purif. 2019. PMID: 31311006
-
The utility of brain natriuretic peptides in septic shock as markers for mortality and cardiac dysfunction: A systematic review.Int J Clin Pract. 2019 Jul;73(7):e13374. doi: 10.1111/ijcp.13374. Epub 2019 Jun 17. Int J Clin Pract. 2019. PMID: 31111653
-
The prognostic value of serum procalcitonin measurements in critically injured patients: a systematic review.Crit Care. 2019 Dec 3;23(1):390. doi: 10.1186/s13054-019-2669-1. Crit Care. 2019. PMID: 31796098 Free PMC article.
Cited by
-
The value of neutrophil gelatinase-associated lipocalin and citrullinated alpha enolase peptide-1 antibody in diagnosis, classification, and prognosis for patients with sepsis.Medicine (Baltimore). 2020 Aug 21;99(34):e21893. doi: 10.1097/MD.0000000000021893. Medicine (Baltimore). 2020. PMID: 32846851 Free PMC article.
-
Explainable Artificial Intelligence Helps in Understanding the Effect of Fibronectin on Survival of Sepsis.Cells. 2022 Aug 5;11(15):2433. doi: 10.3390/cells11152433. Cells. 2022. PMID: 35954279 Free PMC article.
-
Prediction of 28-day mortality in patients with sepsis based on a predictive model: A retrospective cohort study.J Int Med Res. 2025 Aug;53(8):3000605251361104. doi: 10.1177/03000605251361104. Epub 2025 Jul 31. J Int Med Res. 2025. PMID: 40744906 Free PMC article.
-
Comprehensive Sepsis Risk Prediction in Leukemia Using a Random Forest Model and Restricted Cubic Spline Analysis.J Inflamm Res. 2025 Jan 22;18:1013-1032. doi: 10.2147/JIR.S505813. eCollection 2025. J Inflamm Res. 2025. PMID: 39867945 Free PMC article.
-
Biomarkers for Point-of-Care Diagnosis of Sepsis.Micromachines (Basel). 2020 Mar 10;11(3):286. doi: 10.3390/mi11030286. Micromachines (Basel). 2020. PMID: 32164268 Free PMC article. Review.
References
-
- Kaukonen KM, Bailey M, Suzuki S, et al. Mortality related to severe sepsis and septic shock among critically ill patients in Australia and New Zealand, 2000-2012. JAMA 2014; 311: 1308–1316. - PubMed
-
- Gaieski DF, Edwards JM, Kallan MJ, et al. Benchmarking the incidence and mortality of severe sepsis in the United States. Crit. Care Med 2013; 41: 1167–1174. - PubMed
MeSH terms
Substances
LinkOut - more resources
Full Text Sources
Research Materials
