. 2018 Nov 26;19(1):453.
doi: 10.1186/s12859-018-2458-x.

COMBImage: a modular parallel processing framework for pairwise drug combination analysis that quantifies temporal changes in label-free video microscopy movies

Affiliations

COMBImage: a modular parallel processing framework for pairwise drug combination analysis that quantifies temporal changes in label-free video microscopy movies

Efthymia Chantzi et al. BMC Bioinformatics. .

Abstract

Background: Large-scale pairwise drug combination analysis has lately gained momentum in drug discovery and development projects, mainly due to the employment of advanced experimental-computational pipelines. This is fortunate as drug combinations are often required for successful treatment of complex diseases. Furthermore, most new drugs cannot totally replace the current standard-of-care medication, but rather have to enter clinical use as add-on treatment. However, there is a clear deficiency of computational tools for label-free and temporal image-based drug combination analysis that go beyond the conventional but relatively uninformative end point measurements.

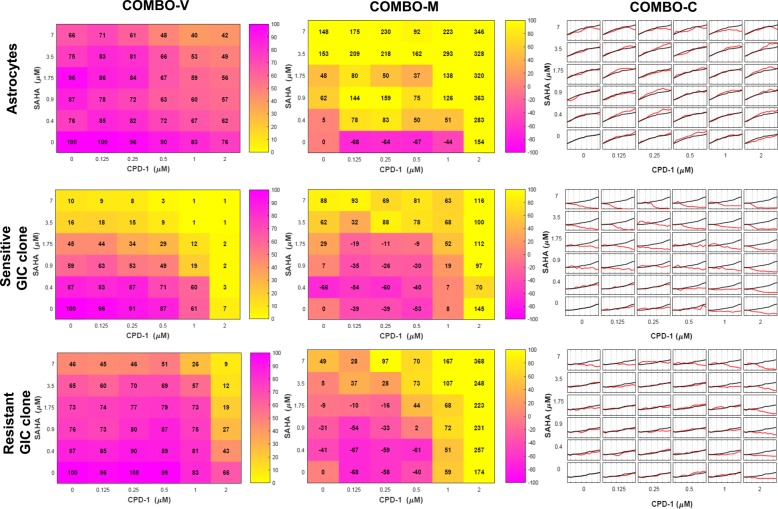
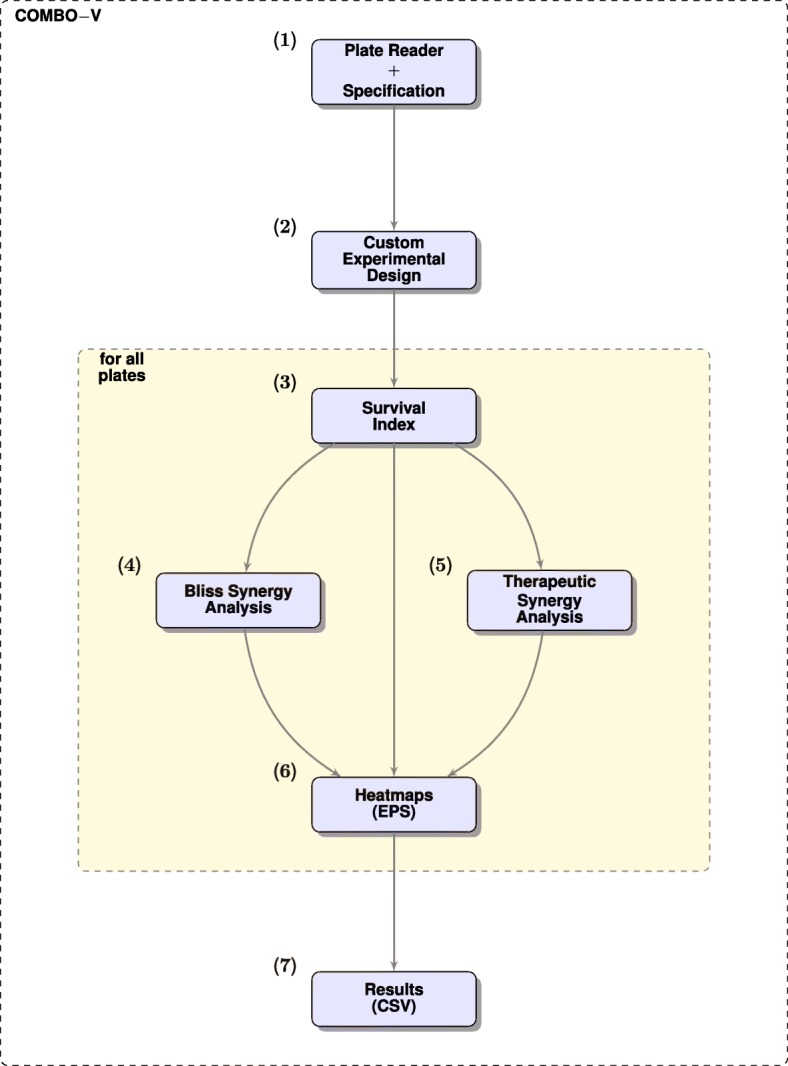
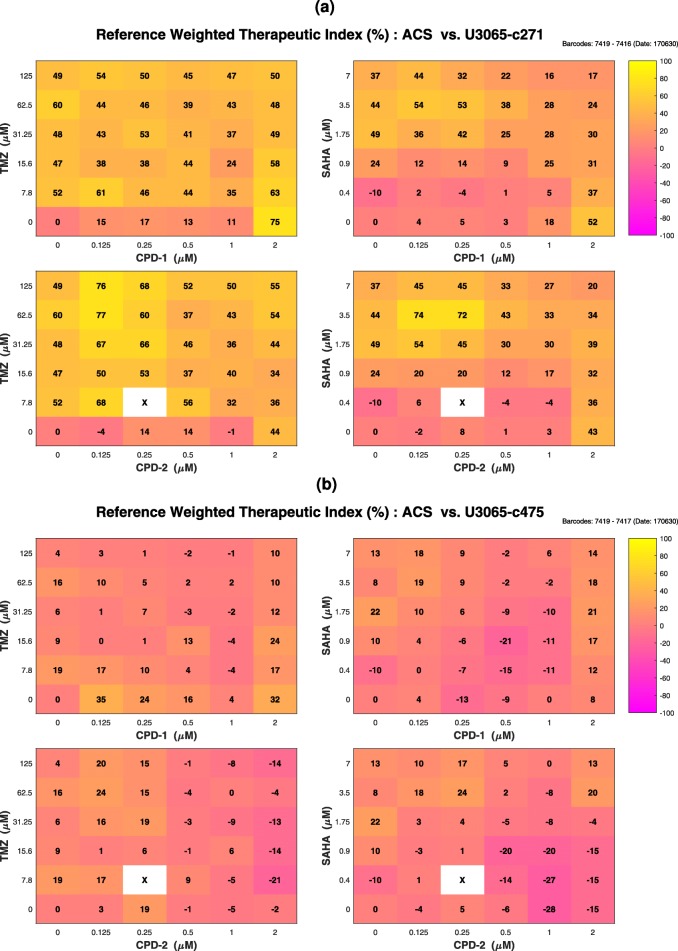
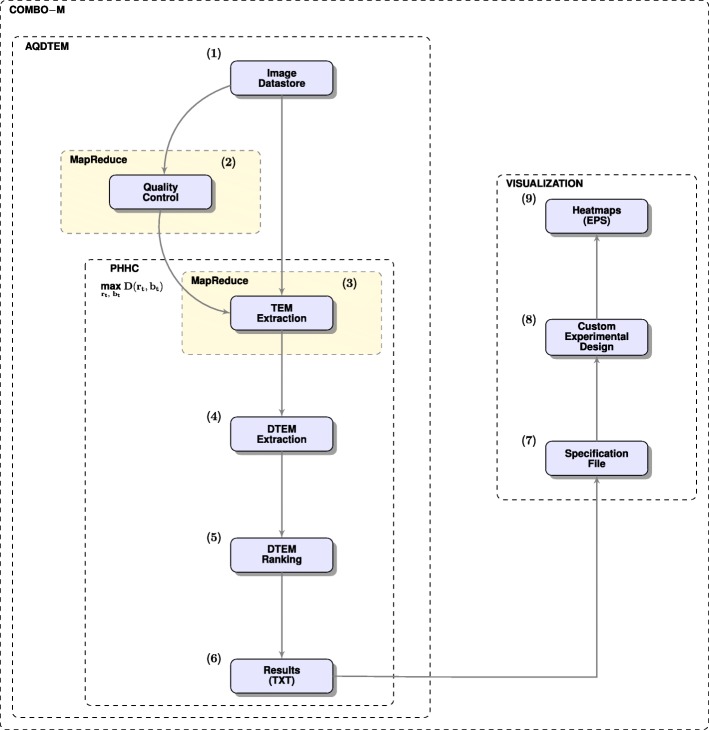
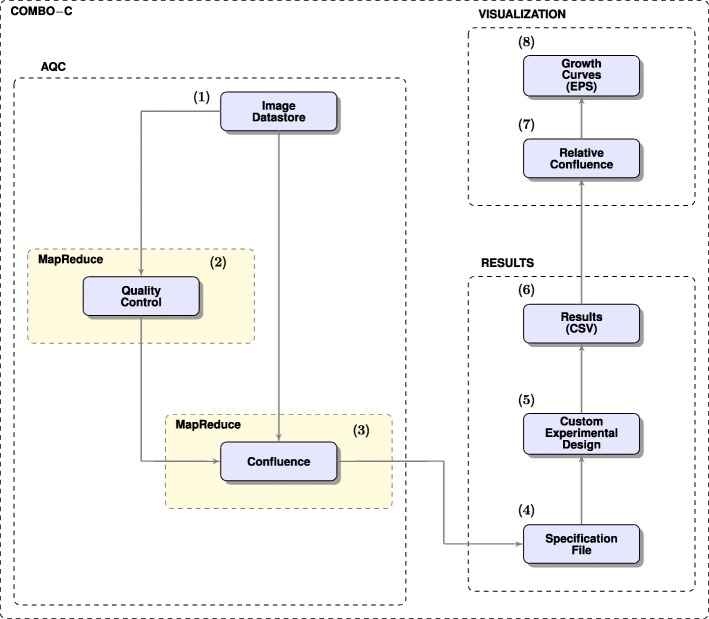
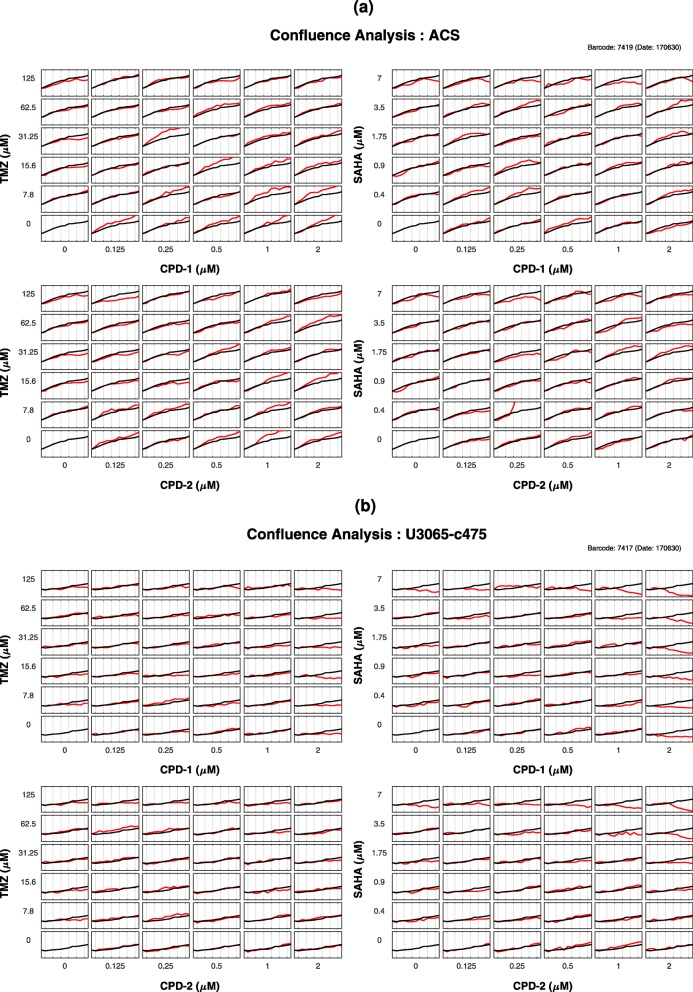
Results: COMBImage is a fast, modular and instrument independent computational framework for in vitro pairwise drug combination analysis that quantifies temporal changes in label-free video microscopy movies. Jointly with automated analyses of temporal changes in cell morphology and confluence, it performs and displays conventional cell viability and synergy end point analyses. The image processing algorithms are parallelized using Google's MapReduce programming model and optimized with respect to method-specific tuning parameters. COMBImage is shown to process time-lapse microscopy movies from 384-well plates within minutes on a single quad core personal computer. This framework was employed in the context of an ongoing drug discovery and development project focused on glioblastoma multiforme; the most deadly form of brain cancer. Interesting add-on effects of two investigational cytotoxic compounds when combined with vorinostat were revealed on recently established clonal cultures of glioma-initiating cells from patient tumor samples. Therapeutic synergies, when normal astrocytes were used as a toxicity cell model, reinforced the pharmacological interest regarding their potential clinical use.

Conclusions: COMBImage enables, for the first time, fast and optimized pairwise drug combination analyses of temporal changes in label-free video microscopy movies. Providing this jointly with conventional cell viability based end point analyses, it could help accelerating and guiding any drug discovery and development project, without use of cell labeling and the need to employ a particular live cell imaging instrument.

Keywords: Drug combination analysis; Glioblastoma multiforme; Label-free; MapReduce; Parallel image processing; Systematic parameter optimization; Therapeutic synergy; Time-lapse video microscopy.


Conflict of interest statement

Ethics approval and consent to participate

Not applicable.

Consent for publication

Not applicable.

Competing interests

The authors declare that they have no competing interests.

Publisher’s Note

Springer Nature remains neutral with regard to jurisdictional claims in published maps and institutional affiliations.

Figures

Fig. 1
Fig. 1
COMBImage Case Study. Selected results in checkerboard style screens produced by COMBO-V, COMBO-M and COMBO-C, for normal astrocytes (first row), sensitive GIC clone (second row) and resistant GIC clone (third row), when SAHA was combined with CPD-1, an investigational cytotoxic compound. The information shown for a particular combination concentration patch is as follows. COMBO-V: cell viability, from purple showing full cell survival (100%) to yellow showing zero cell survival (0%). COMBO-M: relative difference from the top 5% of corresponding natural/untreated morphological effects, from purple being −100% to yellow being 100%. COMBO-C: growth curves of treated (red) and untreated (black) GIC clones. All growth curves are expressed with respect to the first time point
Fig. 2
Fig. 2
COMBO-V Flowchart. (1) Microplate reader and specification files are selected by the user; (2) Deployment of the custom experimental format; (3) FMCA-based cell viability analysis; (4) Conventional and scaled Bliss synergy analysis; (5) Conventional and refined therapeutic synergy analysis, if reference cell model system exists; (6) Global checkerboard style screens as heatmaps in EPS file format; (7) Extraction of results in CSV file format
Fig. 3
Fig. 3
COMBO-V Checkerboard Style Screens. Refined therapeutic synergy analysis: a astrocytes (ACS) vs. sensitive GIC clone (U3065−c271); b astrocytes (ACS) vs. resistant GIC clone (U3065−c475). The color of each combination concentration patch represents the reference weighted therapeutic index, TRW (%), from purple showing maximal therapeutic antagonism (−100%) to yellow showing maximal therapeutic synergy (100%). White patches annotated with “X” are related to survival index values with more than 30% standard deviation between the intra-plate replicates, which have been subsequently excluded
Fig. 4
Fig. 4
COMBO-M Flowchart. (1) Image datastore is selected by the user; (2) Image quality control, back up and foreground segmentation; (3) MapReduce TEM extraction; (4) DTEM extraction; (5) DTEM ranking based on null hypothesis testing; (6) Extraction of raw results in TXT file format; (7) Specification file is selected by the user; (8) Deployment of the custom experimental format; (9) Global checkerboard style screens as heatmaps in EPS file format. Modules (3) - (6) are executed for all parameter pairs (r,b) per decreasing time interval t, starting with all time points and ending up to only the last time point. The optimum pair for each decreasing time interval t, is the one that maximizes the number of detections
Fig. 5
Fig. 5
Image Quality Control. Detected and subsequently excluded outliers from all image processing steps: a astrocytes (ACS); b sensitive GIC clone (U3065−c271); c resistant GIC clone (U3065−c475). Each data point representing a particular experimental well, was detected as an outlier, if its corresponding L1-norm was equal to or greater than the detection threshold shown by the red dotted line
Fig. 6
Fig. 6
Optimized PHHC Analyses. Number of detections (interesting morphological changes compared to untreated controls) using 13 decreasing time intervals for the 4 runs of the currently employed parameter grid: a astrocytes (ACS); b sensitive GIC clone (U3065−c271); c resistant GIC clone (U3065−c475). The values on the x-axis correspond to the first time point for a particular time interval (e.g., 0h indicates the time interval [0h,72h], 6h indicates the time interval [6h,72h], etc.)
Fig. 7
Fig. 7
COMBO-M Checkerboard Style Screens. PHHC analyses: a Astrocytes (ACS) using the optimum parameter pair (r,b)=12,18 for the time interval [60h,72h]; b resistant GIC clone (U3065−c475) using the optimum parameter pair (r,b)=12,12 for the time interval [54h,72h]. The color of each combination concentration patch represents the relative difference (%) from the top 5% of the corresponding natural/untreated morphological effects, from purple being −100% to yellow being 100%
Fig. 8
Fig. 8
Interesting Morphological Detections by COMBO-M. (first column) Astrocytes (ACS) treated with (CPD-1, SAHA) = (2μM, 7μM) for 72h vs. untreated; (second column) resistant GIC clone (U3065−c475) treated with (CPD-1, SAHA) = (2μM, 7μM) for 72h vs. untreated. Red arrows show examples of increased dense formation of intracellular particles, while green arrows illustrate examples of long cellular protrusions
Fig. 9
Fig. 9
COMBO-C Flowchart. (1) Image datastore is selected by the user; (2) Image quality control, back up and foreground segmentation; (3) MapReduce confluence quantification; (4) Specification file is selected by the user; (5) Deployment of the custom experimental format; (6) Extraction of raw confluence values in CSV file format; (7) Quantification of changes in confluence with respect to the first time point; (8) Global checkerboard style screens as growth curves in EPS file format
Fig. 10
Fig. 10
COMBO-C Checkerboard Style Screens. Quantification of changes in confluence: a Astrocytes (ACS); b resistant GIC clone (U3065−c475). The median growth curve of all untreated wells (black) is shown alone in the lower left subplot of each drug pair, as well as together with the growth curves of treated (red) cells. All growth curves are expressed with respect to the first time point

References

    1. Zimmer C, Labruyere E, Meas-Yedid V, Guillen N, Olivo-Marin JC. Segmentation and tracking of migrating cells in videomicroscopy with parametric active contours: a tool for cell-based drug testing. IEEE Trans Med Imaging. 2002;21(10):1212–21. doi: 10.1109/TMI.2002.806292. - DOI - PubMed
    1. Solmesky LJ, Khazanov N, Senderowitz H, Wang P, Minassian BA, Ferreira IM, Yue WW, Lossos A, Weil M, Kakhlon O. A novel image-based high-throughput screening assay discovers therapeutic candidates for adult polyglucosan body disease. Biochem J. 2017;474(20):3403–20. doi: 10.1042/BCJ20170469. - DOI - PMC - PubMed
    1. Singh S, Carpenter AE, Genovesio A. Increasing the Content of High-Content Screening: An Overview. J Biomol Screen. 2014;19(5):640–50. doi: 10.1177/1087057114528537. - DOI - PMC - PubMed
    1. Bougen-Zhukov N, Loh SY, Lee HK, Loo LH. Large-scale image-based screening and profiling of cellular phenotypes. Cytometry A. 2017;91(2):115–25. doi: 10.1002/cyto.a.22909. - DOI - PubMed
    1. Kobayashi H, Lei C, Wu Y, Mao A, Jiang Y, Guo B, Ozeki Y, Goda K. Label-free detection of cellular drug responses by high-throughput bright-field imaging and machine learning. Sci Rep. 2017;7(1):12454. doi: 10.1038/s41598-017-12378-4. - DOI - PMC - PubMed

MeSH terms

LinkOut - more resources