. 2018 Nov 26;6(1):130.
doi: 10.1186/s40478-018-0624-z.

The relevance of cerebrospinal fluid α-synuclein levels to sporadic and familial Alzheimer's disease

Affiliations

The relevance of cerebrospinal fluid α-synuclein levels to sporadic and familial Alzheimer's disease

Daniel Twohig et al. Acta Neuropathol Commun. .

Abstract

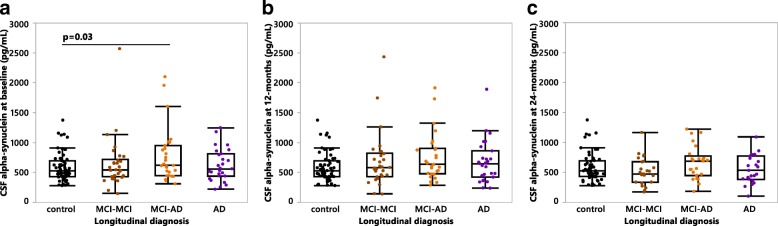
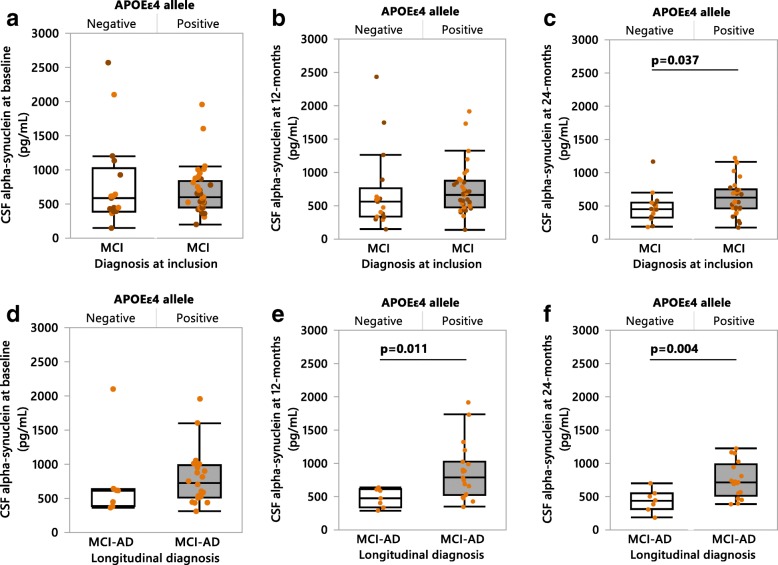
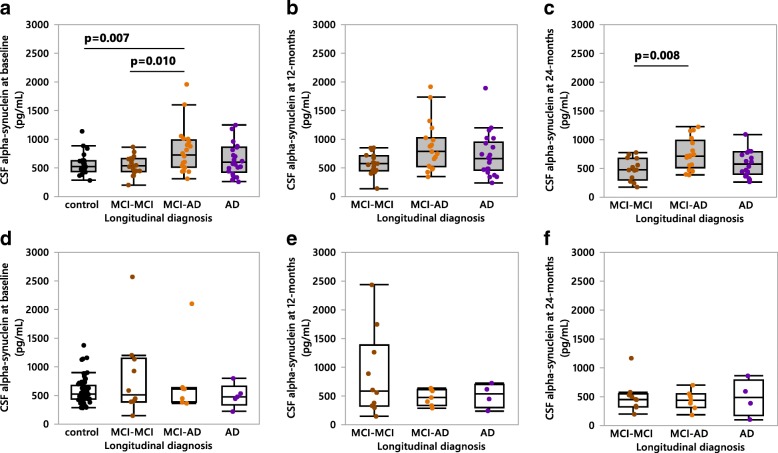
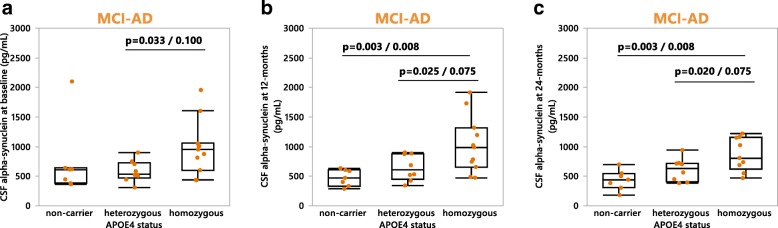
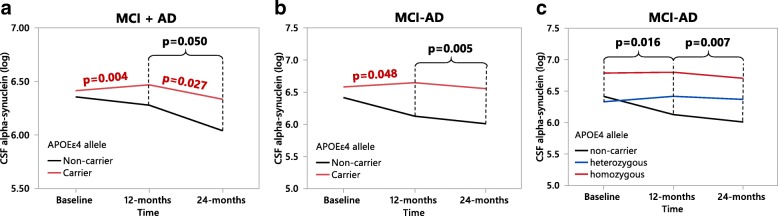
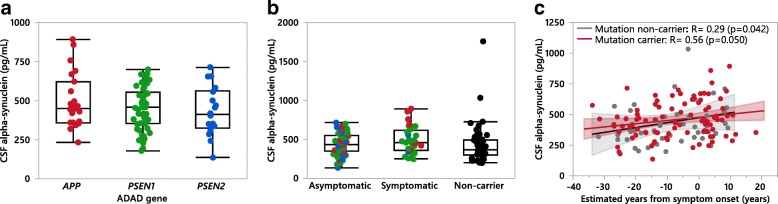
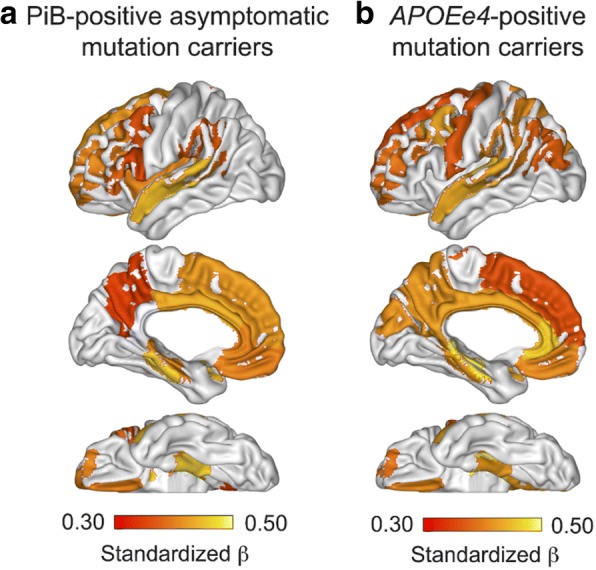
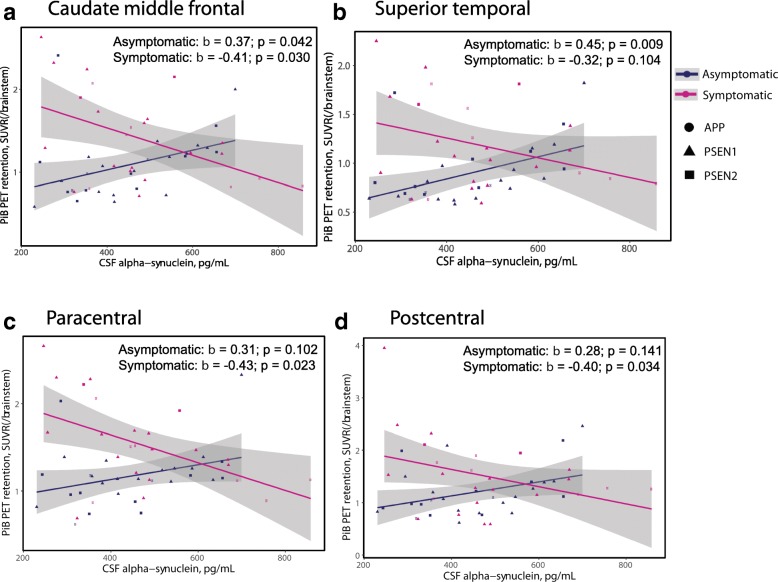
Accumulating evidence demonstrating higher cerebrospinal fluid (CSF) α-synuclein (αSyn) levels and αSyn pathology in the brains of Alzheimer's disease (AD) patients suggests that αSyn is involved in the pathophysiology of AD. To investigate whether αSyn could be related to specific aspects of the pathophysiology present in both sporadic and familial disease, we quantified CSF levels of αSyn and assessed links to various disease parameters in a longitudinally followed cohort (n = 136) including patients with sporadic mild cognitive impairment (MCI) and AD, and in a cross-sectional sample from the Dominantly Inherited Alzheimer's Network (n = 142) including participants carrying autosomal dominant AD (ADAD) gene mutations and their non-mutation carrying family members.Our results show that sporadic MCI patients that developed AD over a period of two years exhibited higher baseline αSyn levels (p = 0.03), which inversely correlated to their Mini-Mental State Examination scores, compared to cognitively normal controls (p = 0.02). In the same patients, there was a dose-dependent positive association between CSF αSyn and the APOEε4 allele. Further, CSF αSyn levels were higher in symptomatic ADAD mutation carriers versus non-mutation carriers (p = 0.03), and positively correlated to the estimated years from symptom onset (p = 0.05) across all mutation carriers. In asymptomatic (Clinical Dementia Rating < 0.5) PET amyloid-positive ADAD mutation carriers CSF αSyn was positively correlated to 11C-Pittsburgh Compound-B (PiB) retention in several brain regions including the posterior cingulate, superior temporal and frontal cortical areas. Importantly, APOEε4-positive ADAD mutation carriers exhibited an association between CSF αSyn levels and mean cortical PiB retention (p = 0.032). In both the sporadic AD and ADAD cohorts we found several associations predominantly between CSF levels of αSyn, tau and amyloid-β1-40.Our results suggest that higher CSF αSyn levels are linked to AD pathophysiology at the early stages of disease development and to the onset of cognitive symptoms in both sporadic and autosomal dominant AD. We conclude that APOEε4 may promote the processes driven by αSyn, which in turn may reflect on molecular mechanisms linked to the asymptomatic build-up of amyloid plaque burden in brain regions involved in the early stages of AD development.

Keywords: APOEε4; Alzheimer’s disease; Biomarkers; Mild cognitive impairment; alpha-synuclein.


Conflict of interest statement

Ethics approval and consent to participate

Research aims pursued in the longitudinal cohort were approved by the regional ethics committee in Trondheim, Norway (2010/226) and Stockholm, Sweden (2016/771–31/4). The described studies relating to the DIAN cohort wereapproved by the local ethics committee in Stockholm, Sweden (2016/2114–31/4). The studies of both cohorts were carried out in agreement with the Helsinki Declaration.

Consent for publication

Not applicable.

Competing interests

The authors declare that they have no competing interests.

Publisher’s Note

Springer Nature remains neutral with regard to jurisdictional claims in published maps and institutional affiliations.

Figures

Fig. 1
Fig. 1
CSF αSyn levels in sporadic MCI and Alzheimer’s disease cohort. Quantification of CSF αSyn levels at (a) baseline, (b) 12-months and (c) 24-months in the four longitudinally diagnosed patient groups: control = cognitively healthy controls, MCI-MCI = MCI patients who remained MCI at the 24-month follow up, MCI-AD = MCI patients who converted to Alzheimer’s disease at the 24-month follow up, AD = patients diagnosed with AD at baseline. P-values were calculated using a one-way ANCOVA of log-transformed data with age entered as a covariate with post-hoc testing by use of the student’s t-test. Bonferroni correction was used to account for multiple comparisons (a: n = 6 comparisons, b-c: n = 3 comparisons). Results are displayed without log-transformation or age-correction (raw data)
Fig. 2
Fig. 2
CSF αSyn measured in APOEε4-positive versus APOEε4-negative sporadic MCI patients. a-c CSF αSyn quantified in MCI patients at baseline, 12- and 24-months respectively. APOEε4-positive patients are shown as grey shaded boxes, APOEε4-negative patients are white boxes. Orange data points represent patients longitudinally diagnosed as MCI-AD, brown points represent MCI-MCI patients. d-f CSF αSyn quantified in MCI-AD diagnosed patients at baseline, 12- and 24-months respectively. P-values were calculated using the one-way ANCOVA of log-transformed data, with age entered as a covariate with post-hoc testing by use of the student’s t-test. Results are displayed without log-transformation or age-correction (raw data). MCI-AD = MCI patients who converted to Alzheimer’s disease at the 24-month follow up
Fig. 3
Fig. 3
CSF αSyn measured in the subjects of the longitudinal cohort based on APOEε4 status. a-c APOEε4-positive (grey boxes) subjects examined at baseline, 12- and 24-months respectively. d-f APOEε4-negative patients examined at baseline, 12- and 24-months respectively. P-values were calculated using the one-way ANCOVA of log-transformed data, with age entered as a covariate with post-hoc testing by use of the student’s t-test. Bonferroni correction was used to account for multiple comparisons (a: n = 6 comparisons, b-f: n = 3 comparisons). Results are displayed without log-transformation or age-correction (raw data). MCI-MCI = MCI patients who remained MCI at the 24-month follow up, MCI-AD = MCI patients who converted to Alzheimer’s disease at the 24-month follow up, AD = patients diagnosed with Alzheimer’s disease at baseline
Fig. 4
Fig. 4
Cerebrospinal fluid αSyn levels in MCI-AD patients at: a baseline (non-carrier n = 7, heterozygous n = 9, homozygous n = 11), b 12-months (non-carrier n = 7, heterozygous n = 8, homozygous n = 11), and c 24-months (non-carrier n = 7, heterozygous n = 8, homozygous n = 9). P-values are presented first as uncorrected followed by Bonferroni corrected (a-c: n = 3 comparisons). In a P-values were calculated using the non-parametric Kruskal-Wallis with post-hoc testing by use of the Mann-Whitney U test. Bonferroni correction was used to account for multiple comparisons. In (b-c) P-values were calculated using the one-way ANCOVA with age entered as a covariate with post-hoc testing by use of the student’s t-test. Results are displayed without age-correction (raw data). MCI-AD = MCI patients who converted to Alzheimer’s disease at the 24-month follow up
Fig. 5
Fig. 5
Longitudinal assessment of mean CSF αSyn values at baseline, 12-months and 24-months in (a) a pooled MCI and Alzheimer’s disease (AD) patient group classified as either APOEε4 carriers (baseline to 12-months n = 58, 12-months to 24-months n = 47) or non-carriers (baseline to 12-months n = 21, 12-months to 24-months n = 19). b the MCI-AD patient group classified as either APOEε4 carriers (baseline to 12-months n = 19, 12-months to 24-months n = 16) or non-carriers (baseline to 12-months n = 7, 12-months to 24-months n = 7), c the MCI-AD patient group classified as either APOEε4 non-carriers (baseline to 12-months n = 7, 12-months to 24-months n = 7), heterozygotes (baseline to 12-months n = 8, 12-months to 24-months n = 7) or homozygotes (baseline to 12-months n = 11, 12-months to 24-months n = 9). P-values within patient groups over 1-year intervals are shown in red along the trend lines, and between-group p-values are indicated in black. P-values were calculated using repeated measures MANOVA analysis of log-transformed data. MCI-AD = MCI patients who converted to Alzheimer’s disease at the 24-month follow up
Fig. 6
Fig. 6
Receiver operator characteristic (ROC) curves of AD CSF biomarkers. For each CSF biomarker analyte or ratio the table indicates the cutoff value, sensitivity (%), specificity (%), and area under the ROC curve (AUC) with the corresponding 95% confidence interval. A clinical diagnosis of healthy control versus AD was used as the dichotomous variable to define CSF cutoffs based on the best performing Youden index
Fig. 7
Fig. 7
Baseline levels of CSF αSyn in the longitudinal cohort based on ROC cutoff values. a-f Clinically diagnosed subjects subdivided into either CSF Alzheimer’s disease (AD) biomarker negative (CSF(−)) or positive (CSF(+)) groups based on cutoff values. P-values were calculated using the one-way ANCOVA of log-transformed data, with age entered as a covariate with post-hoc testing by use of the student’s t-test. Results are displayed without log-transformation
Fig. 8
Fig. 8
CSF αSyn levels quantified in participants from the DIAN cohort. a CSF αSyn levels grouped by ADAD gene mutation. b CSF αSyn in ADAD non-mutation carriers versus asymptomatic and symptomatic ADAD mutation carriers. Data point coloring represents the three ADAD genes as shown in (a). P-values are presented first as uncorrected followed by Bonferroni corrected (a-b: n = 3 comparisons). P-values calculated using the non-parametric Kruskal-Wallis test and a Bonferroni correction was used to account for multiple comparisons. c Correlation between CSF αSyn and the estimated years from symptom onset (EYO) in ADAD mutation carriers and non-mutation carriers; correlations are calculated using Pearson’s correlation test after log-transformation of the CSF αSyn data and results are displayed without log-transformation or age-correction (raw data)
Fig. 9
Fig. 9
Brain maps depicting significant associations between CSF αSyn and PiB-retention in ADAD mutation carrier subgroups. a PiB-positive asymptomatic (CDR < 0.5), b APOEε4-positive (CDR < 0.5). The significant associations between CSF αSyn and PiB are represented by the standardized β coefficient corresponding to independent predictor αSyn in the linear regression model for PiB ~ αSyn + EYO, where EYO is estimated years from symptom onset. Increasing positive associations (increasing β values) are labeled from red to yellow
Fig. 10
Fig. 10
Significant associations between CSF αSyn and regional PiB-retention in PiB-positive asymptomatic (CDR < 0.5, n = 28) ADAD mutation carriers (blue) and in symptomatic (CDR ≥0.5, n = 25) ADAD mutation carriers (purple) . The significant associations between CSF αSyn and PiB are represented by the standardized β coefficient corresponding to independent predictor αSyn in the linear regression model for PiB ~ αSyn + EYO, where EYO is estimated years from symptom onset, in four brain regions (a-d)

Similar articles

Cited by

References

    1. Arai Y, Yamazaki M, Mori O, Muramatsu H, Asano G, Katayama Y. α-Synuclein-positive structures in cases with sporadic Alzheimer’s disease: morphology and its relationship to tau aggregation. Brain Res. 2001;888:287–296. doi: 10.1016/S0006-8993(00)03082-1. - DOI - PubMed
    1. Bachhuber T, Katzmarski N, McCarter JF, Loreth D, Tahirovic S, Kamp F, et al. Inhibition of amyloid-β plaque formation by α-synuclein. Nat Med. 2015;21:802–807. doi: 10.1038/nm.3885. - DOI - PubMed
    1. Bateman RJ, Aisen PS, De Strooper B, Fox NC, Lemere CA, Ringman JM, et al. Autosomal-dominant Alzheimer’s disease: a review and proposal for the prevention of Alzheimer’s disease. Alzheimers Res Ther. 2011;3:1. doi: 10.1186/alzrt59. - DOI - PMC - PubMed
    1. Bateman RJ, Xiong C, Benzinger TLS, Fagan AM, Goate A, Fox NC, et al. Clinical and biomarker changes in dominantly inherited Alzheimer’s disease. N Engl J Med. 2012;367:795–804. doi: 10.1056/NEJMoa1202753. - DOI - PMC - PubMed
    1. Berge G, Lauridsen C, Sando SB, Holder DJ, Møller I, Aasly JO, et al. Effect of Tween-20 on Core biomarkers measured in cerebrospinal fluid from patients with Alzheimer’s disease, mild cognitive impairment, or healthy control individuals. J Alzheimer’s Dis. 2015;49:493–502. doi: 10.3233/JAD-150234. - DOI - PubMed

Publication types

MeSH terms