

α2A-Adrenergic Receptor Activation Decreases Parabrachial Nucleus Excitatory Drive onto BNST CRF Neurons and Reduces Their Activity In Vivo
- PMID: 30478032
- PMCID: PMC6335747
- DOI: 10.1523/JNEUROSCI.1035-18.2018
α2A-Adrenergic Receptor Activation Decreases Parabrachial Nucleus Excitatory Drive onto BNST CRF Neurons and Reduces Their Activity In Vivo
Erratum in
-
Erratum: Fetterly et al., "α2A-Adrenergic Receptor Activation Decreases Parabrachial Nucleus Excitatory Drive onto BNST CRF Neurons and Reduces Their Activity In Vivo".J Neurosci. 2019 Aug 21;39(34):6812. doi: 10.1523/JNEUROSCI.1456-19.2019. Epub 2019 Jul 24. J Neurosci. 2019. PMID: 31341025 Free PMC article. No abstract available.
Abstract
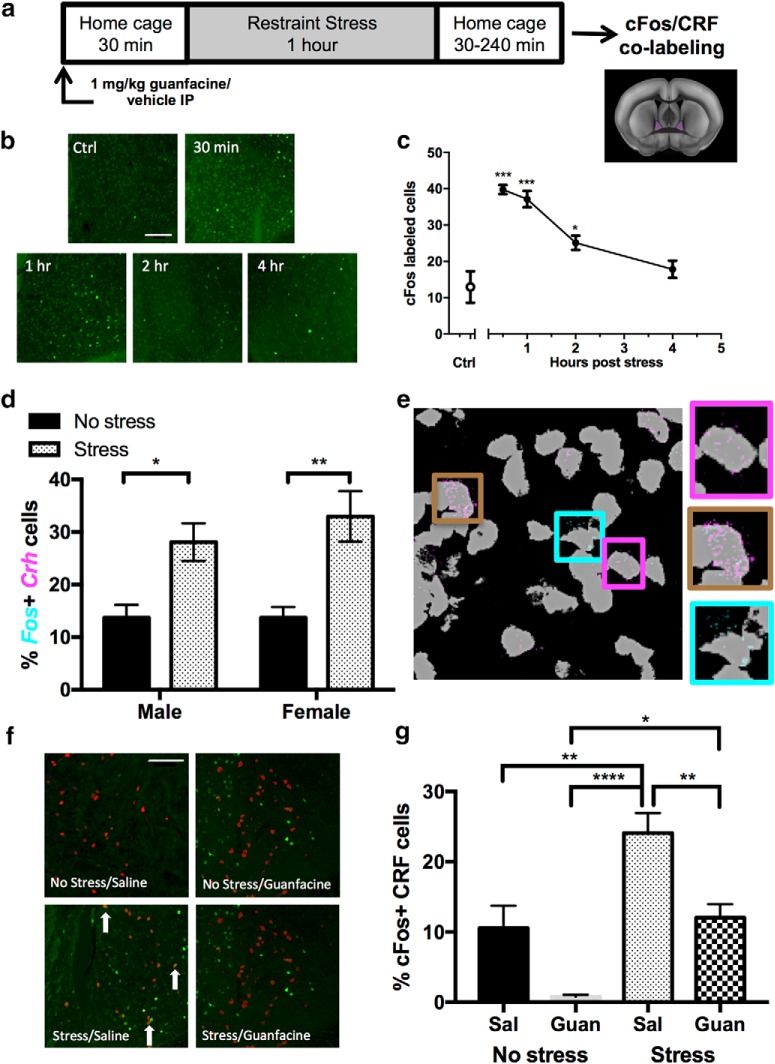
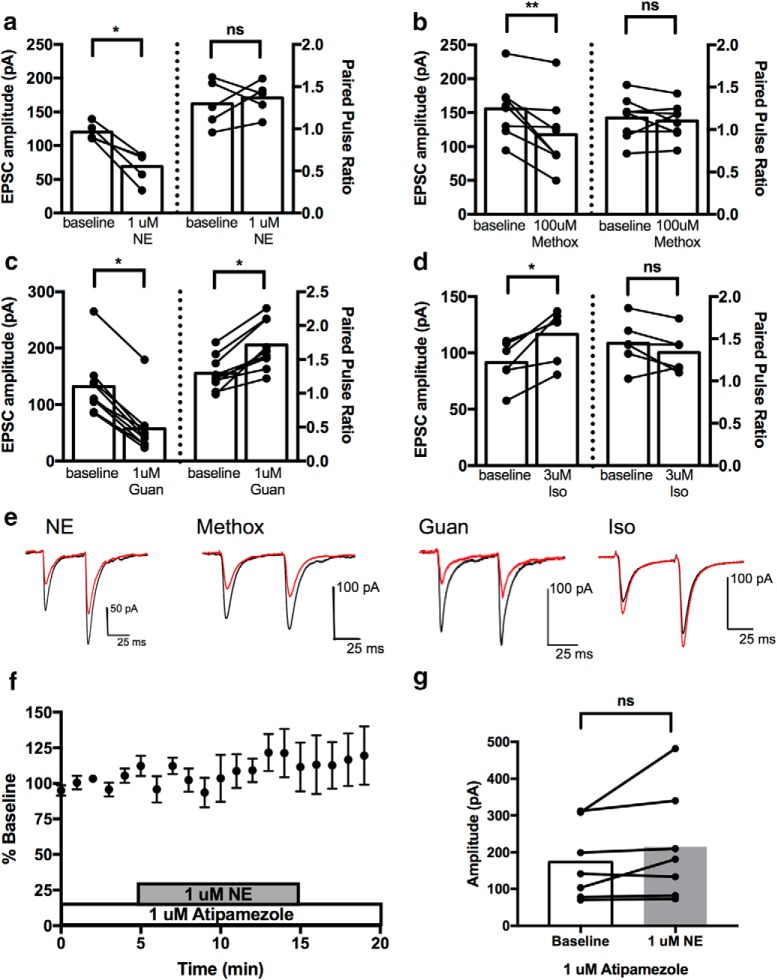
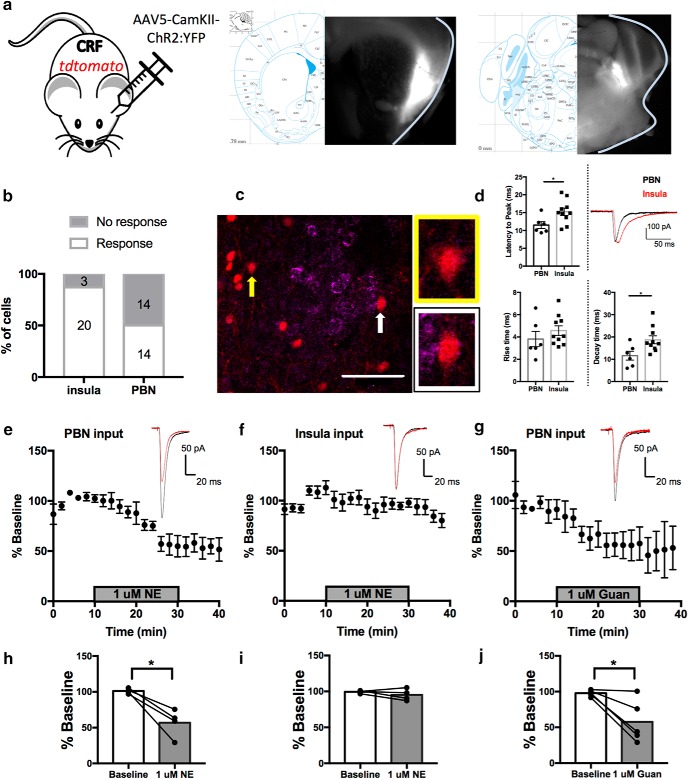
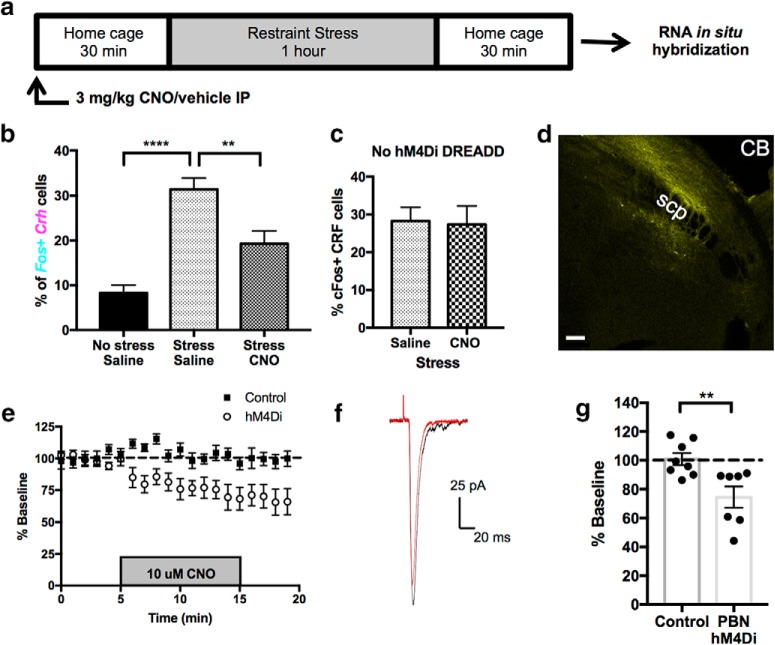
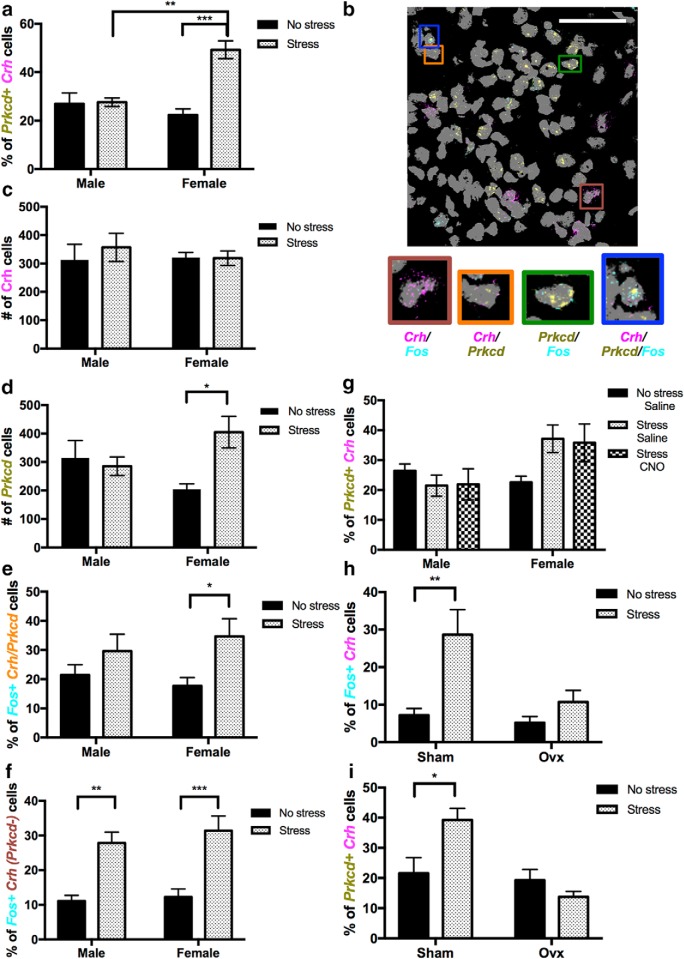
Stress contributes to numerous psychiatric disorders. Corticotropin releasing factor (CRF) signaling and CRF neurons in the bed nucleus of the stria terminalis (BNST) drive negative affective behaviors, thus agents that decrease activity of these cells may be of therapeutic interest. Here, we show that acute restraint stress increases cFos expression in CRF neurons in the mouse dorsal BNST, consistent with a role for these neurons in stress-related behaviors. We find that activation of α2A-adrenergic receptors (ARs) by the agonist guanfacine reduced cFos expression in these neurons both in stressed and unstressed conditions. Further, we find that α- and β-ARs differentially regulate excitatory drive onto these neurons. Pharmacological and channelrhodopsin-assisted mapping experiments suggest that α2A-ARs specifically reduce excitatory drive from parabrachial nucleus (PBN) afferents onto CRF neurons. Given that the α2A-AR is a Gi-linked GPCR, we assessed the impact of activating the Gi-coupled DREADD hM4Di in the PBN on restraint stress regulation of BNST CRF neurons. CNO activation of PBN hM4Di reduced stress-induced Fos in BNST Crh neurons. Further, using Prkcd as an additional marker of BNST neuronal identity, we uncovered a female-specific upregulation of the coexpression of Prkcd/Crh in BNST neurons following stress, which was prevented by ovariectomy. These findings show that stress activates BNST CRF neurons, and that α2A-AR activation suppresses the in vivo activity of these cells, at least in part by suppressing excitatory drive from PBN inputs onto CRF neurons.SIGNIFICANCE STATEMENT Stress is a major variable contributing to mood disorders. Here, we show that stress increases activation of BNST CRF neurons that drive negative affective behavior. We find that the clinically well tolerated α2A-AR agonist guanfacine reduces activity of these cells in vivo, and reduces excitatory PBN inputs onto these cells ex vivo Additionally, we uncover a novel sex-dependent coexpression of Prkcd with Crh in female BNST neurons after stress, an effect abolished by ovariectomy. These results demonstrate input-specific interactions between norepinephrine and CRF, and point to an action by which guanfacine may reduce negative affective responses.
Keywords: BNST; CRF; norepinephrine; parabrachial; stress.
Copyright © 2019 the authors 0270-6474/19/390472-13$15.00/0.
Figures
Similar articles
-
Corticotropin releasing factor and norepinephrine related circuitry changes in the bed nucleus of the stria terminalis in stress and alcohol and substance use disorders.Neuropharmacology. 2021 Dec 15;201:108814. doi: 10.1016/j.neuropharm.2021.108814. Epub 2021 Oct 6. Neuropharmacology. 2021. PMID: 34624301 Free PMC article. Review.
-
Dorsal BNST α2A-Adrenergic Receptors Produce HCN-Dependent Excitatory Actions That Initiate Anxiogenic Behaviors.J Neurosci. 2018 Oct 17;38(42):8922-8942. doi: 10.1523/JNEUROSCI.0963-18.2018. Epub 2018 Aug 27. J Neurosci. 2018. PMID: 30150361 Free PMC article.
-
Chronic Intermittent Ethanol and Acute Stress Similarly Modulate BNST CRF Neuron Activity via Noradrenergic Signaling.Alcohol Clin Exp Res. 2019 Aug;43(8):1695-1701. doi: 10.1111/acer.14118. Epub 2019 Jun 18. Alcohol Clin Exp Res. 2019. PMID: 31141179 Free PMC article.
-
alpha2A-adrenergic receptors heterosynaptically regulate glutamatergic transmission in the bed nucleus of the stria terminalis.Neuroscience. 2009 Sep 29;163(1):339-51. doi: 10.1016/j.neuroscience.2009.06.022. Epub 2009 Jun 12. Neuroscience. 2009. PMID: 19527774 Free PMC article.
-
How does pain induce negative emotion? Role of the bed nucleus of the stria terminalis in pain-induced place aversion.Curr Mol Med. 2015;15(2):184-90. doi: 10.2174/1566524015666150303002336. Curr Mol Med. 2015. PMID: 25732152 Review.
Cited by
-
Delineation of an insula-BNST circuit engaged by struggling behavior that regulates avoidance in mice.Nat Commun. 2021 Jun 11;12(1):3561. doi: 10.1038/s41467-021-23674-z. Nat Commun. 2021. PMID: 34117229 Free PMC article.
-
Noradrenergic stimulation of α1 adrenoceptors in the medial prefrontal cortex mediates acute stress-induced facilitation of seizures in mice.Sci Rep. 2023 May 19;13(1):8089. doi: 10.1038/s41598-023-35242-0. Sci Rep. 2023. PMID: 37208473 Free PMC article.
-
Corticotropin releasing factor and norepinephrine related circuitry changes in the bed nucleus of the stria terminalis in stress and alcohol and substance use disorders.Neuropharmacology. 2021 Dec 15;201:108814. doi: 10.1016/j.neuropharm.2021.108814. Epub 2021 Oct 6. Neuropharmacology. 2021. PMID: 34624301 Free PMC article. Review.
-
Thalamocortical mGlu8 Modulates Dorsal Thalamus Excitatory Transmission and Sensorimotor Activity.J Neurosci. 2024 Jul 31;44(31):e0119242024. doi: 10.1523/JNEUROSCI.0119-24.2024. J Neurosci. 2024. PMID: 38918065 Free PMC article.
-
Danger and distress: Parabrachial-extended amygdala circuits.Neuropharmacology. 2021 Oct 15;198:108757. doi: 10.1016/j.neuropharm.2021.108757. Epub 2021 Aug 27. Neuropharmacology. 2021. PMID: 34461068 Free PMC article. Review.
References
-
- Anantharam V, Kitazawa M, Wagner J, Kaul S, Kanthasamy AG (2002) Caspase-3-dependent proteolytic cleavage of protein kinase Cδ is essential for oxidative stress-mediated dopaminergic cell death after exposure to methylcyclopentadienyl manganese tricarbonyl. J Neurosci 22:1738–1751. 10.1523/JNEUROSCI.22-05-01738.2002 - DOI - PMC - PubMed
-
- Babb JA, Masini CV, Day HE, Campeau S (2013) Sex differences in activated corticotropin-releasing factor neurons within stress-related neurocircuitry and hypothalamic–pituitary–adrenocortical axis hormones following restraint in rats. Neuroscience 234:40–52. 10.1016/j.neuroscience.2012.12.051 - DOI - PMC - PubMed
-
- Butler RK, Oliver EM, Sharko AC, Parilla-Carrero J, Kaigler KF, Fadel JR, Wilson MA (2016) Activation of corticotropin releasing factor-containing neurons in the rat central amygdala and bed nucleus of the stria terminalis following exposure to two different anxiogenic stressors. Behav Brain Res 304:92–101. 10.1016/j.bbr.2016.01.051 - DOI - PMC - PubMed
Publication types
MeSH terms
Substances
Grants and funding
- T32 GM007628/GM/NIGMS NIH HHS/United States
- T32 MH064913/MH/NIMH NIH HHS/United States
- P30 DK058404/DK/NIDDK NIH HHS/United States
- R00 AA022937/AA/NIAAA NIH HHS/United States
- U2C DK059637/DK/NIDDK NIH HHS/United States
- U54 HD083211/HD/NICHD NIH HHS/United States
- R25 GM062459/GM/NIGMS NIH HHS/United States
- R01 DA042475/DA/NIDA NIH HHS/United States
- P30 EY008126/EY/NEI NIH HHS/United States
- R37 AA019455/AA/NIAAA NIH HHS/United States
- P30 DK020593/DK/NIDDK NIH HHS/United States
- P30 CA068485/CA/NCI NIH HHS/United States
- U24 DK059637/DK/NIDDK NIH HHS/United States
LinkOut - more resources
Full Text Sources
Molecular Biology Databases
Research Materials
Miscellaneous