

CNOT6L couples the selective degradation of maternal transcripts to meiotic cell cycle progression in mouse oocyte
- PMID: 30478191
- PMCID: PMC6293276
- DOI: 10.15252/embj.201899333
CNOT6L couples the selective degradation of maternal transcripts to meiotic cell cycle progression in mouse oocyte
Abstract
Meiotic resumption-coupled degradation of maternal transcripts occurs during oocyte maturation in the absence of mRNA transcription. The CCR4-NOT complex has been identified as the main eukaryotic mRNA deadenylase. In vivo functional and mechanistic information regarding its multiple subunits remains insufficient. Cnot6l, one of four genes encoding CCR4-NOT catalytic subunits, is preferentially expressed in mouse oocytes. Genetic deletion of Cnot6l impaired deadenylation and degradation of a subset of maternal mRNAs during oocyte maturation. Overtranslation of these undegraded mRNAs caused microtubule-chromosome organization defects, which led to activation of spindle assembly checkpoint and meiotic cell cycle arrest at prometaphase. Consequently, Cnot6l-/- female mice were severely subfertile. The function of CNOT6L in maturing oocytes is mediated by RNA-binding protein ZFP36L2, not maternal-to-zygotic transition licensing factor BTG4, which interacts with catalytic subunits CNOT7 and CNOT8 of CCR4-NOT Thus, recruitment of different adaptors by different catalytic subunits ensures stage-specific degradation of maternal mRNAs by CCR4-NOT This study provides the first direct genetic evidence that CCR4-NOT-dependent and particularly CNOT6L-dependent decay of selective maternal mRNAs is a prerequisite for meiotic maturation of oocytes.
Keywords: CCR4–NOT; maternal mRNA decay; maternal‐to‐zygotic transition; meiotic maturation; oocyte.
© 2018 The Authors.
Figures
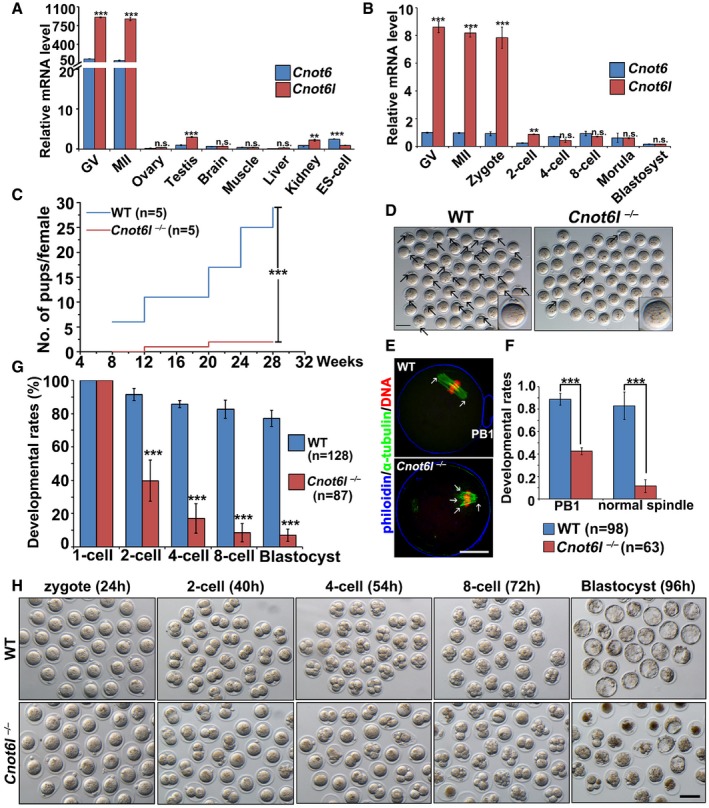
- A, B
Quantitative RT–PCR results showing relative expression levels of mouse Cnot6 and Cnot6l in oocytes (GV and MII), somatic tissues, ES cells (A), and preimplantation embryos (B). n = 3 biological replicates.
- C
Cumulative numbers of pups per female showing fertility of WT and Cnot6l −/− female mice. n = 5 females for each genotype.
- D
Representative image results of oocytes collected from oviducts of WT and Cnot6l −/− mice at 16 h after hCG injection. Scale bar, 100 μm. Arrows indicate polar body‐1 (PB1).
- E
Confocal microscopy results of oocytes collected from oviducts of WT and Cnot6l −/− mice at 16 h after hCG injection. Scale bar, 20 μm. Arrows indicate spindle poles.
- F
Rates of PB1 emission and normal spindle formation in oocytes ovulated by WT and Cnot6l −/− female mice. The numbers of analyzed oocytes are indicated (n).
- G
Quantification of preimplantation embryos derived from WT and Cnot6l −/− females that develop to the indicated stages after hCG administration and mated with adult WT males. The numbers of analyzed embryos are indicated (n).
- H
Representative images of embryos collected from the oviducts or uteri of WT and Cnot6l −/− female at indicated time points after hCG administration. Scale bar, 100 μm.
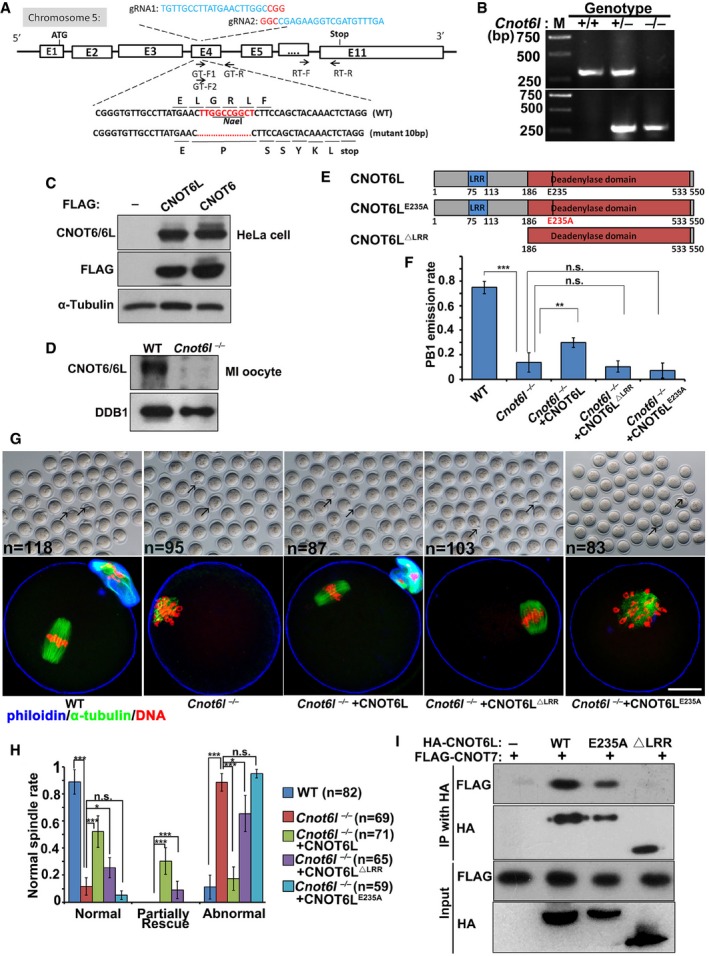
- A
Gene targeting strategy for CRISPR/Cas9‐based mouse Cnot6l knockout. F, forward; R, reverse; Stop, stop codon; gRNA, guide RNA.
- B
PCR results using tail genomic DNA as the template. The WT allele (“+”) and 10‐nucleotide‐deletion allele (“−”) were amplified with the primer pairs GT‐F1, GT‐F2, and GT‐R. Primer sequences were provided in Appendix Table S1.
- C, D
Western blot of CNOT6 and CNOT6L in HeLa cells transfected with plasmids expressing Flag‐CNOT6 or Flag‐CNOT6L (C) and in oocytes (WT and Cnot6l null) at the MI stage (D).
- E
A diagram showing the major functioning domains of mouse CNOT6L protein.
- F–H
Rates of PB1 emission (F), representative images and immunofluorescent staining of α‐tubulin (G), and rates of normal spindle assembly (H) in oocytes cultured for 16 h. Arrows indicate polar body‐1 (PB1). Fully grown GV oocytes were microinjected with mRNAs encoding CNOT6L, CNOT6LΔLRR, or CNOT6LE235A and were released from meiotic arrest at 12 h after microinjection. Rescue: oocytes contain normal shaped bipolar spindle and aligned chromosomes; partial rescue: oocytes contain normal shaped bipolar spindle but chromosomes were not properly aligned; abnormal: both spindle assembly and chromosome alignment failed in oocytes. Scale bar, 20 μm. Error bars, SEM. *P < 0.05; **P < 0.01; ***P < 0.001 by two‐tailed Student's t‐test. n.s.: non‐significant. The numbers of analyzed oocytes are indicated (n) in (H). n = 3 biological replicates in (F).
- I
Co‐IP results showing interactions of CNOT6L, CNOT6LE235A, and CNOT6LΔLRR with CNOT7. HeLa cells were co‐transfected with plasmids expressing HA‐CNOT6L and FLAG‐CNOT7 for 48 h before immunoprecipitation.
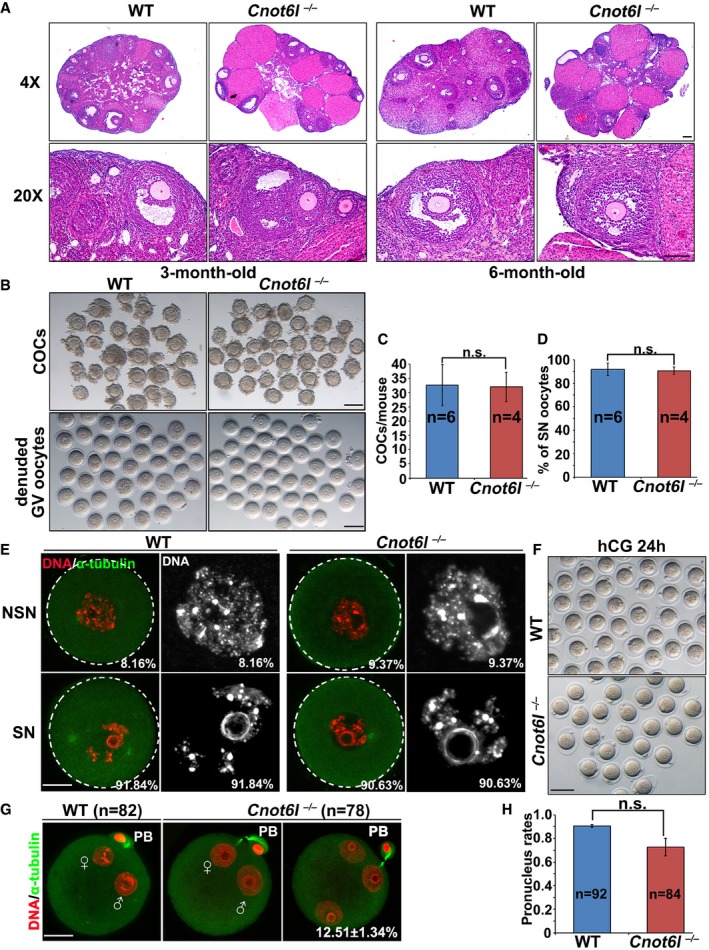
- A
Hematoxylin and eosin staining showing ovarian histology of WT and Cnot6l −/− mice. Scale bar, 100 μm.
- B, C
Representative images (B) and numbers (C) of cumulus–oocyte complexes (COCs) and denuded oocytes collected from antral follicles of WT and Cnot6l −/− mice. Scale bar, 100 μm. Error bars, SEM. n.s.: non‐significant. The numbers of analyzed mice are indicated (n).
- D
Percentage (%) of oocytes containing a surrounded nucleolus (SN) among oocytes in (B). Error bars, SEM. n.s.: non‐significant. The numbers of analyzed mice are indicated (n).
- E
Confocal microscopy results showing representative oocytes containing a non‐surrounded nucleolus (NSN) or a surrounded nucleolus (SN) among oocytes in (B). Percentages of NSN and SN oocytes among the total oocytes being collected are indicated in the corner. Scale bar, 20 μm.
- F
Representative images of zygotes collected from oviducts of WT and Cnot6l −/− female mice at 24 h after hCG injection and were mated with WT male mice. Scale bar, 100 μm.
- G
Confocal microscopy results showing representative zygotes containing 2 or 3 pronuclei. Scale bar, 20 μm.
- H
Quantification of pronucleus formation rates in zygotes shown in (F). Error bars, SEM. n.s.: non‐significant. The numbers of analyzed zygotes are indicated (n).
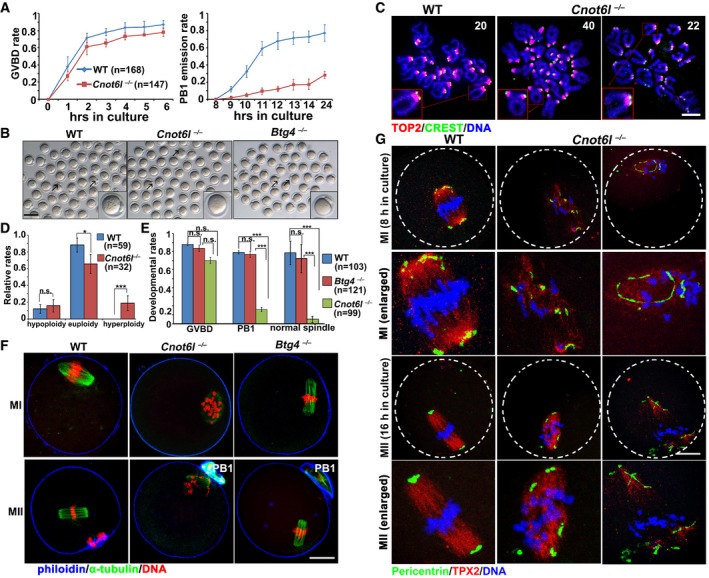
Rates of germinal vesicle breakdown (GVBD) and PB1 emission in oocytes cultured in vitro. Fully grown GV oocytes were collected from PMSG‐primed (44 h) WT and Cnot6l −/− mice. PB1: polar body‐1. Error bars, SEM. The numbers of analyzed oocytes are indicated (n).
Representative images of WT, Cnot6l −/−, and Btg4 −/− oocytes showing PB1 emission at 16 h after culture. Arrows indicate PB1. Scale bar, 100 μm.
Representative images of chromosome spreads made from WT and Cnot6l −/− oocytes after 16 h of in vitro maturation culture. Immunofluorescent staining of topoisomerase II (TOP2) and the centromere antigen CREST were performed to indicate chromosome arms and centromeres, respectively. Numbers of paired sister chromatids are indicated. Scale bar, 5 μm.
Percentage (%) of aneuploidy among in vitro cultured WT and Cnot6l −/− oocytes that have released PB1s. Error bars, SEM. *P < 0.05; ***P < 0.001 by two‐tailed Student's t‐test. n.s.: non‐significant. The numbers of analyzed oocytes are indicated (n).
Rates of GVBD, PB1 emission, and normal spindle assembly in WT, Cnot6l −/−, and Btg4 −/− oocytes cultured in vitro. Error bars, SEM. ***P < 0.001 by two‐tailed Student's t‐test. n.s.: non‐significant. The numbers of analyzed oocytes are indicated (n).
Confocal microscopy results showing spindle assembly in WT, Cnot6l −/−, and Btg4 −/− oocytes at metaphase I (MI) and metaphase II (MII). Scale bar, 20 μm.
Pericentrin immunofluorescence showing MTOCs in cultured WT, Cnot6l −/−, and Btg4 −/− oocytes at MI and MII stages. Spindle and DNA were labeled by microtubule nucleation factor (TPX2) and DAPI, respectively. Scale bar, 20 μm.
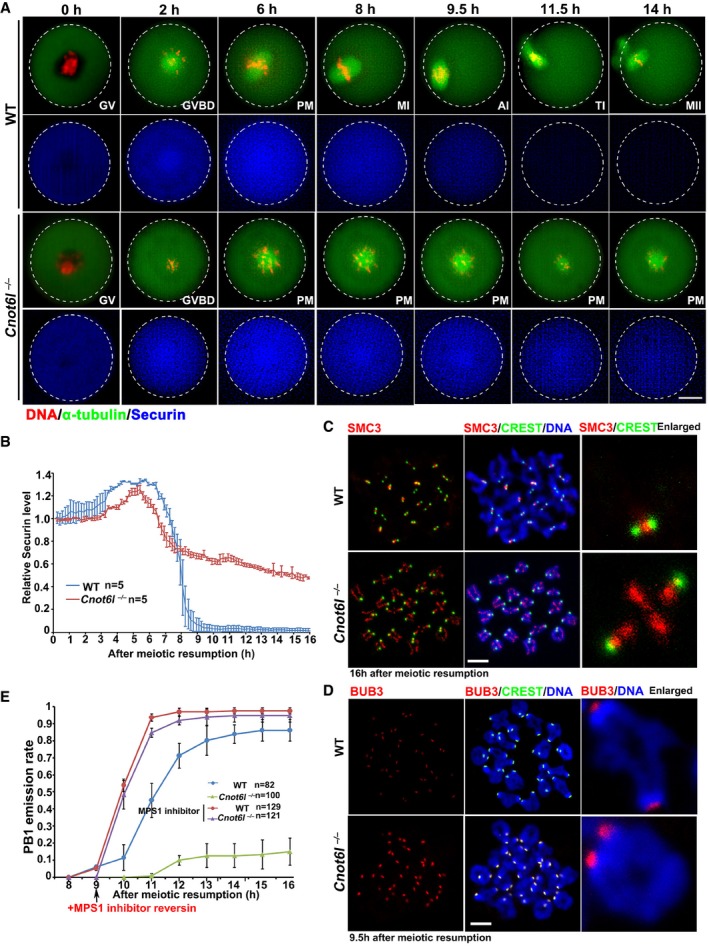
Live‐cell imaging results showing in vitro meiotic division of WT and Cnot6l −/− oocytes. Abbreviations: PM, prometaphase; MI, metaphase I; AI, anaphase I; TI, anaphase I‐metaphase II transition; MII, metaphase II; PB1: polar body‐1. Hours after released from GV arrest are indicated. Scale bar, 20 μm.
Data represent the mean and standard deviations of mCherry‐securin fluorescence intensity in WT and Cnot6l −/− oocytes at each time point. Values from individual oocytes are normalized relative to that at 0 h after released from GV arrest. The numbers of analyzed oocytes are indicated (n).
SMC3 immunofluorescence showing cohesin on chromosomes of WT and Cnot6l −/− oocytes at 16 h after culture. Centromeres and DNA were labeled by CREST and DAPI, respectively. Scale bar, 5 μm.
BUB3 immunofluorescence on chromosome spreads made from WT and Cnot6l −/− oocytes at 9.5 h after culture. More than 8 oocytes were observed for each genotype with similar results. Scale bar, 5 μm.
PB1 emission rates in WT and Cnot6l −/− oocytes cultured with or without MPS1 inhibitor reversin (5 μm). Reversin is added at 9 h after culture. Error bars, SEM. The numbers of analyzed oocytes are indicated (n).
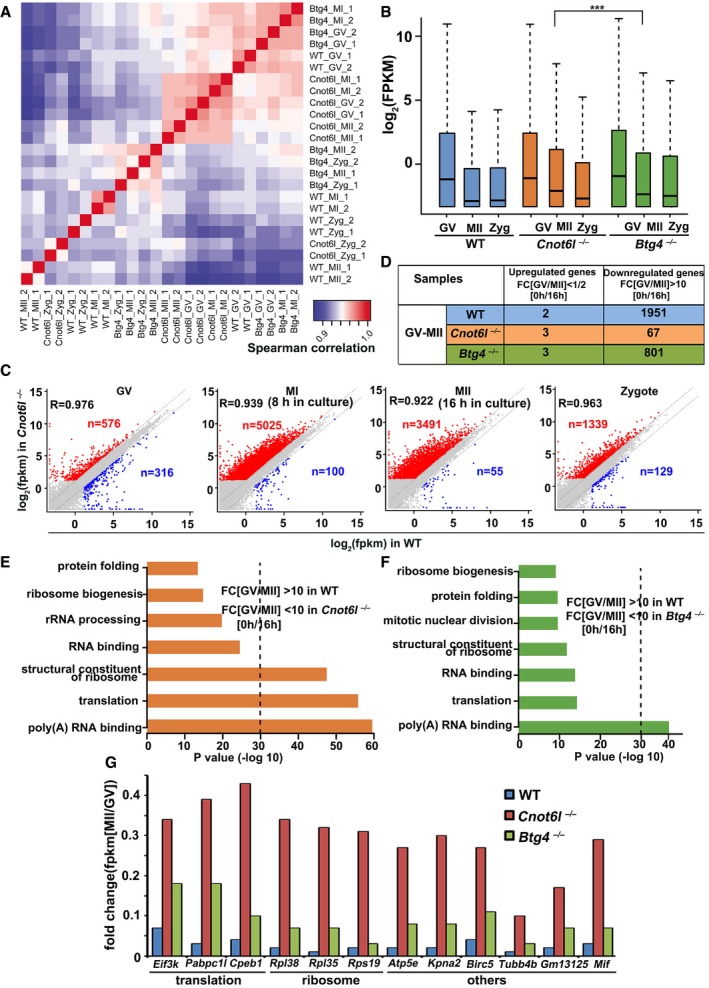
- A
Heatmap of Spearman correlation coefficients of total transcripts among WT, Cnot6l −/−, and Btg4 −/− oocytes and embryos at different stages.
- B
Global mRNA levels in WT, Cnot6l −/−, and Btg4 −/− oocytes at different stages. The expression level of each transcript is normalized by mRNA encoding mCherry, which was in vitro transcribed and equally added to each sample before RNA extraction. The box indicates upper and lower quantiles, the thick line in the box indicates the median, and the whiskers represent 2.5th and 97.5th percentiles. ***P < 0.001 by two‐tailed Student's t‐test.
- C
Scatter plot comparing transcripts between WT and Cnot6l −/− oocytes (at GV, MI, and MII stages) and zygotes derived from these oocytes. Transcripts decreased or increased more than 2‐fold in Cnot6l −/− oocyte samples were highlighted with blue or red, respectively.
- D
Number of genes up‐ and downregulated during GV‐to‐MII transitions.
- E, F
Gene ontology analysis of transcripts significantly degraded during GV‐to‐MII transition (GV/MII > 10) in WT oocytes but were stabilized in Cnot6l −/− (E) or Btg4 −/− oocytes (F).
- G
RNA‐seq results showing the relative expression levels (MII/GV) of representative transcripts in WT, Cnot6l −/−, and Btg4 −/− oocytes.
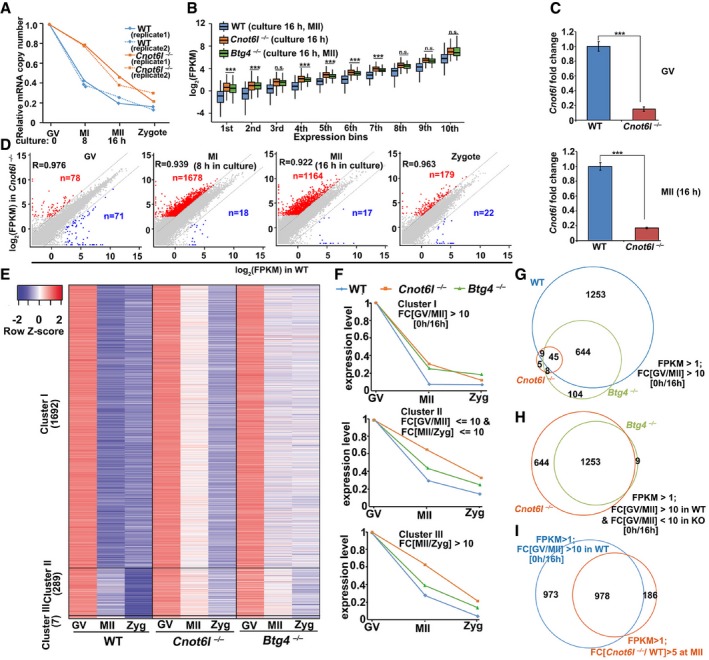
Relative mRNA copy number dynamics in WT and Cnot6l −/− samples at the indicated stages. Error bars indicate values of the two biological replicates.
Box plot showing gene expression levels of WT, Cnot6l −/−, and Btg4 −/− oocytes at the MII stage. Genes were divided into 10 bins according to their expression levels in the WT MII oocytes. The box indicates upper and lower quantiles, the thick line in the box indicates the median, and the whiskers represent 2.5th and 97.5th percentiles. ***P < 0.001 by two‐tailed Student's t‐test. n.s.: non‐significant.
qRT–PCR results showing the relative expression levels of Cnot6l in oocytes collected from WT and Cnot6l −/− mice (Cnot6l −/−/WT). Error bars, SEM. ***P < 0.001 by two‐tailed Student's t‐test. n = 3 biological replicates.
Scatter plot comparing transcripts between WT and Cnot6l −/− oocytes (at GV, MI, and MII stages) and zygotes derived from these oocytes. Transcripts decreased or increased more than 5‐fold in Cnot6l −/− oocyte samples were highlighted with blue or red, respectively.
Heatmap showing transcripts that were degraded during meiotic maturation (GV/Zygote > 10) in WT oocytes. The definition of cluster I‐III is described in the text.
Relative mRNA copy number dynamics of the three gene clusters in WT, Cnot6l −/−, and Btg4 −/− samples.
Venn diagrams showing the overlap of transcripts that were significantly degraded during GV‐to‐MII transition in WT, Cnot6l −/−, and Btg4 −/− oocytes (GV/MII > 10).
Venn diagrams showing the overlap of transcripts that were stabilized during GV‐to‐MII transition in Cnot6l −/− and Btg4 −/− oocytes (GV/MII > 10 in WT, but < 10 in KO).
Venn diagrams showing the overlap of transcripts that were destabilized in GV–MII transition (FPKM > 1; fold change (GV/MII) > 10) of WT oocytes and the genes upregulated in this process after Cnot6l knockout (FPKM > 1; fold change (Cnot6l −/−/WT at MII) > 10).
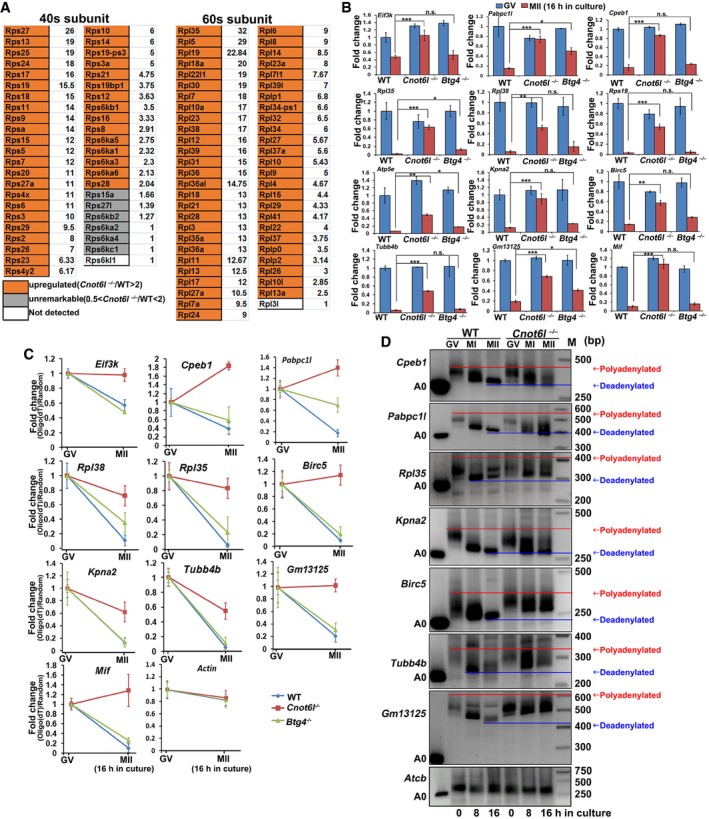
Level changes of transcripts encoding ribosomal proteins in Cnot6l −/− oocytes at MII stage. The fold changes (Cnot6l −/−/WT) are listed to the right of the boxes.
Quantitative RT–PCR results showing the relative levels of indicated transcripts in WT, Cnot6l −/−, and Btg4 −/− oocytes at GV and MII stages. n = 3 biological replicates. Error bars, SEM. Statistical analysis was performed using Student's t‐test. *P < 0.05, **P < 0.01, ***P < 0.001. n.s.: non‐significant.
Changes of qRT–PCR results obtained from oligo‐dT‐ versus random primer‐mediated RT reactions reflecting the poly(A) tail length changes of given maternal transcripts during GV‐to‐MII transitions in WT, Cnot6l −/−, and Btg4 −/− oocytes. n = 3 biological replicates. Error bars, SEM.
Poly(A) tail assay results showing changes in poly(A)‐tail length of indicated transcripts in WT and Cnot6l −/− oocytes at GV, MI, and MII stages. Experiments were performed three times with reproducible results; a representative result is shown.
- A
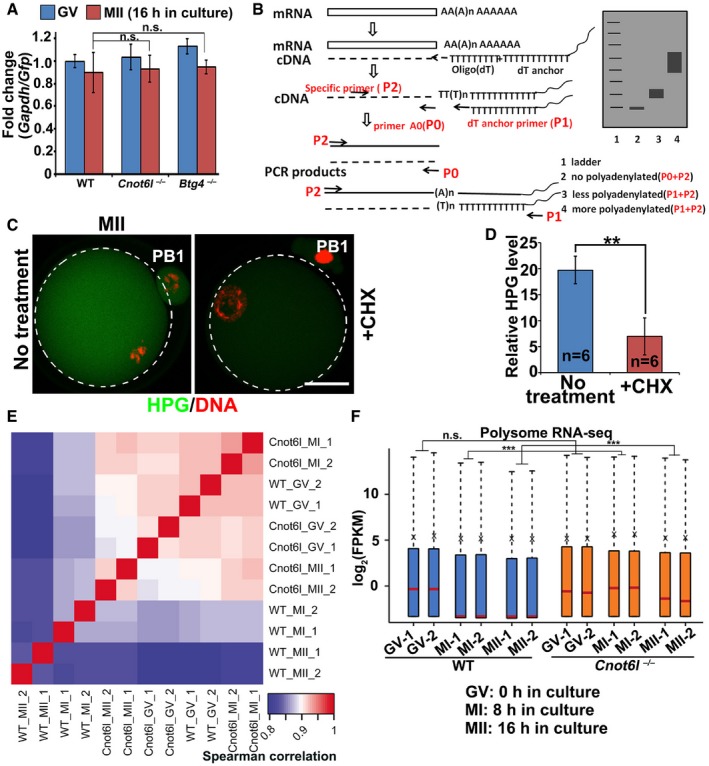
Quantitative RT–PCR (qRT–PCR) showing the relative levels between Gapdh and Gfp in GV and MII oocytes collected from WT, Cnot6l −/−, and Btg4 −/− mice. mRNAs encoding GFP were in vitro transcribed and equally added to each sample (0.1 ng/μl) before RNA extraction. Error bars, SEM. n.s.: non‐significant. n = 3 technical replicates.
- B
Strategy of the mRNA poly(A) tail assay. P0, primer A0 that located at the end of mRNA 3′TUR without poly (A); P1, dT anchor primer (GCGAGCTCCGCGGCCGCGT12); P2, gene‐specific primer.
- C, D
Immunofluorescence (C) and quantification (D) of HPG showing the overall translation levels of MII oocytes cultured in medium with or without cycloheximide (CHX, 20 μM). Scale bar, 20 μm. **P < 0.01 by two‐tailed Student's t‐test. n = 3 biological replicates.
- E
Heatmap of Spearman correlation coefficients of transcripts associated with polysomes in WT and Cnot6l −/− oocytes at GV, MI, and MII stages.
- F
Levels of polysome‐bound transcripts in WT and Cnot6l −/− oocytes at indicated stages (two biological repeats). The expression level of each transcript was normalized by the mCherry spike‐in, which was in vitro transcribed and equally added to each sample before RNA extraction. The box indicates upper and lower quantiles, the red line in the box indicates the median, and the whiskers represent 2.5th and 97.5th percentiles, respectively. ***P < 0.001 by two‐tailed Student's t‐test. n.s.: non‐significant.
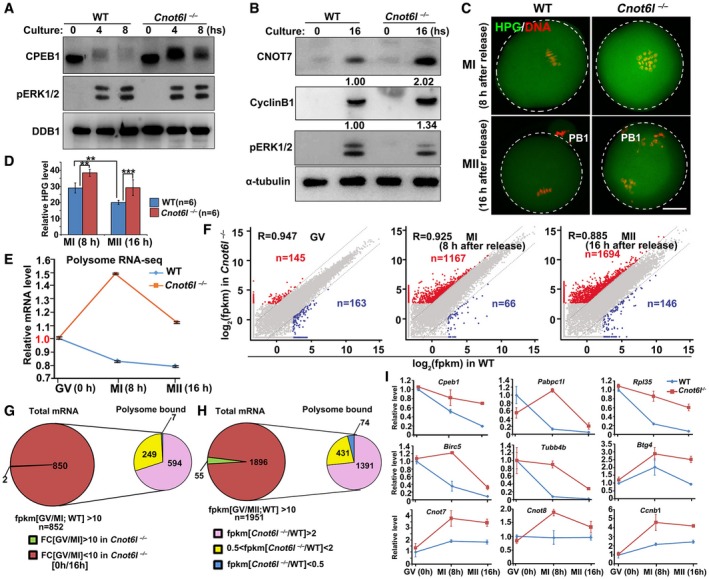
- A, B
Western blot results showing the levels of CPEB1 in WT and Cnot6l −/− oocytes at the indicated time points after meiotic resumption. Total proteins from 50 (A) or 100 (B) oocytes are loaded in each lane. DDB1 (A) or α‐tubulin (B) is blotted as a loading control. Experiments were performed three times with reproducible results; a representative result is shown.
- C, D
Immunofluorescence (C) and quantification (D) of L‐homopropargylglycine (HPG) showing the overall translation levels of MI and MII oocytes collected from WT and Cnot6l −/− mice. Scale bar, 20 μm. Error bars, standard deviations (n = 6 oocytes for each genotype). **P < 0.01, ***P < 0.001.
- E
Relative mRNA copy numbers of polysome‐bound transcripts in WT and Cnot6l −/− oocytes at indicated stages. Error bars indicate values of the replicates.
- F
Scatter plot comparing polysome‐bound transcripts between WT and Cnot6l −/− oocytes at GV, MI, and MII stages, respectively. Transcripts decreased or increased more than 5‐fold in Cnot6l −/− oocyte samples were highlighted with blue or red, respectively.
- G
Pie chart in left depicts total transcripts significantly degraded during GV‐MI transitions in WT oocytes. Pie chart in right shows the polysome association of transcripts that were deemed to be degraded during GV‐MI transitions in WT oocytes, but were stabilized after Cnot6l knockout.
- H
Pie chart in left depicts total transcripts significantly degraded during GV–MII transitions in WT oocytes. Pie chart in right shows the polysome association of transcripts that were deemed to be degraded during GV–MII transitions in WT oocytes, but were stabilized after Cnot6l knockout.
- I
Quantitative RT–PCR results showing the relative levels of indicated transcripts in association with polysomes in WT and Cnot6l −/− oocytes at GV, MI, and MII stages. Error bars, standard deviations (n = 3 biological repeats).
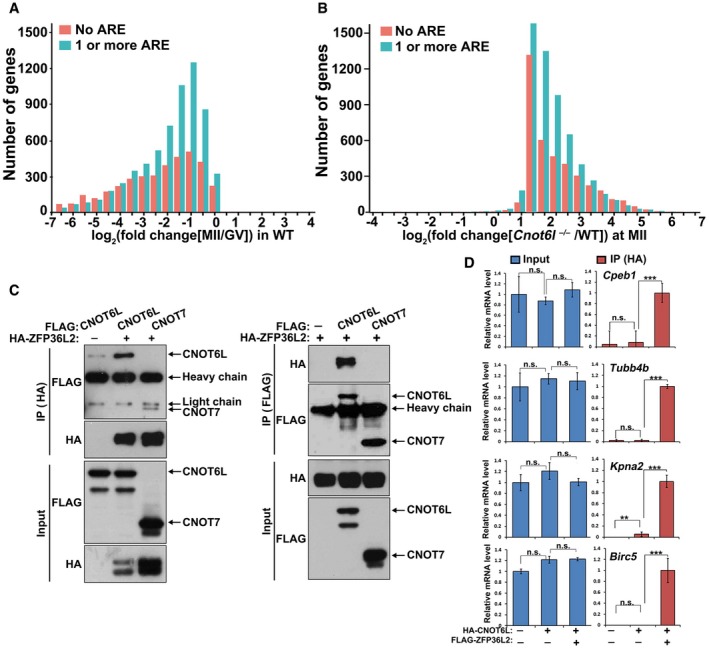
Presence of putative AREs (AUUUA) in transcripts of WT oocyte. Transcripts containing no ARE or transcripts containing 1 or more AREs were subdivided into frequency groups according to the log2 fold change (MII/GV) in WT oocytes.
Presence of putative AREs in oocyte transcripts stabilized by Cnot6l −/− knockout. Transcripts containing no ARE or transcripts containing 1 or more AREs were subdivided into frequency groups according to the log2 fold change (Cnot6l −/−/WT) at MII stage.
Co‐IP results showing interaction of ZFP36L2 with CNOT6L and CNOT7. HeLa cells were co‐transfected with plasmids expressing HA‐ZFP36L2 and FLAG‐CNOT6L/7 for 48 h before immunoprecipitation. Experiments were performed three times with reproducible results; a representative result is shown.
RNA immunoprecipitation results showing interaction of CNOT6L with indicated transcripts, with or without the presence of ZFP36L2. HeLa cells were co‐transfected with plasmids expressing FLAG‐ZFP36L2 and HA‐CNOT6L for 48 h before immunoprecipitation using an anti‐HA antibody. mRNAs recovered from the immunoprecipitates were subjected to qRT–PCR. Error bars, standard deviations (n = 3 biological repeats). ***P < 0.001 by two‐tailed Student's t‐test.
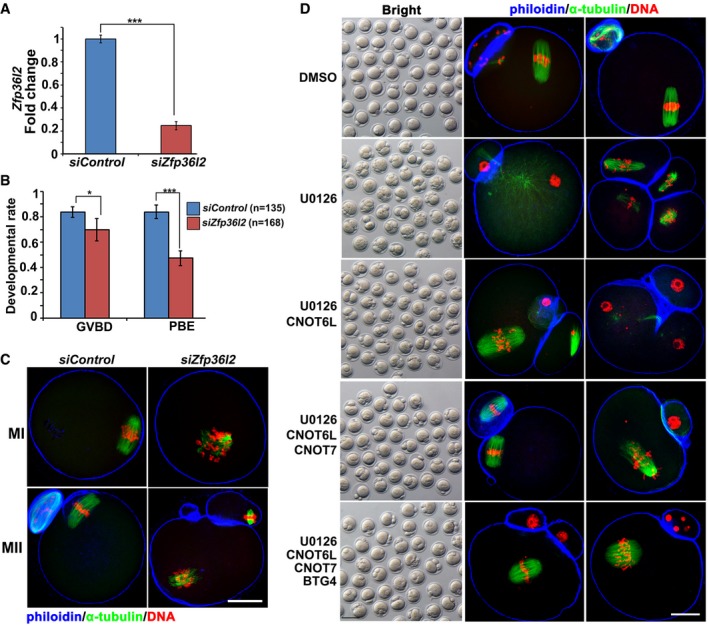
qRT–PCR results showing the efficiency of Zfp36l2 RNA interference in oocytes at the GV stage. n = 3 technical replicates. Error bars, SEM. ***P < 0.001 by two‐tailed Student's t‐test.
GVBD and PB1 emission rates of oocytes microinjected control and Zfp36l2‐targeted siRNAs. Error bars, SEM. *P < 0.05; ***P < 0.001 by two‐tailed Student's t‐test. The numbers of analyzed oocytes are indicated (n).
Confocal microscopy results showing spindle assembly at MI and MII stages in oocytes microinjected with control siRNAs or siZfp36l2. Scale bar, 20 μm.
PB2 emission and spindle assembly in oocytes cultured with or without U0126 treatment. Fully grown GV oocytes were microinjected with mRNAs encoding CNOT6L, CNOT7, and/or BTG4 and are released from milrinone at 12 h after microinjection. Then, the oocytes were further culture for 24 h with or without adding U0126 (20 μM) to the medium. Scale bar, 100 μm in brightfield images; Scale bar, 20 μm in immunofluorescence staining images.
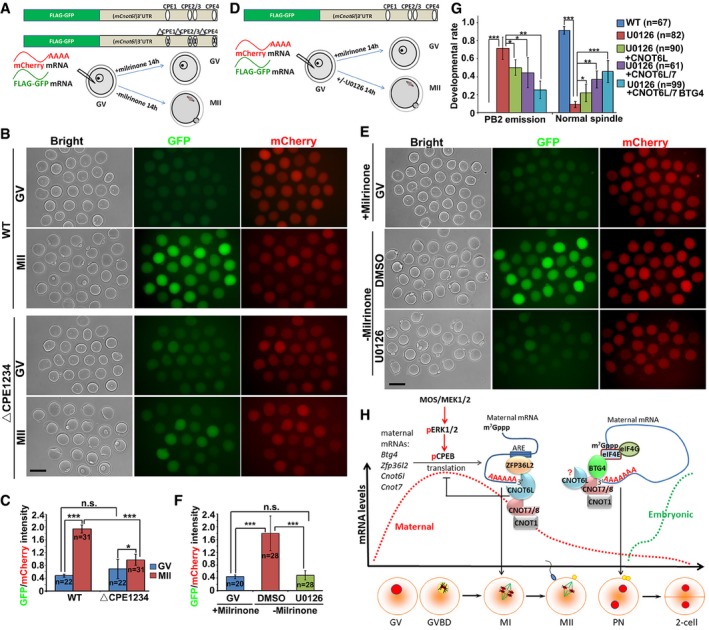
- A, B
Illustration (A) and fluorescence microscopy results (B) showing the translation activities of the Cnot6l 3′‐UTR (WT and CPE mutated) in GV‐arrested (maintained by 2 μM milrinone) or MII‐arrested (released from milrinone) oocytes. GFP signal indicated translational activation of Cnot6l 3′‐UTR. An in vitro transcribed and polyadenylated mCherry mRNA was co‐microinjected as a positive control. Scale bar, 100 μm.
- C
Relative intensity of GFP signal in (B) after normalization by mCherry signal in the same oocyte. Error bars, SEM. *P < 0.05; ***P < 0.001 by two‐tailed Student's t‐test. n.s.: non‐significant. The numbers of analyzed oocytes are indicated (n).
- D, E
Illustration (D) and fluorescence microscopy results (E) showing the expression of GFP‐fused Cnot6l 3′‐UTR in GV and MII oocytes with or without U0126 treatment (20 μM). Scale bar, 100 μm.
- F
Relative intensity of GFP signal in (E) after normalization by mCherry signal in the same oocyte. Error bars, SEM. ***P < 0.001 by two‐tailed Student's t‐test. n.s.: non‐significant. The numbers of analyzed oocytes are indicated (n).
- G
Rates of PB2 emission and normal spindle assembly in oocytes cultured with or without U0126. Fully grown GV oocytes were microinjected with mRNAs encoding CNOT6L, CNOT7, and/or BTG4 and are released from milrinone at 12 h after microinjection. Then, the oocytes were further culture for 24 h with or without adding U0126 to the medium. Error bars, SEM. *P < 0.05; **P < 0.01; ***P < 0.001 by two‐tailed Student's t‐test. n.s.: non‐significant. The numbers of analyzed oocytes are indicated (n).
- H
A diagram showing role of CCR4–NOT deadenylase complex in targeting maternal mRNA decay. During the onset of oocyte meiotic resumption, MAPK cascade and CPEB1 triggers translational activation of maternal transcripts including those encoding BTG4, CNOT7, CNOT6L, and ZFP36L2 (Belloc & Mendez, 2008; Ma et al, 2015; Yu et al, 2016b; Sha et al, 2017). CNOT6L and other CCR4–NOT components are important downstream effectors of ERK1 and ERK2 in the regulation of spindle assembly and meiotic cell cycle progression in oocytes. During oocyte maturation, RNA‐binding protein ZFP36L2 associates with CNOT6L and functions as a CCR4–NOT adaptor in triggering the degradation of ARE‐containing transcripts. At a later stage of MZT, an alternative adaptor BTG4 binds to translation initiation factor eIF4E and thereby recruits the CCR4–NOT complex to the actively translated mRNAs. The stepwise recruitment of different adaptors by different catalytic subunits mediates stage‐specific degradation of maternal mRNAs by the CCR4–NOT deadenylase. The question mark means that the direct involvement of CNOT6L in BTG4‐mediated MZT process remains inconclusive because Cnot6l null oocytes had severe meiosis defects before MZT.
References
Publication types
MeSH terms
Substances
LinkOut - more resources
Full Text Sources
Molecular Biology Databases
