. 2019 Feb;4(2):280-292.
doi: 10.1038/s41564-018-0297-1. Epub 2018 Nov 26.

An upstream protein-coding region in enteroviruses modulates virus infection in gut epithelial cells

Affiliations

An upstream protein-coding region in enteroviruses modulates virus infection in gut epithelial cells

Valeria Lulla et al. Nat Microbiol. 2019 Feb.

Abstract

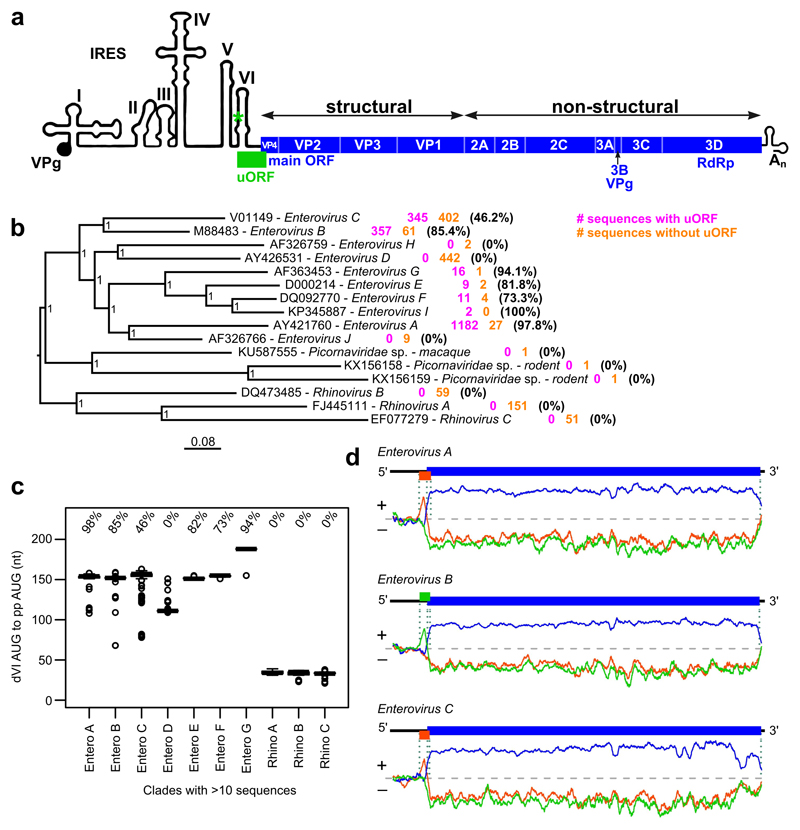
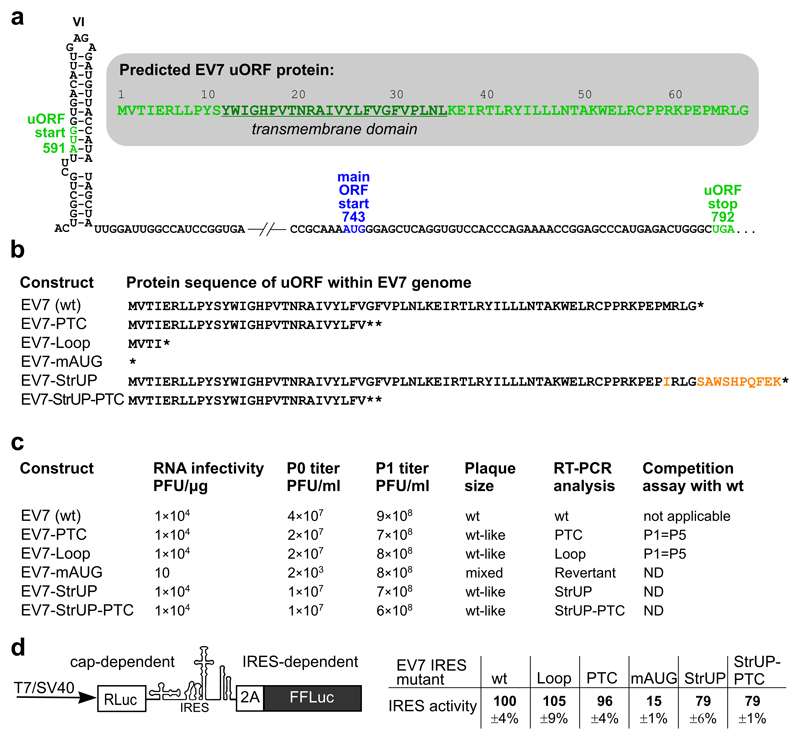
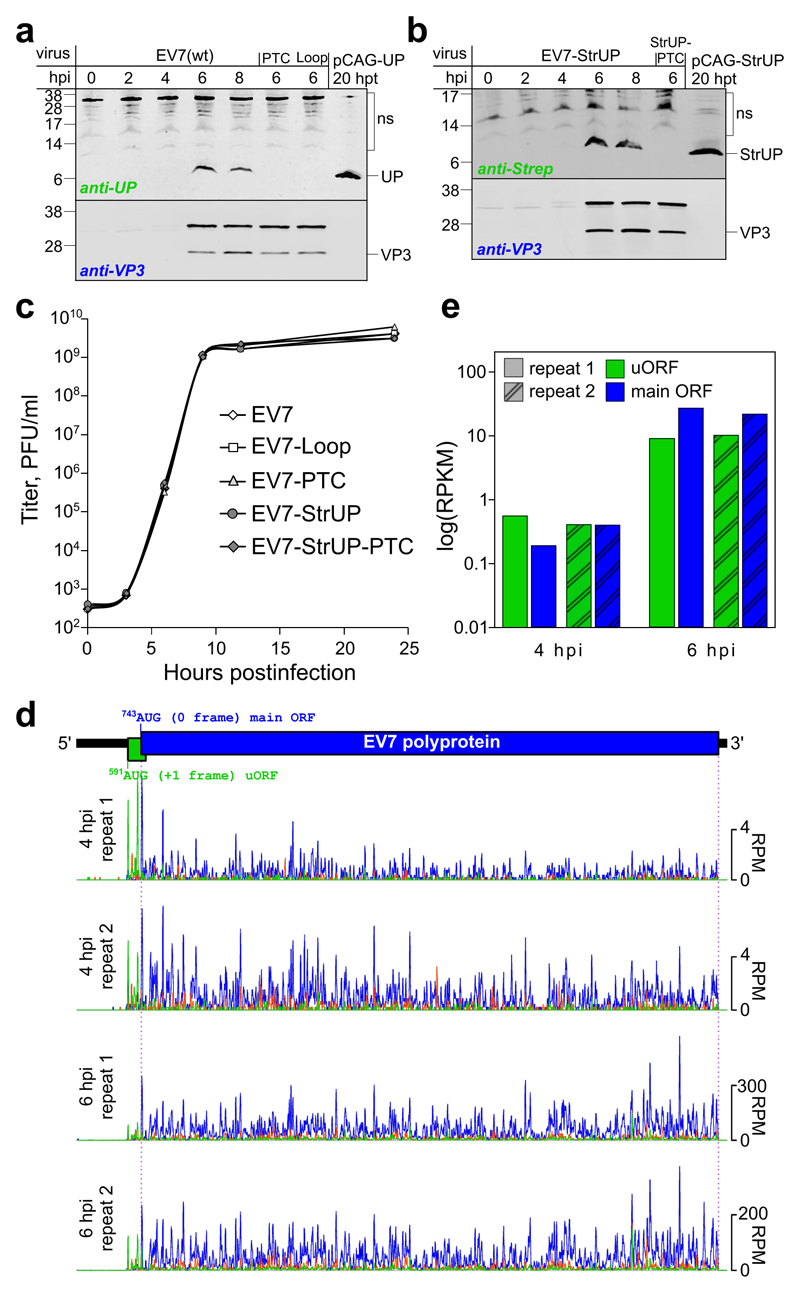
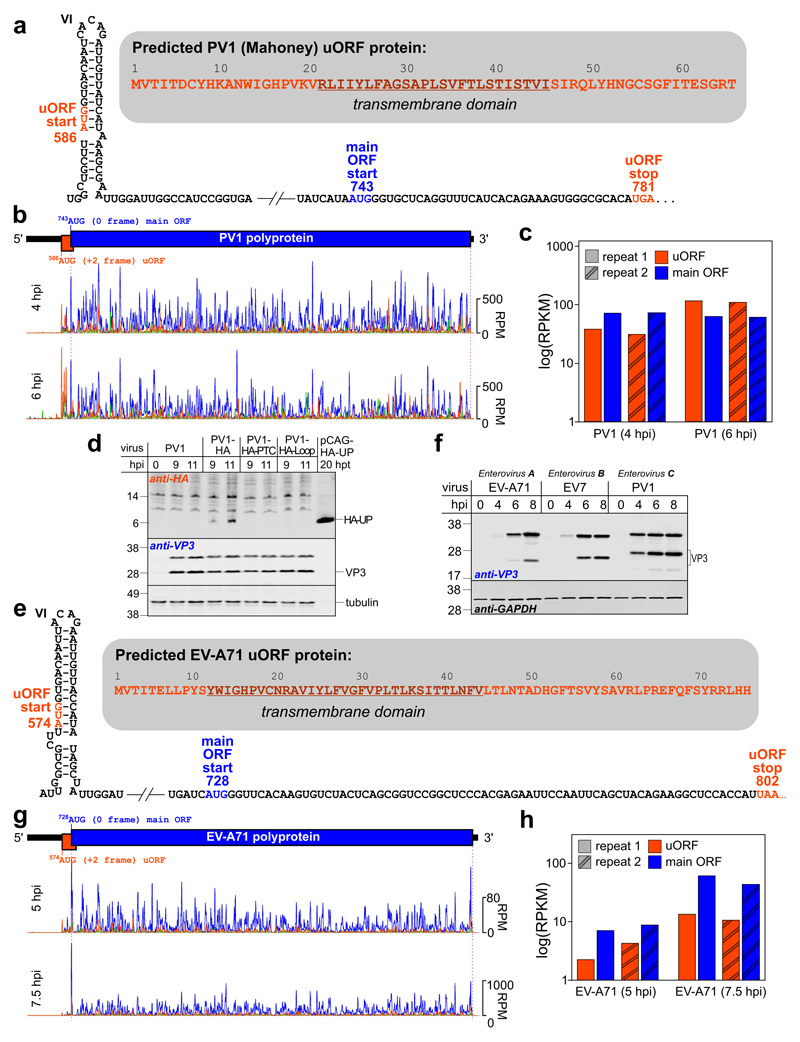
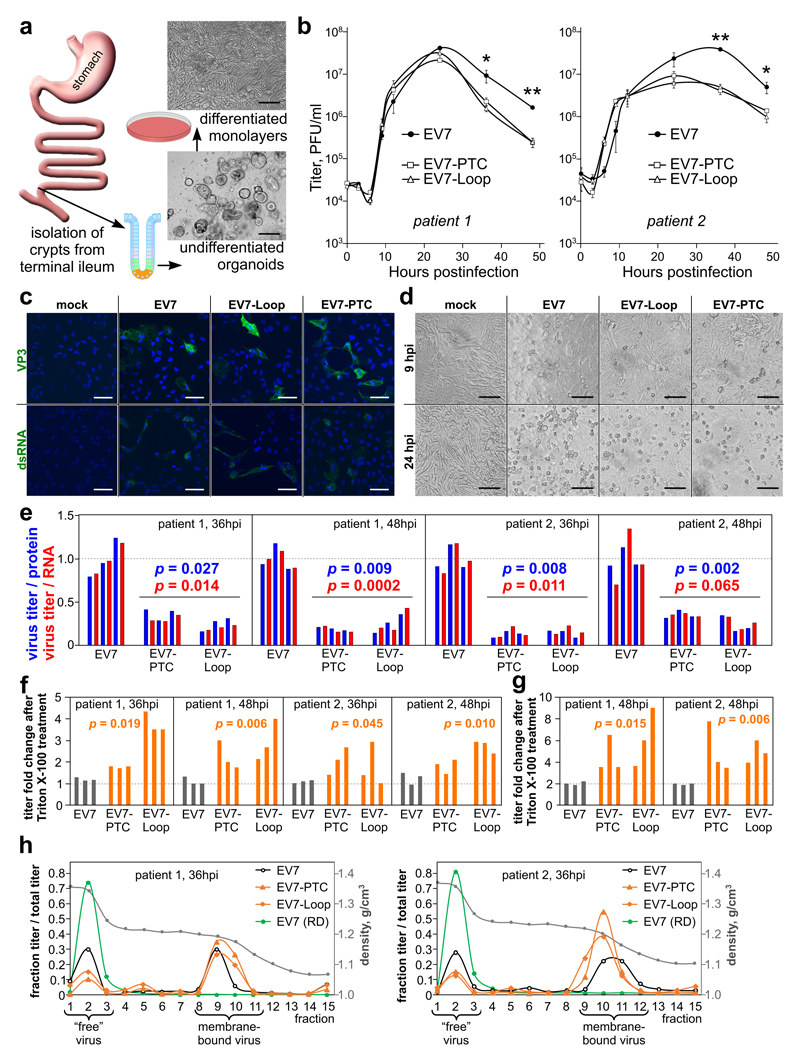
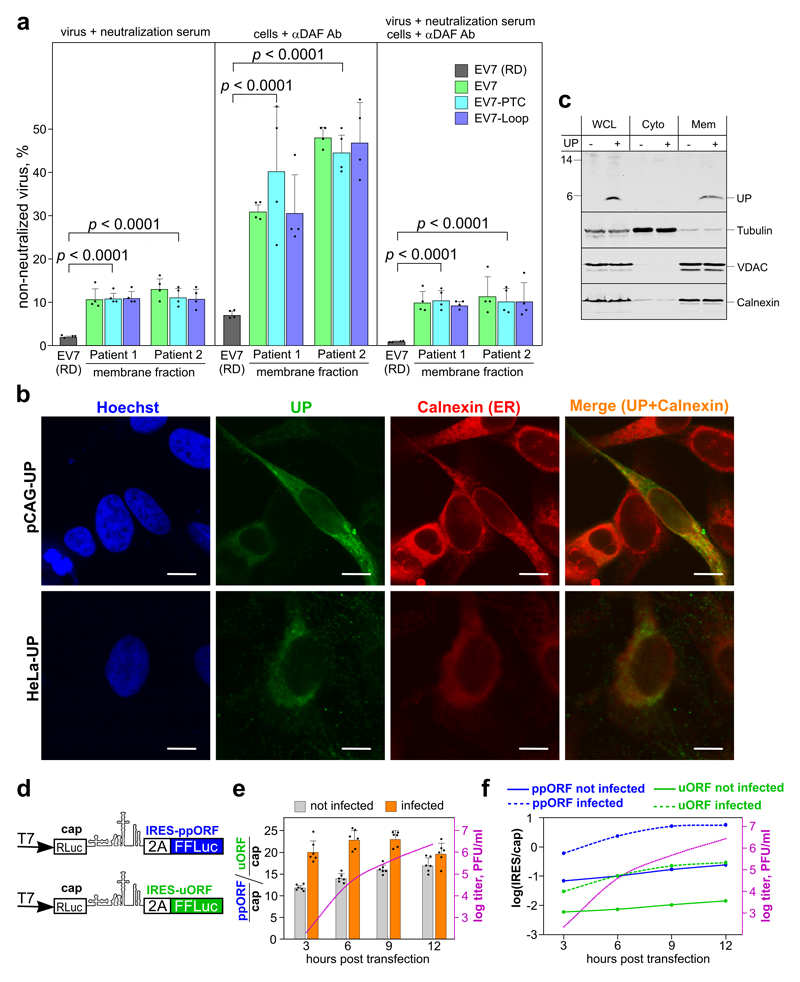
Enteroviruses comprise a large group of mammalian pathogens that includes poliovirus. Pathology in humans ranges from sub-clinical to acute flaccid paralysis, myocarditis and meningitis. Until now, all of the enteroviral proteins were thought to derive from the proteolytic processing of a polyprotein encoded in a single open reading frame. Here we report that many enterovirus genomes also harbour an upstream open reading frame (uORF) that is subject to strong purifying selection. Using echovirus 7 and poliovirus 1, we confirmed the expression of uORF protein in infected cells. Through ribosome profiling (a technique for the global footprinting of translating ribosomes), we also demonstrated translation of the uORF in representative members of the predominant human enterovirus species, namely Enterovirus A, B and C. In differentiated human intestinal organoids, uORF protein-knockout echoviruses are attenuated compared to the wild-type at late stages of infection where membrane-associated uORF protein facilitates virus release. Thus, we have identified a previously unknown enterovirus protein that facilitates virus growth in gut epithelial cells-the site of initial viral invasion into susceptible hosts. These findings overturn the 50-year-old dogma that enteroviruses use a single-polyprotein gene expression strategy and have important implications for the understanding of enterovirus pathogenesis.


Conflict of interest statement

Competing interests

The authors declare no competing interests.

Figures

Fig. 1
Fig. 1. Comparative genomic analysis of the Enterovirus genus.
a, Schematic representation of the enterovirus genome showing the uORF (green), ppORF (blue), and 5ʹ/3ʹ UTR RNA structures (not to scale). b, Phylogenetic tree for the Enterovirus genus. Within each clade, the number of sequences containing (pink) or not containing (orange) the uORF, and the percentage of sequences containing the uORF are indicated. The tree, calculated with MrBayes, is based on the polyprotein amino acid sequences of the indicated reference sequences, and is midpoint-rooted; nodes are labelled with posterior probability values. c, Box plots of distances between the dVI AUG codon and the polyprotein AUG codon for different enterovirus clades (centre lines = medians; boxes = interquartile ranges; whiskers extend to most extreme data point within 1.5 × interquartile range from the box; circles = outliers; n = sum of sequences with and without the uORF as shown in (a)). In each clade, the percentage of sequences that contain the uORF is indicated. d, Coding potential in the three reading frames (indicated by the three colors) as measured with MLOGD, for sequences that contain the uORF (see Fig. S1b for Enterovirus E, F and G). Positive scores indicate that the sequence is likely to be coding in the given reading frame. Reading frame colors correspond to the genome maps shown above each plot, indicating the ppORF and uORF in the reference sequences EV-A71, EV7 and PV1, respectively.
Fig 2
Fig 2. Analysis of wt and mutant EV7 viruses.
a, Schematic representation of the EV7 IRES dVI and uORF region with the uORF start and stop (green) and main ORF start (blue) annotated. The UP amino acid sequence is shown in the shadowed inset with the predicted TM domain underlined. b, Predicted UP amino acid sequences for the wt and mutant EV7 viruses. c, The infectivity of in vitro-synthesized viral RNAs (in PFUs per 1 µg T7 RNA), the titers of the viruses after transfection (P0) and one passage in RD cells (P1), the comparative plaque sizes (see also Fig. S3a), RT-PCR analysis of viral RNA isolated after three passages in RD cells, and the results of the competition assay (see also Fig. S3b). d, Analysis of relative IRES activities by dual-luciferase reporter assay in HEK293T cells. Schematic representation of the modified pSGDluc expression vector to measure initiation at the polyprotein AUG (left). Relative IRES activities normalized to cap-dependent signal and wt EV7 IRES activity (means ± s.d.; n = 3 biologically independent experiments) (right).
Fig. 3
Fig. 3. Timecourse of UP expression in EV7-infected cells.
a, Analysis of viral protein expression in RD cells infected with wt or mutant EV7 viruses. Cells were infected at an MOI of 50, harvested at 0–8 hpi as indicated, and accumulation of UP and virus structural protein VP3 was analyzed by western blotting with anti-UP and anti-VP3 antibodies. UP transiently expressed from a pCAG promoter in HeLa cells taken at 20 h post-transfection was used as a UP size control. b, Analysis of viral protein expression in RD cells infected with wt or mutant Strep-tagged EV7 viruses. Cells were infected at an MOI of 50, harvested at 0–8 hpi as indicated, and accumulation of Strep-tagged UP (StrUP) and VP3 was analyzed by western blotting with anti-Strep and anti-VP3 antibodies. StrUP transiently expressed from a pCAG promoter in HeLa cells taken at 20 h post-transfection was used as a StrUP size control. The experiments in (a-b) were independently repeated three times with similar results. c, One-step growth curves of rescued viruses. RD cells were infected with P1 stocks of wt or mutant viruses at an MOI of 1. Aliquots of the culture media were collected at 0, 3, 6, 9, 12 and 24 hpi, and the viral titer in the aliquots was analyzed via plaque assay on RD cells. The results of one out of two replicates are shown (see Fig. S10 for the repeat). d, Ribosome profiling of EV7-infected cells at 4 and 6 hpi. Ribo-Seq RPF densities in reads per million mapped reads (RPM) are shown with colors indicating the three phases relative to the main ORF (blue – phase 0, green – phase +1, orange – phase +2), each smoothed with a 3-codon sliding window. e, Mean ribosome density in the EV7 uORF and main ORF at 4 and 6 hpi, based on the in-phase Ribo-Seq density in each ORF (excluding the overlapping region; RPKM = reads per kilobase per million mapped reads).
Fig. 4
Fig. 4. Translation of the uORF in poliovirus PV1 and enterovirus EV-A71.
a, Schematic representation of the PV1 IRES dVI and uORF region with the uORF start and stop (orange) and main ORF start (blue) annotated. The UP amino acid sequence is shown in the shadowed inset with the predicted TM domain underlined. b, Ribosome profiling of PV1-infected cells at 4 and 6 hpi. Ribo-Seq RPF densities in reads per million mapped reads (RPM) are shown with colors indicating the three phases relative to the main ORF (blue – phase 0, green – phase +1, orange – phase +2), each smoothed with a 3-codon sliding window (see Fig. S12a for repeats). c, Mean ribosome density in the PV1 uORF and main ORF at 4 and 6 hpi, based on the in-phase Ribo-Seq density in each ORF (excluding the overlapping region; RPKM = reads per kilobase per million mapped reads). d, Analysis of viral protein expression in RD cells infected with wt or HA-tagged PV1 viruses. Cells were infected at an MOI of 50, harvested at 9 and 11 hpi, and accumulation of HA-tagged UP (HA-UP) and virus structural protein VP3 was analyzed by western blotting with anti-HA, anti-VP3 and anti-tubulin antibodies. HA-UP transiently expressed from a pCAG promoter in HeLa cells taken at 20 h post-transfection was used as a HA-UP size control. e, Schematic representation of the EV-A71 IRES dVI and uORF region with the uORF start and stop (orange) and main ORF start (blue) annotated. The UP amino acid sequence is shown in the shadowed inset with the predicted TM domain underlined. f, Analysis of protein expression in RD cells infected with enteroviruses EV-A71, EV7 or PV1. Cells were infected at an MOI of 20, harvested at 0–8 hpi as indicated, and expression of virus and host proteins was analyzed by western blotting with anti-VP3 and GAPDH antibodies. The experiments in (d,f) were independently repeated three times with similar results. g, Ribosome profiling of EV-A71-infected cells at 5 and 7.5 hpi (see Fig. S12b for repeats). h, Mean ribosome density in the EV-A71 uORF and main ORF at 5 and 7.5 hpi.
Fig. 5
Fig. 5. Analysis of EV7 infection in differentiated human intestinal organoids.
a, Schematic representation of production of differentiated intestinal organoids. Crypts are isolated from the terminal ileum intestinal region of patients and grown as undifferentiated organoid cultures (lower image, scale bar 100 µm). After differentiation, the organoids are split into monolayers and grown for 5 days in the presence of growth factors (upper image, scale bar 50 µm). b, Monolayers of differentiated organoid cultures were infected in triplicate with P1 stocks of wt or mutant viruses at MOI 10, washed twice, aliquots of culture media were collected at 0, 3, 6, 9, 12 and 24 hpi, and viral titer was analyzed via plaque assay on RD cells. The experiment was repeated for organoid cultures originating from two different patients (left and right graphs; means ± s.d.; *, ** p = 0.052, 0.00089 at 36 hpi and 0.0012, 0.046 at 48 hpi for patients 1 and 2 respectively). c, Representative confocal images of mock-infected and infected (EV7, EV7-PTC and EV7-Loop) organoid monolayers at 9 hpi, stained for enterovirus structural protein (VP3, green) or dsRNA (green), and nuclei (Hoechst, blue). Scale bar 50 µm. d, Representative images of mock-infected and infected (EV7, EV7-PTC and EV7-Loop) organoid monolayers at 9 and 24 hpi. Scale bar 50 µm. e, Virus titers normalized by virus protein (blue) or virus RNA (red) for infected differentiated organoid cultures at 36 and 48 hpi. f, Fold differences in virus titers after Triton X-100 treatment of clarified supernatants derived from infected differentiated organoid cultures. g, Fold differences in virus titers after Triton X-100 treatment of lysed cells from infected differentiated organoid cultures at 48 hpi. h, Membrane flotation assay. At 36 hpi, clarified supernatants from infected differentiated organoid cultures were spun in a 60-30-20-10% iodixanol gradient. Fifteen fractions were collected and virus titers determined on RD cells. Virus derived from infected RD cells was used as a control (green line). The density traces are shown in grey. Data represent two (c,d) or three (b,e-g) biologically independent experiments. In (b,e-g), p-values come from comparing the six mutant with three wt values in each group (two-tailed t-tests). See Table S3 for raw data (b,e-h).
Fig. 6
Fig. 6. Membrane association of UP and temporal analysis of uORF translation.
a, Fraction of non-neutralized EV7 in RD cell-derived virus and membrane fractions of flotated organoid-derived virus (from Fig. 5h). The membrane fractions for each flotated sample were assayed using (i) virus mixed with EV7 neutralization serum (left panel), (ii) cells pre-incubated with anti-DAF antibody (middle panel), and (iii) both methods simultaneously (right panel) (means ± s.d.; n = 4 biologically independent experiments; p-values come from comparing the 12 organoid-derived samples with the four RD cell-derived samples using two-tailed t-tests). See Table S3 for raw data. b, Representative confocal images of HeLa cells transfected with pCAG-UP, and the HeLa-UP cell line, stained for UP (green), ER (Calnexin, red) and nuclei (Hoechst, blue). The images are averaged single plane scans. Scale bar 10 µm. See Fig. S9 for lower magnification and pCAG control images. c, Fractionation analysis of HeLa cells. Cells were electroporated with pCAG-UP, fractionated, and whole cell lysate (WCL) and cytoplasmic (Cyto) and membrane (Mem) fractions analyzed by immunoblotting with antibodies to UP, tubulin, VDAC or calnexin as indicated. The experiments in (b-c) were independently repeated three times with similar results. d, Schematic of the modified pSGDluc expression vectors used to measure initiation at the polyprotein (ppORF, in blue) and upstream (uORF, in green) AUG codons. e, Analysis by dual-luciferase reporter assay in HeLa cells of relative IRES activities for ppORF and uORF expression, with and without T7-transcribed infectious EV7 RNA (infected and not infected, respectively). IRES activities were normalized to cap-dependent signal and presented as the ratio ppORF/uORF activity (means ± s.d.). n = 6 biologically independent experiments. Titers from the infected samples measured by plaque assay in RD cells are plotted on a log scale (dotted pink line). f, IRES activities for ppORF and uORF expression relative to cap-dependent expression (i.e. FFLuc/RLuc), with and without co-transfection of T7-transcribed infectious RNA. See Table S4 for raw data (e-f).

References

    1. Suresh S, Forgie S, Robinson J. Non-polio Enterovirus detection with acute flaccid paralysis: A systematic review. J Med Virol. 2017 doi: 10.1002/jmv.24933. - DOI - PubMed
    1. Bedard KM, Semler BL. Regulation of picornavirus gene expression. Microbes Infect. 2004;6:702–13. - PubMed
    1. Sweeney TR, Abaeva IS, Pestova TV, Hellen CUT. The mechanism of translation initiation on Type 1 picornavirus IRESs. EMBO J. 2014;33:76–92. - PMC - PubMed
    1. Pelletier J, Flynn ME, Kaplan G, Racaniello V, Sonenberg N. Mutational analysis of upstream AUG codons of poliovirus RNA. J Virol. 1988;62:4486–92. - PMC - PubMed
    1. Hellen CU, Pestova TV, Wimmer E. Effect of mutations downstream of the internal ribosome entry site on initiation of poliovirus protein synthesis. J Virol. 1994;68:6312–22. - PMC - PubMed

Publication types

MeSH terms