. 2018 Dec;564(7735):258-262.
doi: 10.1038/s41586-018-0740-8. Epub 2018 Nov 26.

Reward behaviour is regulated by the strength of hippocampus-nucleus accumbens synapses

Affiliations

Reward behaviour is regulated by the strength of hippocampus-nucleus accumbens synapses

Tara A LeGates et al. Nature. 2018 Dec.

Abstract

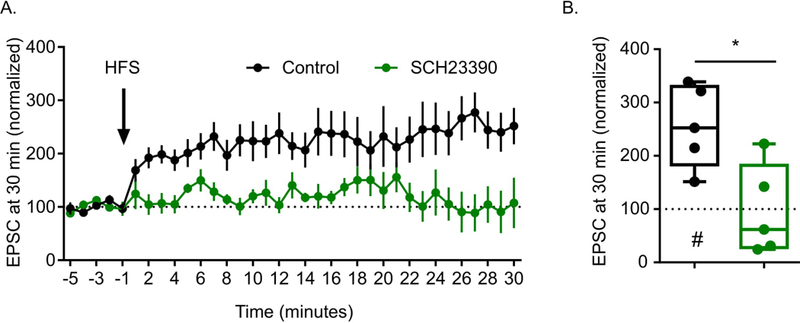
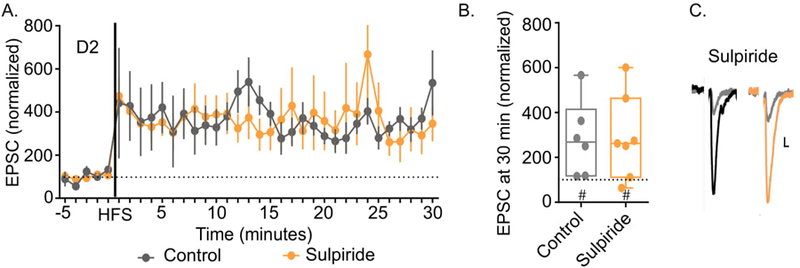
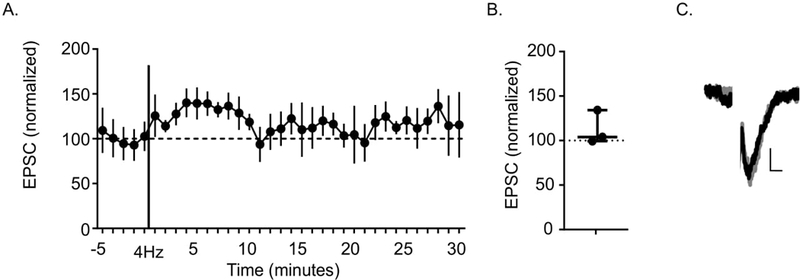
Reward drives motivated behaviours and is essential for survival, and therefore there is strong evolutionary pressure to retain contextual information about rewarding stimuli. This drive may be abnormally strong, such as in addiction, or weak, such as in depression, in which anhedonia (loss of pleasure in response to rewarding stimuli) is a prominent symptom. Hippocampal input to the shell of the nucleus accumbens (NAc) is important for driving NAc activity1,2 and activity-dependent modulation of the strength of this input may contribute to the proper regulation of goal-directed behaviours. However, there have been few robust descriptions of the mechanisms that underlie the induction or expression of long-term potentiation (LTP) at these synapses, and there is, to our knowledge, no evidence about whether such plasticity contributes to reward-related behaviour. Here we show that high-frequency activity induces LTP at hippocampus-NAc synapses in mice via canonical, but dopamine-independent, mechanisms. The induction of LTP at this synapse in vivo drives conditioned place preference, and activity at this synapse is required for conditioned place preference in response to a natural reward. Conversely, chronic stress, which induces anhedonia, decreases the strength of this synapse and impairs LTP, whereas antidepressant treatment is accompanied by a reversal of these stress-induced changes. We conclude that hippocampus-NAc synapses show activity-dependent plasticity and suggest that their strength may be critical for contextual reward behaviour.


Conflict of interest statement

The authors report no competing financial interest.

Figures

Extended Data Figure 1:
Extended Data Figure 1:. High frequency stimulation also induces presynaptic changes and uncovering of silent synapses.
A. HFS alters coefficient of variation (Friedman test and Dunn’s post hoc Q=19.95, p=0.0028, n=18 cells). Center values represent mean and error bars represent SEM. B. HFS stimulation decreases failure rate as revealed by (Two-tailed paired t-test: t=3.123, p=0.0066, n=17 cells). *** p<0.001, ** p<0.01, *p<0.05
Extended Data Figure 2:
Extended Data Figure 2:. Representative images of viral injection sites and expression
A. Low magnification image of YFP fluorescence in ventral hippocampus. B. Blue inset from A. C. Low magnification image showing YFP fluorescence in the NAc. Insets show overlap in labeling of D1R expression and YFP. This was repeated in mice used for optogenetic experiments. Scale bar indicates 100μM.
Extended Data Figure 3:
Extended Data Figure 3:. LTP at hippocampus-NAc synapses is not associated with a preferential insertion of GluA2-lacking AMPA receptors
A. Wash-in of NASPM after LTP induction does not alter EPSC amplitude. Center values represent mean and error bars represent SEM. B: Summary data from the last five minutes of recording (Two-tailed Mann Whitney: U=24, p>0.9999, n=7,7 mice; Two-tailed paired t-test baseline EPSC amplitude/30 minutes post HFS: Control: t=2.508, p=0.046, n=7 cells; NASPM: t=2.747, p=0.0226, n=10 cells). C. HFS does not alter rectification at positive holding potentials (Two-tailed Mann Whitney: U=12, p=0.7879,n=7,4 mice). Center values represent mean and error bars represent SEM. # indicates significant increase in EPSC amplitude above baseline revealed by paired t-test. For box plots, the line in the middle of the box is plotted at the median. The box extends from the 25th to 75th percentiles. Whiskers represent minimum and maximum.
Extended Data Figure 4:
Extended Data Figure 4:. D1 receptor signaling is required for LTP induction at non-specific NAc synapses.
A. Pre-incubation with D1 receptor antagonist SCH23390 blocks LTP induction in response to HFS. B. Summary data from the last 5 minutes of recording (Two-tailed Mann Whitney: U=2, p=0.0317, n=5 mice per group; #Two-tailed paired t-test baseline EPSC amplitude/30 minutes post HFS: Control: t=3.017, p=0.0393, n=5 cells; SCH: t=0.5016, p=0.6372, n=6 cells). LTP kinetic data are plotted in one minute bins. Center values represent mean and error bars represent SEM. For box plots, the line in the middle of the box is plotted at the median. The box extends from the 25th to 75th percentiles. Whiskers represent minimum and maximum.
Extended Data Figure 5:
Extended Data Figure 5:. D2 receptors are not required for LTP induction
A. Pre-incubation with D2-receptor antagonist sulpiride does not affect the ability to elicit LTP in response to HFS in D2RMSNs. B. Summary data from the last five minutes of recording (Two-tailed Mann Whitney: U=20, p=0.9452, n=6,7 mice #Two-tailed paired t-test baseline EPSC amplitude/30 minutes post HFS: Control: t=3.840, p=0.0121, n=6 cells; Sulpiride: t=4.246, p=0.0022, n=10 cells). C. Representative traces of EPSCs from control and sulpiride treated D2R-MSNs. # indicates significant increase in EPSC amplitude above baseline revealed by paired t-test. LTP kinetic data are plotted in one minute bins. Center values represent mean and error bars represent SEM. For box plots, the line in the middle of the box is plotted at the median. The box extends from the 25th to 75th percentiles. Whiskers represent minimum and maximum. Scale bar for representative traces indicates 10pA/10ms.
Extended Data Figure 6:
Extended Data Figure 6:. Collaterals from hippocampus-NAc projecting cells
Representative images of labeled hippocampal fibers. Hippocampal cells projecting to the NAc were labeled by injecting a retrograde virus expressing Cre recombinase into the shell of the NAc and a Cre dependent virus containing YFP in the ventral hippocampus. Some collaterals are visible in the amygdala as well as the prelimibic and infralimbic regions of the PFC. Right: 100× image showing labeling of fibers. Scalebars represent 50μm. AC represents anterior commissure. fmi represents the forceps minor of the corpus callosum. This was replicated in one other mouse.
Extended Data Figure 7:
Extended Data Figure 7:. High frequency stimulation does not alter locomotor activity
Distance travelled during the conditioning segment of the CPP paradigm. Data were normalized to the distance the mouse travelled during the ‘no stimulation’ portion of the test (Two-tailed Mann Whitney: U=43,p=0.8773, n=13,7 mice). The line in the middle of the box is plotted at the median. The box extends from the 25th to 75th percentiles. Whiskers represent minimum and maximum.
Extended Data Figure 8:
Extended Data Figure 8:. 4Hz stimulation does not induce LTP
A. 4Hz stimulation does not potentiate EPSCs. Data are plotted in one minute bins. Center values represent mean and error bars represent SEM. B. Summary data from the last five minutes of recording (Two-tailed paired t-test: t=1.171 df=2, p= 0.3621, n=3 cells). The line in the middle of the box is plotted at the median. The box extends from the 25th to 75th percentiles. Whiskers represent minimum and maximum. Scale bar for representative traces indicates 10pA/10ms.
Extended Data Figure 9:
Extended Data Figure 9:. High frequency stimulation induces c-Fos expression in the NAc shell
A. Representative images from NAc core and shell. Black/grey dots represent c-Fos positive cells. Scale bar indicates 50μm. B. 100Hz but not 4Hz stimulation increases c-Fos expression in the NAc shell (2-way ANOVA: F(2, 36) = 5.262, p=0.0099, n=9,5,7 mice).
Extended Data Figure 10:
Extended Data Figure 10:. Chronic stress leads to a preferential insertion of GluA2-lacking AMPA receptors in D2RMSNs.
A. Chronic stress does not alter subunit composition in D1R-MSNs (Two-tailed Mann Whitney of amplitude at +40mV: U=35, p=0.6665, n=6,7 mice). B. D2R-MSNs from mice exposed to chronic stress show inward rectification at positive membrane potentials (Two-tailed Mann Whitney of amplitude at +40mV: U=0, p=0.0006, n=6,7 mice C. NAPSM decreases EPSC amplitude in D2R-MSNs from mice exposed to chronic stress (Kruskal-Wallis test: H=7.423, p=0.0132, n=4 mice per group). D. Current/voltage relationships in D1R-MSNs remain unaffected by chronic stress or fluoxetine treatment (Kruskal-Wallis test with Dunn’s post hoc: H=0.9436, p=0.8149, n=5,5,5,4 mice). E. D2R-MSNs from mice exposed to chronic stress treated with chronic fluoxetine show a linear current/voltage relationship, similar to unstressed controls. Inward rectification is observed in D2R-MSNs from mice exposed to chronic stress alone or chronic stress with acute fluoxetine treatment (Kruskal-Wallis test with Dunn’s post hoc: H=31.42, p<0.0001, n=5,5,5,8 mice). The line in the middle of the box is plotted at the median. The box extends from the 25th to 75th percentiles. Whiskers represent minimum and maximum. Center values represent mean and error bars represent SEM. **** p<0.0001, ** p<0.01, *p<0.05.
Figure 1:
Figure 1:. Mechanisms underlying activity-dependent long term potentiation at hippocampal-NAc synapses
A. LTP of hippocampal-NAc eEPSCs is similar in D1- and D2-MSNs and does not alter PPR. B. Summary data from the last five minutes of recording. (#D1:t=2.624, p=0.0394, n=7 cells from 7 mice; D2:t=3.586, p=0.0059, n=10 cells from 10 mice). C. Representative traces of EPSCs before/after HFS. Grey shading represents individual traces. Black represents the average. D. pHFS induces LTP of light-evoked EPSCs. E. Summary data from the last five minutes of recording. (# t=3.337,p=0.0157,n=7 cells/7 mice). F. Representative traces of pEPSCs before/after HFS. Grey shading represents individual traces. Blue represents the average. G. pHFS potentiates both electrically- and optogenetically-evoked EPSCs. H. Summary data from the last five minutes of recording (#Two-tailed paired Wilcoxon to compare baseline to response at 30 minutes: W=21,p=0.0313,n=3 cells/3 mice). I. Representative traces from electrical- and optogenetically-evoked EPSCs before/after HFS. J. Pre-incubation with APV, KN62, or chelation of intracellular Ca2+ with BAPTA prevents LTP induction by HFS. K. Summary data from the last five minutes of recording (APV/ControlAPV: *U=1, p= 0.0317, n=3,5 mice # ControlAPV: t=2.865,p=0.0457,n=5 cells; APV: t=1.729,p=0.1589,n=5 cells; BAPTA/ControlBAPTA: *U=5,p=0.0221,n=7,6 mice # ControlBAPTA: t=3.149,p=0.0199,n= 7 cells BAPTA: t=1.172,p=0.2942,n=6 cells; KN62/ControlKN62: **U=6,p=0.0089,n=7,8 mice # ControlKN62: t=2.526,p=0.0449,n=7 cells KN62: t=0.4919,p=0.6378,n= 8 cells). L. Representative traces of EPSCs from control and APV, BAPTA, and KN62 treated cells. M. Pre-incubation with SCH 23390 or Rp-cAMPs does not affect LTP induction in D1R-MSNs. N. Summary data from the last five minutes of recording (SCH/ControlSCH: U=22,p=0.6070,n=6,9 mice # ControlSCH: t=5.658,p=0.0013,n=7 cells SCH: t=2.914,p=0.0195,n=9 cells; Rp/ControlRp: U=13,p=0.7922,n=5,6 mice # ControlRp: t=2.611,p=0.476,n=6 cells Rp: t=2.337,p=0.0476,n=9 cells). O. Representative traces of EPSCs from control, SCH23390, and Rp-cAMPs treated D1R-MSNs. *indicates differences between treatment and control as revealed by two-tailed Mann-Whitney U. # indicates significant increase in EPSC amplitude above baseline revealed by two-tailed paired t-test. LTP kinetics are plotted in one-minute bins. Center values represent mean and error bars represent SEM. For box plots, the middle line is plotted at the median. The box extends from 25th-75th percentiles. Whiskers represent minimum and maximum. Scale bar indicates 10pA/10ms.
Figure 2:
Figure 2:. In vivo high frequency stimulation influences reward related behavior and NAc activity
A. Representative behavioral trace after 100Hz conditioning. B. Conditioning with 100Hz induces CPP in ChR-expressing mice (Two-way RM ANOVA with Sidak’s post-hoc F(1, 33) = 5.155,p=0.0298,n=21,14 mice). C. Representative behavioral trace after 4Hz conditioning. D. Conditioning with 4Hz light stimulation is not sufficient to induce CPP (Two-way RM ANOVA: F(1, 14) = 0.08221,p=0.7785,n=11,5 mice). E. pHFS induces LTP of vHipp-NAc synapses in vivo. Data are plotted in one minute bins. Center values represent mean and error bars represent SEM. F. Summary data from the last five minutes of recording (Kruskal-Wallis test with Dunn’s multiple comparison post hoc: H= 34.58,p<0.0001,n=40, 24, 25 units from 4 mice). G. Representative traces of light-evoked LFPs. Scale bar represents 0.01mV/10ms. H. Representative behavioral trace after social interaction conditioning. M: location of the mouse during conditioning. I. vHipp-NAc silencing during conditioning blocks social interaction-induced CPP (Two-way RM ANOVA with Sidak’s post-hoc: F(1,20)=4.529,p=0.0459,n=12,10). J. vHipp-NAc silencing does not disrupt social interaction (Two-tailed Mann Whitney: U=64,p=0.5671,n= 15,10 mice). # One sample Wilcoxon shows significant interaction ratios for both groups (NpHR:W=114,p=0.0003,n=15 mice; YFP: W=49,p=0.0098,n=10 mice). For box plots, the middle line is plotted at the median. The box extends from 25th-75th percentiles. Whiskers represent minimum and maximum. **** p<0.0001, ** p<0.01, *p<0.05
Figure 3:
Figure 3:. Chronic multimodal stress weakens excitatory hippocampal input onto D1R-MSNs.
A. Chronic stress induces loss of sucrose preference (Two-tailed paired t-test:t=5.056,p=0.0039,n=6 mice) Dotted line represents criteria for anhedonia. B. Representative traces of EPSCs at −70mV and +40mV from control mice and mice exposed to chronic stress. C. Chronic stress decreases AMPA:NMDA ratio (two-tailed t-test: t=2.422,p=0.0322,n=6,8 mice). D. D1R-MSNs from mice exposed to chronic stress show a deficit LTP induction. E. Representative traces of EPSCs mice exposed to chronic stress and controls. F. Chronic stress has no effect on LTP in D2R-MSNs. G. Summary data from the last five minutes of recording (*Two-tailed Mann Whitney: U=3, p=0.0109, n=8,5 mice; #Two-tailed paired t-test baseline EPSC amplitude/30 minutes post HFS: D1Control:t=3.787, p=0.0068, n=8 cells; D1Stress:t=1.222, p=0.2564, n=9 cells; D2Control: t=3.854, p=0.012, n=6 cells; D2Stress: t=3.164, p=0.0341, n=5 cells). H. Chronic stress abolishes pHFS-induced CPP (RM-ANOVA with Tukey post hoc: F(2.109, 10.55) = 5.551, p=0.0215, n= 6 mice). LTP kinetics are plotted in one-minute bins. Center values represent mean and error bars represent SEM. For box plots, the middle line is plotted at the median. The box extends from 25th-75th percentiles. Whiskers represent minimum and maximum. Scale bar indicates 10pA/10ms.
Figure 4:
Figure 4:. Antidepressant treatment rescues synaptic weakening induced by chronic stress
A. Chronic fluoxetine restores normal sucrose preference (One-way ANOVA Holm-Sidak’s post-hoc F=36.38, p <0.0001, n=12,12,4,6 mice). Dotted line represents anhedonia criteria. B. Chronic fluoxetine restores CPP (Two-way RM ANOVA with Sidak’s post-hoc F(2,15)=7.293, p=0.0061, n=6 mice). C. Chronic fluoxetine restores stress-induced decrease in AMPA:NMDA ratio in D1-MSNs(ANOVA with Holm-Sidak’s post-hoc D1: F=7.309, p= 0.0019, n=6,4,5,8 mice). D. Representative traces of EPSCs at −70mV and +40mV. E. Chronic fluoxetine restores LTP deficit induced by chronic stress. F. Summary data from the last five minutes of recording (*Kruskal-Wallis test with Dunn’s post-hoc: H=18.46,p= 0.0004,n=5,8,6,7 mice; #Two-tailed paired t-test baseline EPSC amplitude/30 minutes postHFS: D1Control: t=4.540,p=0.0027,n=8 cells, D1Stress: t=0.2615,p=0.8012,n=8 cells, D1Acute:t=4.109,p=0.0093,n=6 cells, D1Chronic: t=2.816,p=0.0305,n=7 cells). G. Representative traces of EPSCs before (grey) and after HFS (color). # indicates significant increase in EPSC amplitude above baseline revealed by paired t-test. LTP kinetics are plotted in one-minute bins. Center values represent mean and error bars represent SEM. For box plots, the middle line is plotted at the median. The box extends from 25th-75th percentiles. Whiskers represent minimum and maximum. *** p<0.001, ** p<0.01, *p<0.05 Scale bar indicates 10pA/10ms.

Comment in

  • When remembering is rewarding.
    Bray N. Bray N. Nat Rev Neurosci. 2019 Feb;20(2):68-69. doi: 10.1038/s41583-018-0110-4. Nat Rev Neurosci. 2019. PMID: 30523294 No abstract available.

References

    1. Goto Y & O’Donnell P Synchronous activity in the hippocampus and nucleus accumbens in vivo. J. Neurosci. 21, 1–5 (2001). - PMC - PubMed
    1. O’Donnell P & Grace AA Synaptic interactions among excitatory afferents to nucleus accumbens neurons: hippocampal gating of prefrontal cortical input. J. Neurosci. 15, 3622–3639 (1995). - PMC - PubMed
    1. Freyja Ólafsdóttir H, Barry C, Saleem AB, Hassabis D & Spiers HJ Hippocampal place cells construct reward related sequences through unexplored space. Elife 4, 1–17 (2015). - PMC - PubMed
    1. Tryon VL et al. Hippocampal neural activity reflects the economy of choices during goal-directed navigation. Hippocampus 27, 743–758 (2017). - PMC - PubMed
    1. Gauthier JL & Tank DW A Dedicated Population for Reward Coding in the Hippocampus. Neuron 99, 179–193 (2018). - PMC - PubMed

Publication types

LinkOut - more resources