. 2018 Nov 26;7(11):92.
doi: 10.1038/s41389-018-0103-1.

CBX2 identified as driver of anoikis escape and dissemination in high grade serous ovarian cancer

Affiliations

CBX2 identified as driver of anoikis escape and dissemination in high grade serous ovarian cancer

Lindsay J Wheeler et al. Oncogenesis. .

Abstract

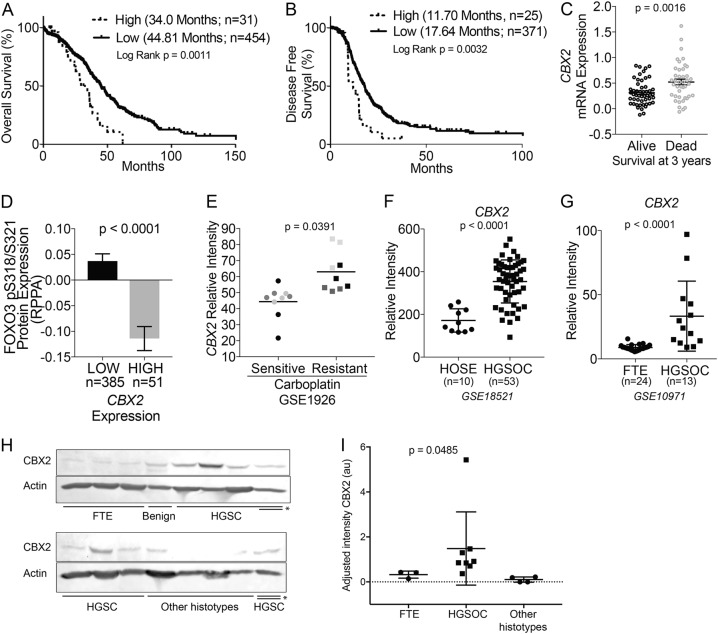
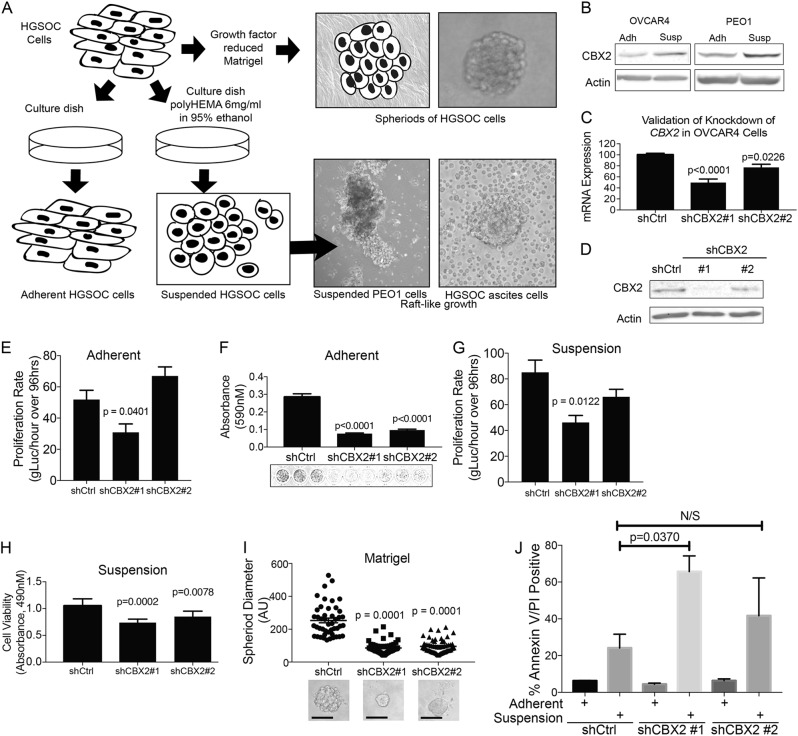
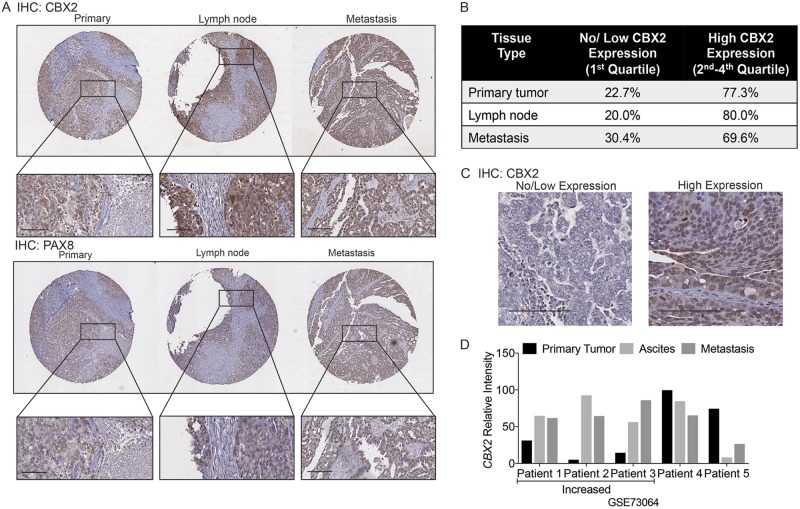
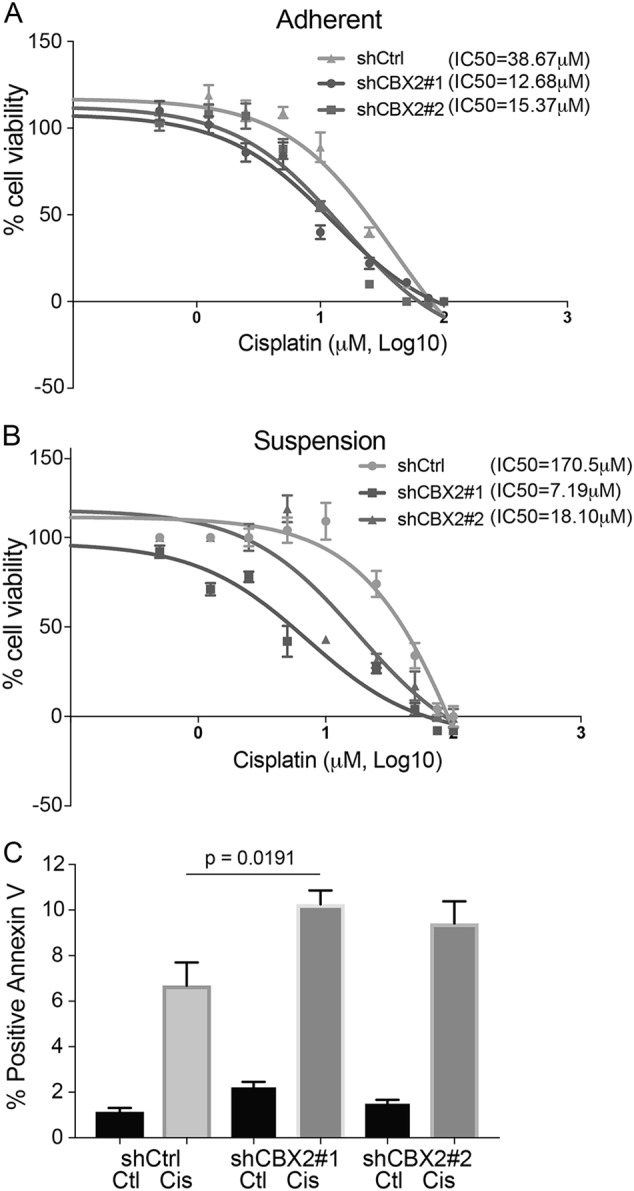
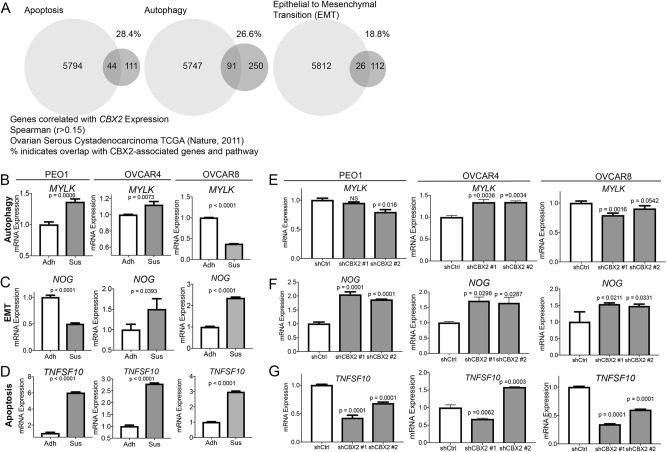
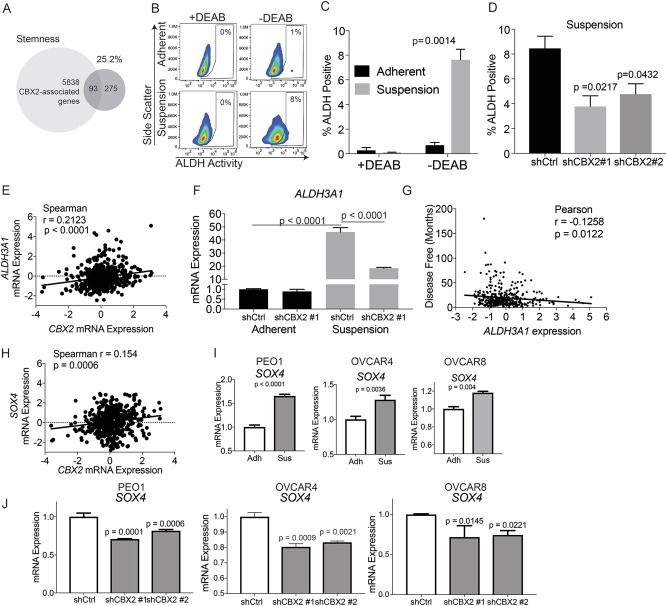
High grade serous ovarian carcinoma (HGSOC) is often diagnosed at an advanced stage. Chromobox 2 (CBX2), a polycomb repressor complex subunit, plays an oncogenic role in other cancers, but little is known about its role in HGSOC. We hypothesize that CBX2 upregulation promotes HGSOC via induction of a stem-like transcriptional profile and inhibition of anoikis. Examination of Gene Expression Omnibus (GEO) datasets and The Cancer Genome Atlas (TCGA) established that increased CBX2 expression conveyed chemoresistance and worse disease-free and overall survival. In primary HGSOC tumors, we observed CBX2 expression was significantly elevated compared to benign counterparts. In HGSOC cell lines, forced suspension promoted CBX2 expression. Subsequently, CBX2 knockdown inhibited anchorage-independent proliferation and potentiated anoikis-dependent apoptosis. Furthermore, CBX2 knockdown re-sensitized cells to platinum-based chemotherapy. Forced suspension promoted increased ALDH activity and ALDH3A1 expression and CBX2 knockdown led to a decrease in both ALDH activity and ALDH3A1 expression. Investigation of CBX2 expression on a HGSOC tissue microarray revealed CBX2 expression was apparent in both primary and metastatic tissues. CBX2 is an important regulator of stem-ness, anoikis escape, HGSOC dissemination, and chemoresistance and potentially serves as a novel therapeutic target.


Conflict of interest statement

The authors declare that they have no conflict of interest.

Figures

Fig. 1
Fig. 1. CBX2 is overexpressed in high grade serous carcinoma and portends poor prognosis.
a Overall survival analysis comparing expression of CBX2 (High = mRNA expression > 1.5 standard deviation; Low = SD < 1.5(=)). High (n = 31) vs. Low (n = 454) CBX2 expression (mean survival 34.0 months vs. 44.81 months, Log Rank p = 0.0011). b Same as (a), disease-free survival analysis, again comparing upregulation of CBX2, defined as above (High n = 25, Low n = 371). Increased expression of CBX2 was associated with statistically significant decreased disease-free survival (11.70 months vs. 17.64 months, Log Rank p = 0.0032). Number of patients differ from (a) due to available data within TCGA. c Examination of CBX2 mRNA expression in HGSOC patients alive (n = 51) and dead (n = 42) at 3 years after diagnosis. Data obtained from HGSOC Tothill Cohort. Statistical test = two-sided t-test, F test p = 0.0057 d Correlation of CBX2 expression with FOXO3_PS318/321 in TCGA (“Provisional data” with RPPA data, n = 435) tumors (High = upper quartile and Low = bottom three quartiles). Statistical test = two-sided t-test, F test p < 0.0001. e Bioinformatic analysis evaluating relative intensity of CBX2 in high grade serous ovarian carcinoma (HGSOC) cases described as platinum sensitive (n = 3) or resistant (n = 3). Each tumor (color-coded) was examined in triplicate. Statistical test examined average CBX2 intensity for each tumor (GSE1926; one-sided t-test p = 0.0391, F test p = 0.29). f Relative intensity of CBX2 in benign human ovarian surface epithelium (HOSE, n = 10) compared to HGSOC, n = 53 (GSE18521; t-test p < 0.0001, F test p < 0.0001). g Relative intensity of CBX2 in fallopian tube epithelium (FTE, n = 24) compared to HGSOC, n = 13 (GSE10971; two-sided t-test p < 0.0001, F test p < 0.0001). h Protein lysates generated from the primary tissue of FTE, HGSOC, and mixed histotypes. Protein utilized for immunoblot against CBX2. (beta-actin = loading control) i Densitometric analysis of immunoblots. Intensities were normalized between immunoblot by indicated (*) sample (FTE vs. HGSOC, one-sided Rank Sum p = 0.0333)
Fig. 2
Fig. 2. Inhibition of CBX2 impairs HGSOC cell proliferation.
a Model describing basic protocol for establishing adherent, suspension, and spheroid growth environments. For adherent and suspension, two verified high grade serous ovarian carcinoma cell lines were initially grown on tissue culture plastic, then distributed to normal tissue culture dishes (adherent) and polyHEMA coated culture dish (suspension) growth environments. Distributed at 1:3 or 1:5 ratio to account for forced suspension induced cell death. Photographs show PEO1 cells after 7 days in suspension (left) and HGSOC cells directly derived from patient ascites. For spheroid formation, cells were grown in 3D in Matrigel for 12 days. A representative image of a resulting spheroid is shown at upper right. b Immunoblots against CBX2 protein from OVCAR4, and PEO1 cells grown in adherent and suspension settings (described in (a)) over 7 days. c RT-qPCR for CBX2 in OVCAR4 cells transduced with small hairpin RNA (shRNA) specific for CBX2. Representative mRNA expression of CBX2 in shControl, shCBX2#1, and shCBX2#2. Statistical test = ANOVA. d Immunoblots against CBX2 protein derived from OVCAR4 shControl, shCBX2#1, and shCBX2#2 transduced cells (beta-actin = loading control). e Proliferation assay of OVCAR4 cells with CBX2 knockdown and shControl, grown in adherent setting (tissue culture plastic) over 96 h, evaluated using gLuc activity. Statistical test = ANOVA. f Same as (e), crystal violet staining and subsequent measurement of absorbance at 590 nm. Images of representative of stained cells from shControl, shCBX2#1, and shCBX2#2. Statistical test = ANOVA. g Proliferation assay of OVCAR4 cells with CBX2 knockdown and shControl, grown in suspension setting (poly-HEMA coated tissue culture plastic) over 96 h, evaluated using gLuc activity. Statistical test = ANOVA. h Same as (g), but cell viability was assessed via MTT after 96 h. Statistical test = ANOVA. i OVCAR4 cell lines (shControl, shCBX2 #1 and #2) grown in 3D using Matrigel over 12 days, leading to spheroid growth. Representative images of transduced OVCAR4 cells below. Scale bar = 100 μm. Spheroids measured across horizontal diameter. Diameter mean calculated from measurements of 50 spheroids per cell type. Statistical test = ANOVA. j OVCAR4 cells with CBX2 knockdown and shControl grown in adherent or suspension. Cells were subjected to AnnexinV/PI apoptosis assay. Statistical test = two-sided t-test, F test p = 0.9291. Error bars = S.E.M.
Fig. 3
Fig. 3. CBX2 expressed in advanced HGSOC.
a Immunohistochemistry (IHC) against CBX2 and PAX8 utilizing a HGSOC tissue microarray (TMA) of 24 matched patient samples. Representative images of matched patient samples shown. Initial images shown at 3×, inset of images at 18×. Scale bar = 100 μm. b TMA analyzed using PAX8 staining a control for tumor area followed by analysis with Image Scope software to determine relative CBX2 tumor-associated intensity. Level of expression divided into quartiles. Breakdown of samples into 1st quartile (low or no expression) compared to 2nd–4th quartiles (moderate or high expression). Analysis by two board-certified pathologists (authors: M.D.P. and A.A.B.) confirmed Aperio findings. Values displayed in table, CBX2 expression seems to be consistent between tissue types. c Representative images of “High” and “No/Low” CBX2 expression. Scale bar = 100 μm. d Bioinformatic analysis evaluating relative intensity of CBX2 in high grade serous ovarian carcinoma (HGSOC) cases with matched primary tumor (black bars), ascites-associated tumor cells (Ascites, light gray bars), and distant metastasis (dark gray bars) (n = 5, GSE73064)
Fig. 4
Fig. 4. Loss of CBX2 sensitizes HGSOC to chemotherapy.
a OVCAR4 shControl, shCBX2#1, and shCBX2#2 in 96-well plates treated over 24 h with increasing dose of cisplatin (0.5–100 µM). Percent cell viability was measured using the MTT assay and the half maximal inhibitory concentration (IC50) calculated. b Similarly to (a), OVCAR4 knockdown cell lines were grown in low adherent 96-well plates (forced suspension) and treated with increasing doses of cisplatin over 24 h and percent cell viability measured with MTT for calculation of IC50. c Annexin/V apoptosis assay of OVCAR4 cells grown in adherent setting with shControl, shCBX2#1 or #2 treated with cisplatin (10 µM) compared to untreated control. Percent Annexin positive cells are shown. Statistical test = ANOVA. Error bars = S.E.M.
Fig. 5
Fig. 5. Correlation of CBX2 expression and autophagy, apoptosis, and EMT.
Utilizing the TCGA (HGSOC, Nature, 2011) dataset, CBX2 expression was correlated to mRNA expression of all genes and 5838 genes (CBX2-associated genes) were identified to have a Spearman correlation of greater than r = 0.15. a The 5838 genes were cross-referenced with published gene sets for “Apoptosis”, “Autophagy”, and “Epithelial to Mesenchymal Transition (EMT).” Percentage indicates overlap with gene lists. PEO1, OVCAR4, and OVCAR8 cells were grown in adherent (Adh) or suspension (Sus) for 7 days, RNA was extracted, and used for RT-qPCR against MYLK (b), NOG (c), and TNFSF10 (d). Statistical test = two-sided t-test. shControl and shCBX2 #1 and 2 PEO1, OVCAR4, and OVCAR8 cells were grown in suspension, RNA was extracted, and used for RT-qPCR against MYLK (e), NOG (f), and TNFSF10 (g). Statistical test = ANOVA. Error bars = S.E.M.
Fig. 6
Fig. 6. Inhibition of CBX2 decreases stemness.
a CBX2-associated genes were cross-referenced with a gene set for stemness. Percentage indicates overlap of stemness gene set with CBX2-associated genes. b OVCAR4 cells grown in adherent and suspended settings for 7 days. Aldefluor assay and flow cytometry were utilized to determine the percentage of cells that were positive for aldehyde dehydrogenase (ALDH), a marker of stemness. Diethylaminobenzaldehyde (DEAB), a potent ALDH inhibitor, prevented the increase in ALDH activity and served as negative control (left). c As above, OVCAR4 cells grown in adherent and suspended settings for 7 days. Bar graph compares the percentage of cells ALDH positive control (+DEAB) to cells without DEAB (experimental) in adherent and suspended settings. Statistical test = two-sided t-test. F Test p = 0.1136. d OVCAR4 cells with shControl, shCBX2#1 and #2 cultured in suspension over 7 days. Aldefluor assay and flow cytometry again utilized to determine the percentage of cells ALDH positive. Statistical test = two-sided t-test. F-test p = 0.83 e Utilizing the TCGA (HGSOC, Nature, 2011, n = 489) dataset, a scatter plot CBX2 expression was correlated to ALDH3A1 expression. Spearman correlation r = 0.2123 and p-value < 0.0001. f RT-qPCR of ALDH3A1 in OVCAR4 cells cultured in adherent and suspension conditions with CBX2 knockdown (shCBX2 #1). Statistical test = ANOVA. g Scatter plot of ALDH3A1 expression (x-axis, Z-score) compared to disease-free survival (y-axis, months). Pearson’s correlation r = −0.1258 and p-value = 0.0122. h Utilizing the TCGA (HGSOC, Nature, 2011, n = 489) dataset, a scatter plot CBX2 expression was correlated to SOX4 expression. Spearman correlation r = 0.154 and p-value = 0.0006. i PEO1, OVCAR4, and OVCAR8 cells grown in adherent (Adh) or suspension (Sus) settings for 7 days. RNA was extracted, and used for RT-qPCR against SOX4. Statistical test = two-sided t-test. Experiment performed in technical triplicates and biological duplicate. j shControl and shCBX2 #1 and #2 PEO1, OVCAR4, and OVCAR8 were cultured in suspension conditions, RNA was extracted and used for RT-qPCR against SOX4. Experiment performed in technical triplicates and biological duplicate. Statistical test = ANOVA. Error bars = S.E.M.

Similar articles

Cited by

References

    1. Jayson GC, Kohn EC, Kitchener HC, Ledermann JA. Ovarian cancer. Lancet. 2014;384:1376–1388. doi: 10.1016/S0140-6736(13)62146-7. - DOI - PubMed
    1. Siegel RL, Miller KD, Jemal A. Cancer statistics, 2018. CA Cancer J. Clin. 2018;68:7–30. doi: 10.3322/caac.21442. - DOI - PubMed
    1. Kuhn E, et al. TP53 mutations in serous tubal intraepithelial carcinoma and concurrent pelvic high-grade serous carcinoma—evidence supporting the clonal relationship of the two lesions. J. Pathol. 2012;226:421–426. doi: 10.1002/path.3023. - DOI - PMC - PubMed
    1. Labidi-Galy SI, et al. High grade serous ovarian carcinomas originate in the fallopian tube. Nat. Commun. 2017;8:1093. doi: 10.1038/s41467-017-00962-1. - DOI - PMC - PubMed
    1. Lee Y, et al. A candidate precursor to serous carcinoma that originates in the distal fallopian tube. J. Pathol. 2007;211:26–35. doi: 10.1002/path.2091. - DOI - PubMed