. 2018 Nov 26;8(1):17383.
doi: 10.1038/s41598-018-35679-8.

High glycolytic activity of tumor cells leads to underestimation of electron transport system capacity when mitochondrial ATP synthase is inhibited

Affiliations

High glycolytic activity of tumor cells leads to underestimation of electron transport system capacity when mitochondrial ATP synthase is inhibited

Juliana S Ruas et al. Sci Rep. .

Abstract

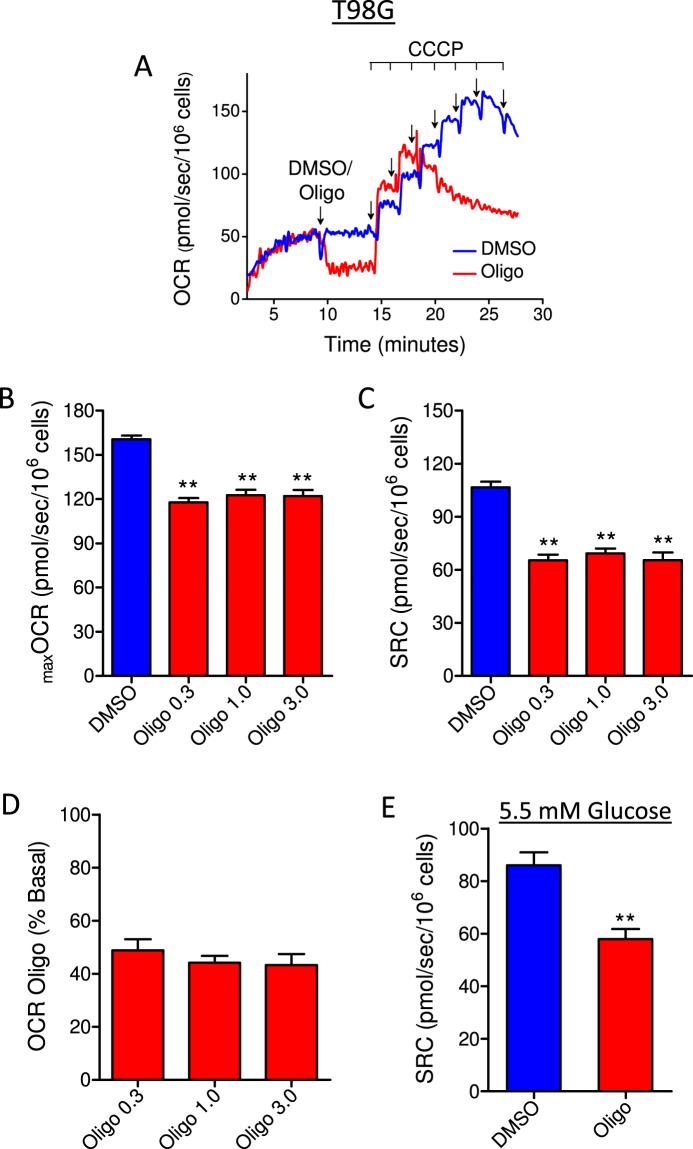
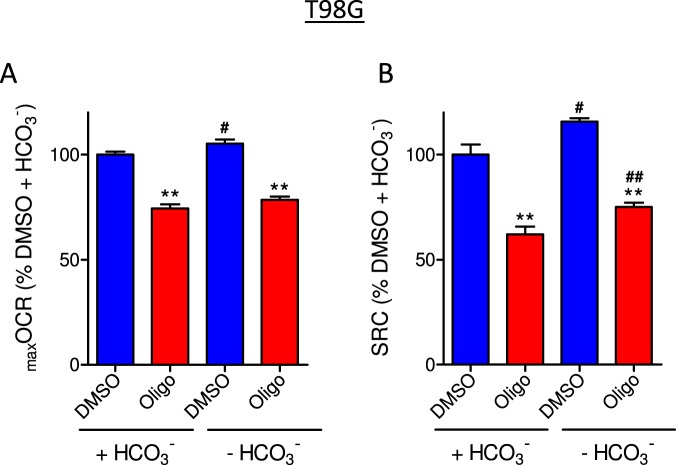
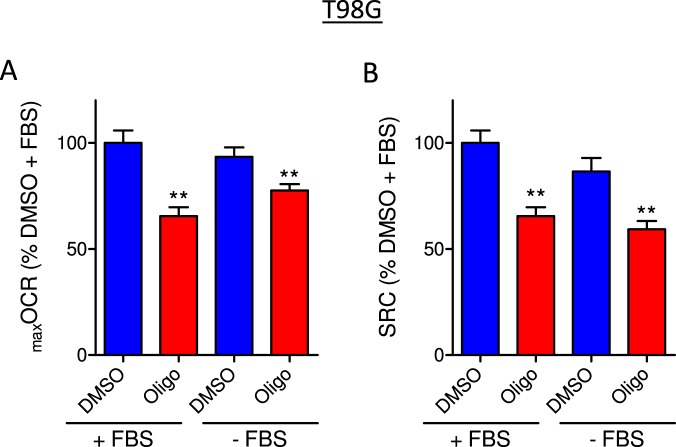
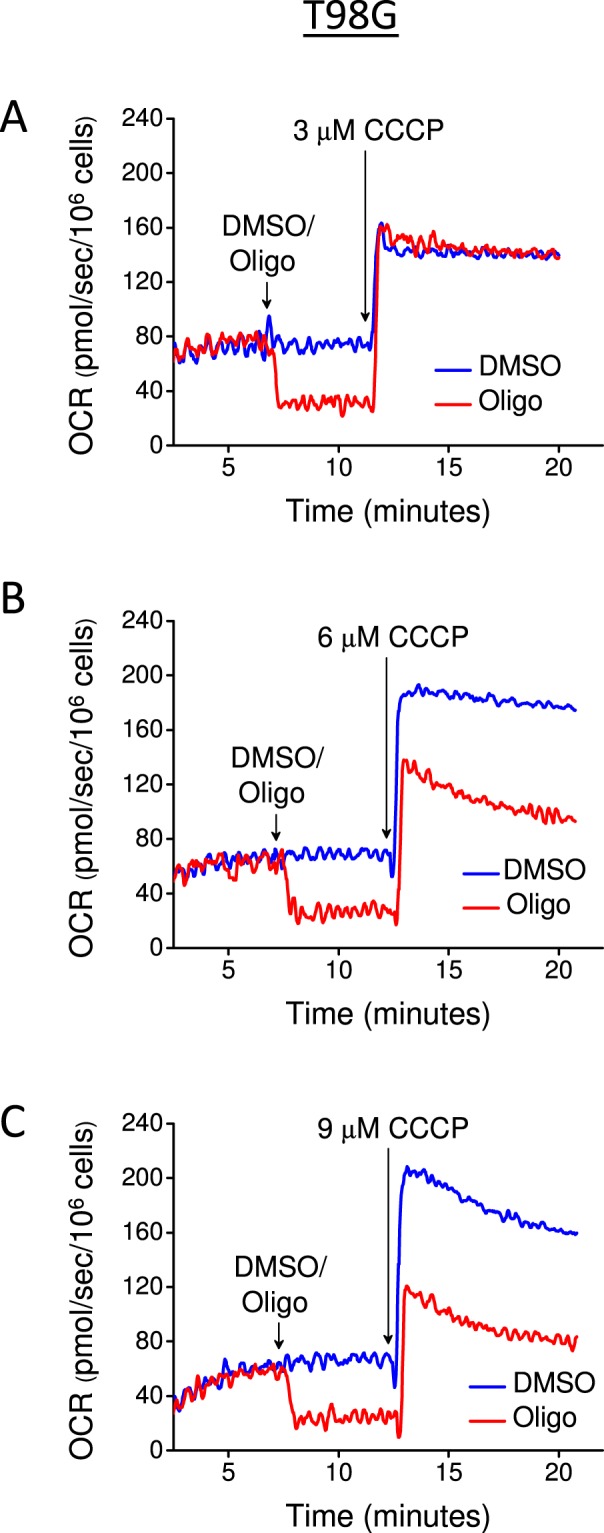
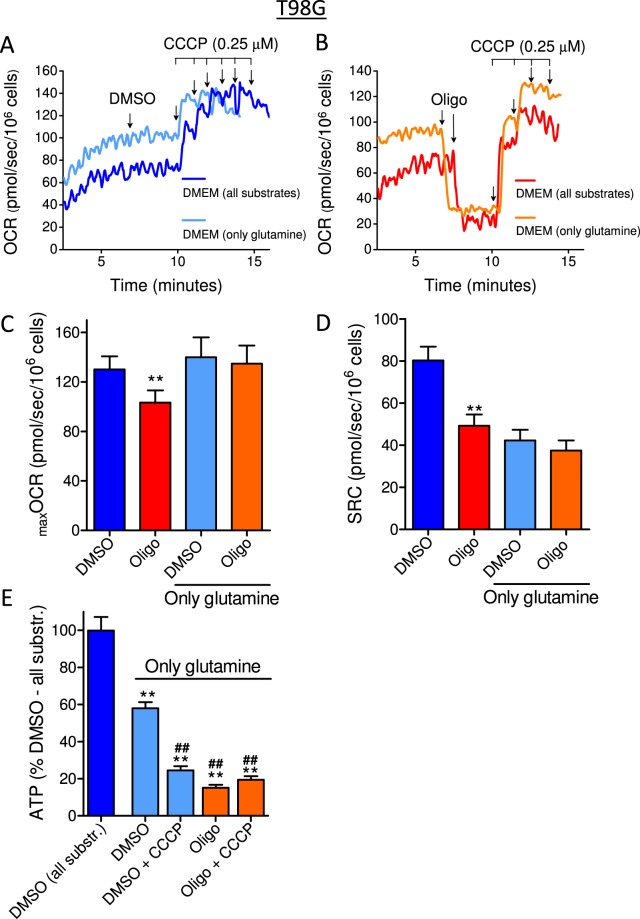
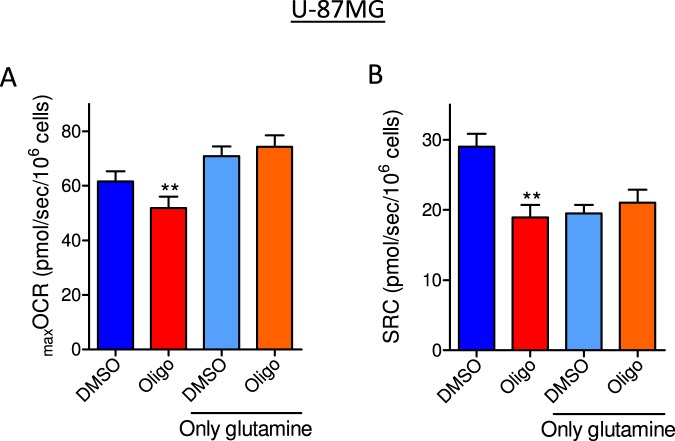
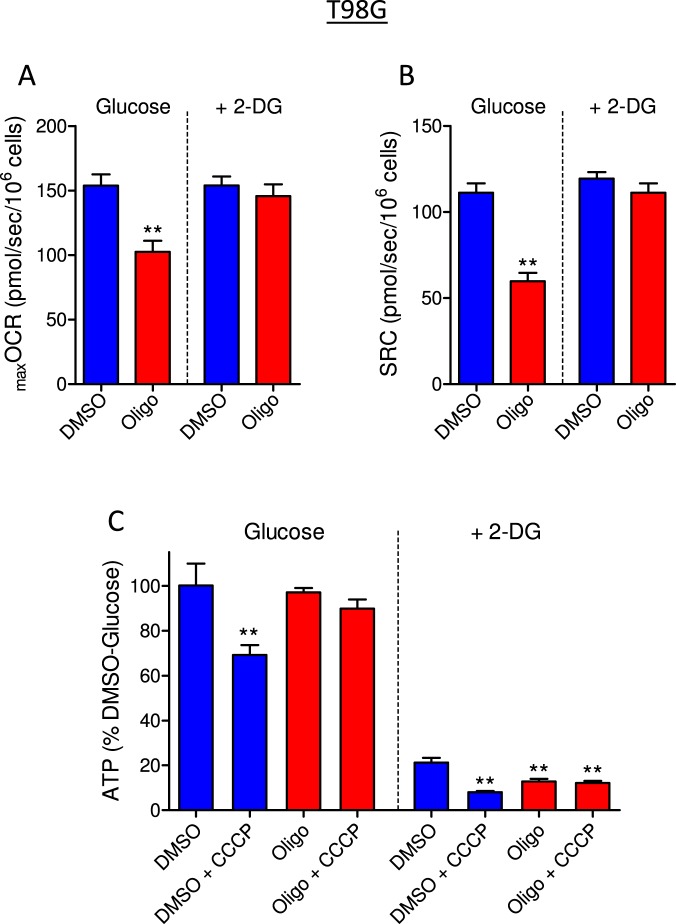
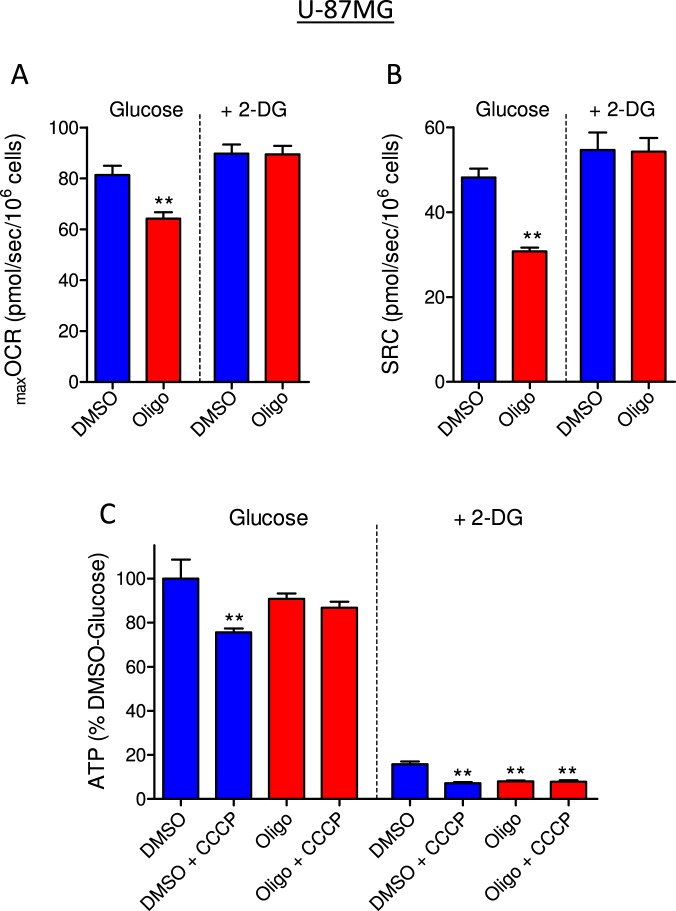
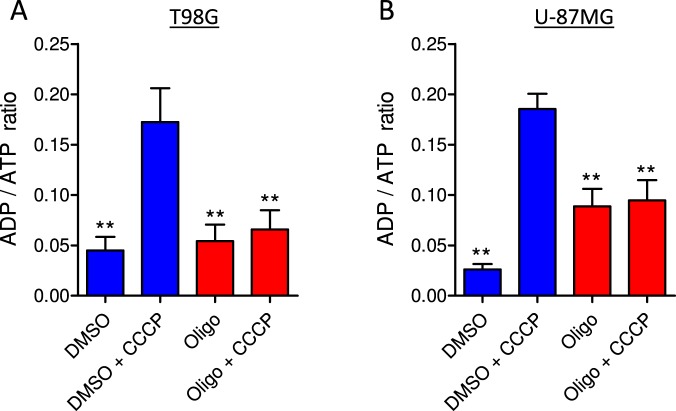
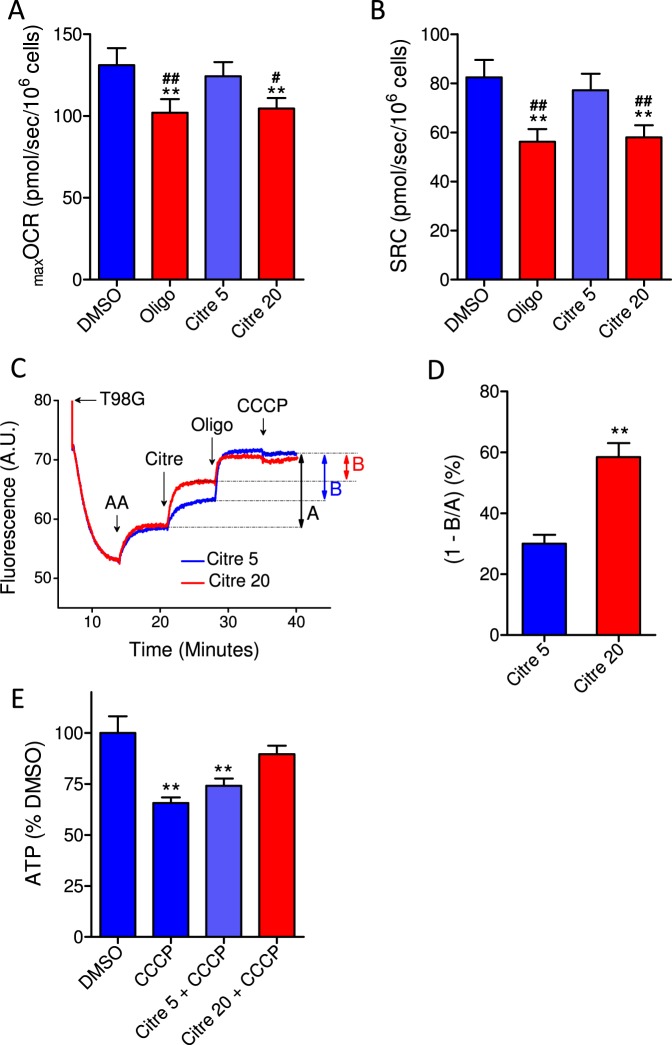
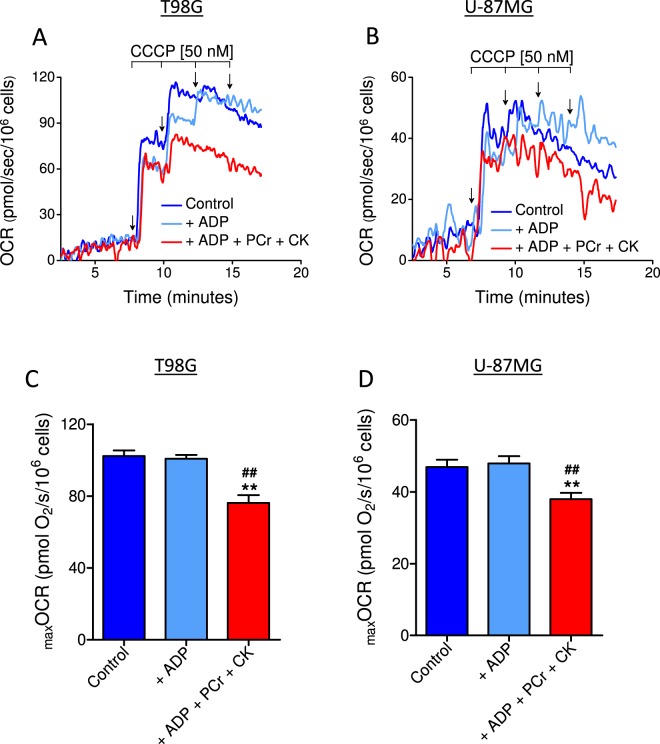
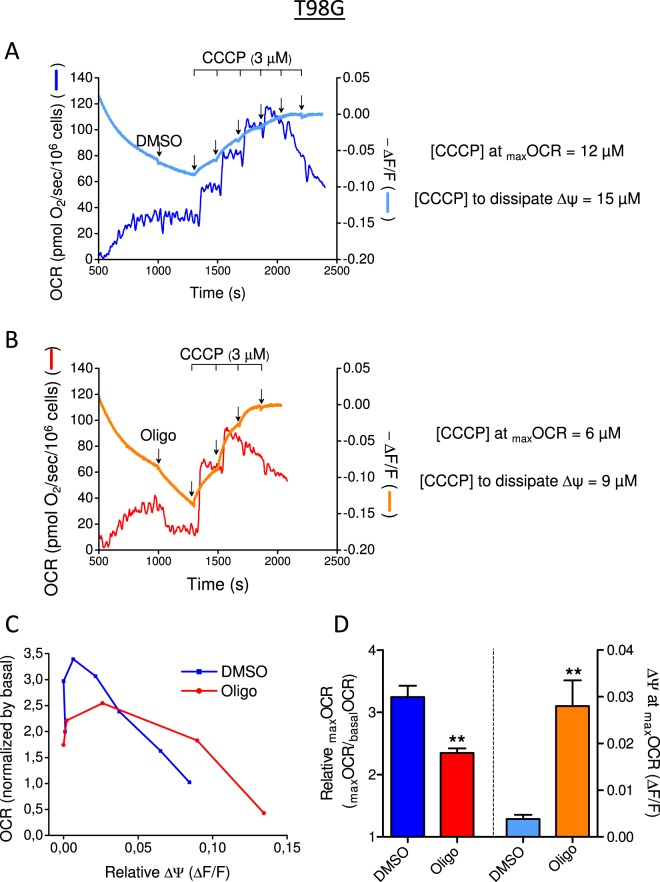
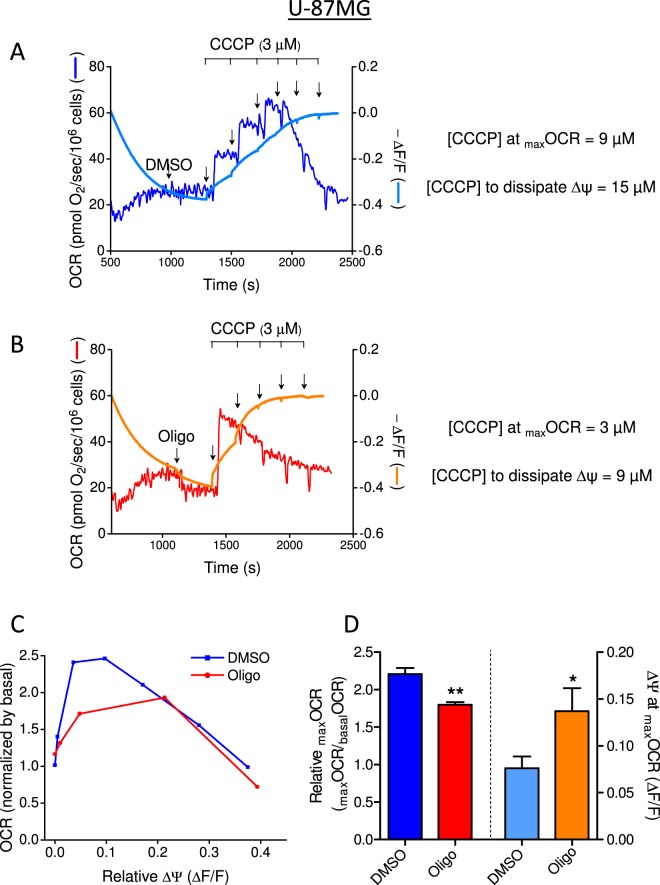
This study sought to elucidate how oligomycin, an ATP synthase blocker, leads to underestimation of maximal oxygen consumption rate (maxOCR) and spare respiratory capacity (SRC) in tumor cells. T98G and U-87MG glioma cells were titrated with the protonophore CCCP to induce maxOCR. The presence of oligomycin (0.3-3.0 µg/mL) led to underestimation of maxOCR and a consequent decrease in SRC values of between 25% and 40% in medium containing 5.5 or 11 mM glucose. The inhibitory effect of oligomycin on CCCP-induced maxOCR did not occur when glutamine was the metabolic substrate or when the glycolytic inhibitor 2-deoxyglucose was present. ATP levels were reduced and ADP/ATP ratios increased in cells treated with CCCP, but these changes were minimized when oligomycin was used to inhibit reverse activity of ATP synthase. Exposing digitonin-permeabilized cells to exogenous ATP, but not ADP, resulted in partial inhibition of CCCP-induced maxOCR. We conclude that underestimation of maxOCR and SRC in tumor cells when ATP synthase is inhibited is associated with high glycolytic activity and that the glycolytic ATP yield may have an inhibitory effect on the metabolism of respiratory substrates and cytochrome c oxidase activity. Under CCCP-induced maxOCR, oligomycin preserves intracellular ATP by inhibiting ATP synthase reverse activity.


Conflict of interest statement

The authors declare no competing interests.

Figures

Figure 1
Figure 1
Effect of different concentrations of oligomycin and glucose on CCCP-induced maximal oxygen consumption rate (maxOCR) in T98G human glioma cells. T98G cells (1 × 106/mL) were resuspended in sDMEM containing 20 mM HEPES and 11 mM (A–D) or 5.5 mM (E) glucose. CCCP-induced maxOCR was determined with different concentrations of oligomycin (0.3, 1.0 and 3.0 µg/mL) or without oligomycin, which was replaced by an equal volume of DMSO (0.5 µL). (A) Representative traces of OCR in T98G cells incubated in sDMEM. Where indicated by arrows, DMSO (0.5 µL) or 1 µg/mL oligomycin (Oligo) was added, followed by sequential additions of CCCP (2 µM each). (B,C) Effect of different concentrations of oligomycin on maxOCR and SRC (i.e., the difference between maxOCR and basal OCR). Statistically significant difference in relation to the control (DMSO), **P < 0.01. (D) Effect of different concentrations of oligomycin on basal OCR. The data are expressed as a percentage of basal OCR. (E) Effect of oligomycin (1.0 µg/mL) on SRC values for T98G cells incubated in sDMEM containing 5.5 mM glucose. Statistically significant difference in relation to the control (DMSO), **P < 0.01.
Figure 2
Figure 2
Effect of sodium bicarbonate on CCCP-induced maxOCR in T98G glioma cells. T98G cells (1.5 × 106/mL) were incubated in sDMEM containing 20 mM HEPES with or without 44 mM sodium bicarbonate (HCO3). The experiments were conducted by adding DMSO (0.5 µL) or 1 µg/mL oligomycin (Oligo) after basal respiration was reached, followed by sequential additions of CCCP (2 µM each). (A,B) Effect of oligomycin on CCCP-induced maxOCR and estimated SRC for T98G cells. The data were normalized as a percentage of maxOCR (A) or SRC (B) observed under the DMSO condition in the presence of HCO3 (% DMSO + HCO3). Statistically significant difference in relation to the control (DMSO), **P < 0.01. Statistically significant difference in relation to the corresponding condition with sodium bicarbonate, #P < 0.05 and ##P < 0.01.
Figure 3
Figure 3
Effect of medium supplementation with fetal bovine serum on CCCP-induced maxOCR in T98G glioma cells. T98G cells (1.0 × 106/mL) were incubated in DMEM containing 20 mM HEPES with or without 10% fetal bovine serum (FBS). The experiments were conducted by adding DMSO (0.5 µL) or 1 µg/mL oligomycin (Oligo) after stable basal respiration rate was reached, followed by sequential additions of CCCP (+FBS: 2 µM in each addition, −FBS: 0.3 µM in each addition). (A,B) Effect of oligomycin on CCCP-induced maxOCR and estimated SRC for T98G cells. The data were normalized as a percentage of maxOCR (A) or SRC (B) observed under the DMSO condition in the presence of FBS (% DMSO + FBS). Statistically significant difference in relation to the control (DMSO), **P < 0.01.
Figure 4
Figure 4
Inhibitory effect of oligomycin on maxOCR induced by a single addition of CCCP to T98G human glioma cells. T98G cells (1.5 × 106/mL) were incubated in sDMEM containing 20 mM HEPES. Where indicated by the arrows, 0.5 μL DMSO or 1 μg/mL oligomycin (Oligo) was added to the cells, followed by a single addition of CCCP (A: 3 μM; B: 6 μM; C: 9 μM).
Figure 5
Figure 5
Effect of oligomycin on CCCP-induced maxOCR in T98G glioma cells incubated in medium containing glutamine as the only metabolic energy substrate. T98G cells (1.5 × 106/mL) were incubated in non-supplemented DMEM containing 20 mM HEPES and all the metabolic energy substrates (11 mM glucose, 4 mM glutamine and 1.25 mM pyruvate) or only 4 mM glutamine. (A,B) Representative traces of OCR in T98G cells incubated in medium containing all the metabolic energy substrates or only glutamine. Where indicated by arrows, DMSO (0.5 µL) or 1 µg/mL oligomycin (Oligo) was added, followed by sequential additions of CCCP (0.25 µM each). (C,D) Effect of oligomycin on CCCP-induced maxOCR (C) and estimated SRC (D) for T98G cells. Statistically significant difference in relation to the control (DMSO), **P < 0.01. (E) Measurements of ATP levels in T98G cells incubated in medium containing all the metabolic energy substrates or only glutamine. Data were normalized as a percentage of the values of ATP in DMSO and all the substrates (% DMSO – all substr.). Statistically significant difference in relation to the control (DMSO) containing all substrates, **P < 0.01. Statistically significant difference in relation to the control (DMSO) containing only glutamine, ##P < 0.01.
Figure 6
Figure 6
Effect of oligomycin on CCCP-induced maxOCR in U-87MG glioma cells incubated in medium containing glutamine as the only metabolic energy substrate. U-87MG (2 × 106/mL) cells were incubated in non-supplemented DMEM containing 20 mM HEPES and all the metabolic energy substrates (11 mM glucose, 4 mM glutamine, 1.25 mM pyruvate) or only 4 mM glutamine. (A,B) Effect of oligomycin on CCCP-induced maxOCR (A) and estimated SRC (B) for U-87MG cells. Statistically significant difference in relation to the control (DMSO), **P < 0.01.
Figure 7
Figure 7
Effect of 2-deoxyglucose (2-DG) on oligomycin-induced underestimation of maxOCR and on ATP levels in T98G glioma cells. T98G cells (1 × 106/mL) were incubated in sDMEM containing 20 mM HEPES in the presence or absence of 40 mM 2-DG. (A,B) Effect of oligomycin on CCCP-induced maxOCR (A) and estimated SRC (B) for T98G cells. The experiments were conducted by adding DMSO (0.5 µL) or 1 µg/mL oligomycin (Oligo) after a stable basal respiration rate was reached, followed by sequential additions of CCCP (2 µM each). Statistically significant difference in relation to the control (DMSO), **P < 0.01. (C) Measurements of ATP levels in T98G cells. Data were normalized as a percentage of the values of ATP in DMSO in the absence of 2-DG (% DMSO-Glucose). Statistically significant difference in relation to the control (DMSO), **P < 0.01.
Figure 8
Figure 8
Effect of 2-DG on oligomycin-induced underestimation of maxOCR and on ATP levels in U-87MG glioma cells. The experiments were conducted with U-87MG cells (2 × 106/mL) under the same conditions described in Fig. 7 for T98G cells. Statistically significant difference in relation to the control (DMSO), **P < 0.01.
Figure 9
Figure 9
Determination of ADP/ATP ratio in T98G and U-87MG glioma cells. Cells were incubated in sDMEM containing 20 mM HEPES with and without oligomycin (in DMSO) and with and without CCCP as indicated. Statistically significant difference in relation to the condition “DMSO + CCCP”, **P < 0.01.
Figure 10
Figure 10
Effect of citreoviridin on CCCP-induced maxOCR and ATP levels in T98G glioma cells: correlation with its inhibitory effect on the reverse activity of ATP synthase. T98G cells (1.5 × 106/mL) were incubated in sDMEM containing 20 mM HEPES for OCR measurements, and the same medium without phenol red was used to estimate mitochondrial membrane potential. (A,B) Effect of 5 µM and 20 µM citreoviridin on CCCP-induced maxOCR (A) and estimated SRC (B) in T98G cells. The experiments were conducted by adding DMSO (0.5 µL), 1 µg/mL oligomycin (Oligo), 5 µM citreoviridin or 20 µM citreoviridin after a stable basal respiration rate was reached, followed by sequential additions of CCCP (2 µM each) to obtain maxOCR. Statistically significant difference in relation to the control (DMSO), **P < 0.01. Statistically significant difference in relation to treatment with 5 µM citreoviridin (citre 5), #P < 0.05 and ##P < 0.01. (C) Representative traces of the citreoviridin effect on mitochondrial membrane potential sustained by the reverse activity of ATP synthase. Cells were incubated in sDMEM without phenol red and with 500 nM TMRM and 1 µM TPB. Where indicated by the arrow, 1 µM antimycin (AA) was added, followed by addition of 5 µM or 20 µM citreoviridin (Citre). Next, 1 µg/mL oligomycin was added to completely inhibit the reverse activity of ATP synthase, followed by addition of 5 µM CCCP. The fraction of mitochondrial membrane potential that is maintained by the reverse activity of ATP synthase is indicated by the letter “A”, while the fraction that is insensitive to citreoviridin is indicated by the letter “B”. (D) Estimation of the membrane potential fractions that are maintained by the reverse activity of ATP synthase and are sensitive to 5 µM and 20 µM citreoviridin (1 - B/A). Statistically significant difference in relation to 5 µM citreoviridin (Citre 5), **P < 0.01. (E) Effect of CCCP on ATP levels of T98G cells incubated with 5 µM or 20 µM citreoviridin. Data were normalized as a percentage of the values of ATP in DMSO (% DMSO). Statistically significant difference in relation to the control (DMSO), **P < 0.01.
Figure 11
Figure 11
Effect of ADP and ATP on CCCP-induced maxOCR in permeabilized T98G and U-87MG cells. T98G (1.5 × 106/mL) and U-87MG (2 × 106/mL) cells were incubated in “permeabilization medium” containing 30 µM digitonin, and maxOCR was estimated by sequential additions of CCCP (0.05 µM each). The effects of ADP and ATP on maxOCR were assessed by incubating the cells in the presence of 1 mM ADP or an ATP regeneration system (1 mM ADP, 10 mM phosphocreatine plus 50 µg/mL creatine phosphokinase). (A,B) Representative traces of OCR in permeabilized T98G and U87-MG cells. (C,D) Effects of ADP and ATP on CCCP-induced maxOCR in permeabilized T98G and U87-MG cells. Statistically significant difference versus the corresponding control, **P < 0.01. Statistically significant difference in relation to “ + ADP”, ##P < 0.01.
Figure 12
Figure 12
Monitoring mitochondrial OCR and membrane potential in T98G human glioma cells: effect of oligomycin on CCCP-induced maxOCR. T98G cells (1.5 × 106/mL) were resuspended in sDMEM without phenol red containing 20 mM HEPES, 500 nM TMRM and 1 µM TPB. (A,B) Representative traces of mitochondrial OCR and membrane potential in suspended T98G cells. Where indicated by arrows, DMSO (0.5 µL) or 1 µg/mL oligomycin (Oligo) was added, followed by sequential additions of CCCP (3 µM each). OCR is shown on the left ordinate axis, and the mitochondrial membrane potential on the right axis. Membrane potential is expressed as −∆F/F, where F is the fluorescence intensity after the last addition of CCCP and ∆F is F minus any given fluorescence intensity. (C) Graphical correlation of mitochondrial OCR and membrane potential. OCR values were normalized by the respective basal OCR. (D) The left ordinate axis shows the relative maxOCR (maxOCR/basalOCR) for T98G cells in the presence and absence of oligomycin. The right ordinate axis shows the mitochondrial membrane potential (∆F/F) when maxOCR was achieved. Statistically significant difference in relation to the control (DMSO), **P < 0.01.
Figure 13
Figure 13
Monitoring mitochondrial OCR and membrane potential in U-87MG human glioma cells: effect of oligomycin on CCCP-induced maxOCR. The experiments were conducted with U-87MG cells (2 × 106/mL) using the same conditions described in Fig. 12 for T98G cells. Statistically significant difference in relation to the control (DMSO), *P < 0.05, **P < 0.01.

References

    1. Green DR, Galluzzi L, Kroemer G. Cell biology. Metabolic control of cell death. Science. 2014;345:1250256. doi: 10.1126/science.1250256. - DOI - PMC - PubMed
    1. Kasahara A, Scorrano L. Mitochondria: from cell death executioners to regulators of cell differentiation. Trends Cell Biol. 2014;24:761–770. doi: 10.1016/j.tcb.2014.08.005. - DOI - PubMed
    1. Birsoy K, et al. An essential role of the mitochondrial electron transport chain in cell proliferation is to enable aspartate synthesis. Cell. 2015;162:540–551. doi: 10.1016/j.cell.2015.07.016. - DOI - PMC - PubMed
    1. Crabtree HG. Observations on the carbohydrate metabolism of tumours. Biochem. J. 1929;23:536–545. doi: 10.1042/bj0230536. - DOI - PMC - PubMed
    1. Diaz-Ruiz R, Rigoulet M, Devin A. The Warburg and Crabtree effects: On the origin of cancer cell energy metabolism and of yeast glucose repression. Biochim. Biophys. Acta. 2011;1807:568–576. doi: 10.1016/j.bbabio.2010.08.010. - DOI - PubMed

Publication types

MeSH terms