. 2019 Jan;20(1):50-63.
doi: 10.1038/s41590-018-0255-3. Epub 2018 Nov 26.

Macrophage de novo NAD+ synthesis specifies immune function in aging and inflammation

Affiliations

Macrophage de novo NAD+ synthesis specifies immune function in aging and inflammation

Paras S Minhas et al. Nat Immunol. 2019 Jan.

Abstract

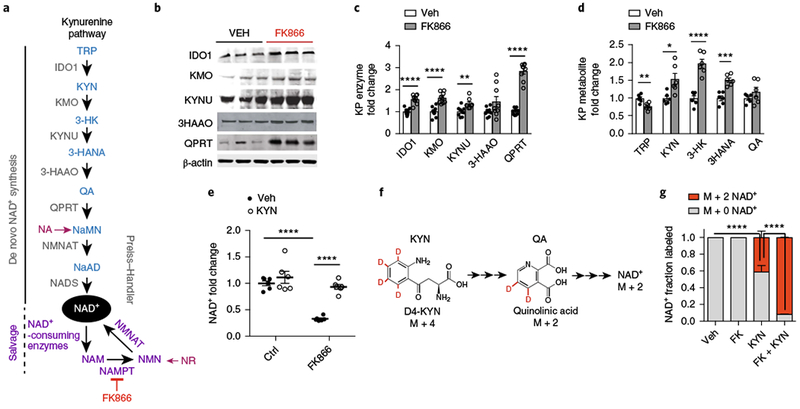
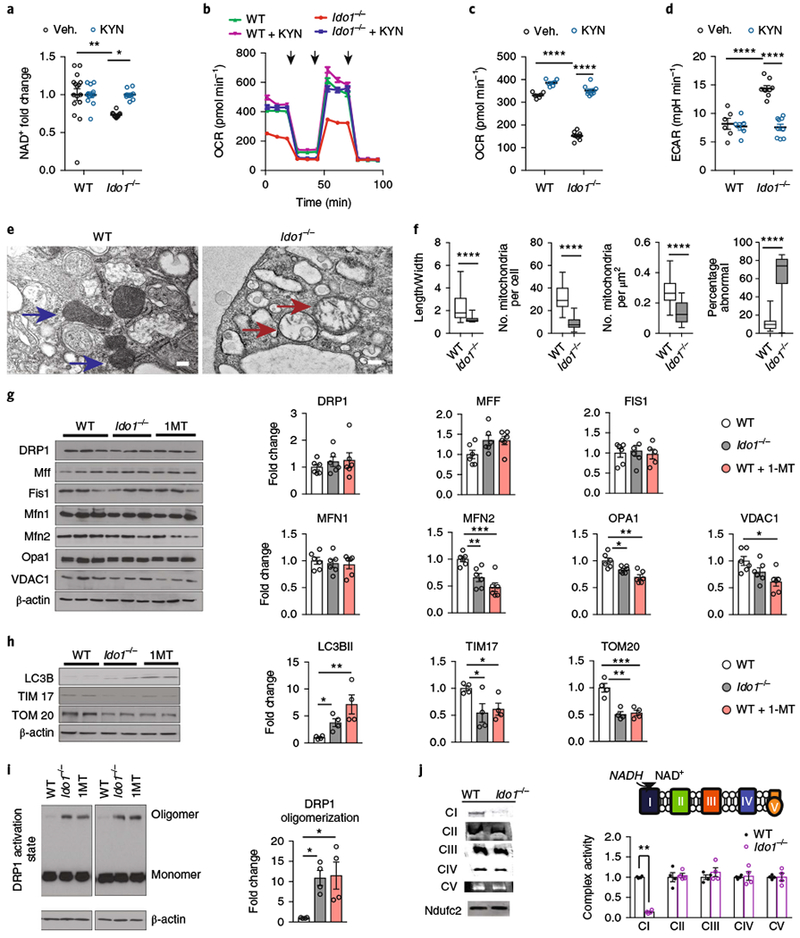
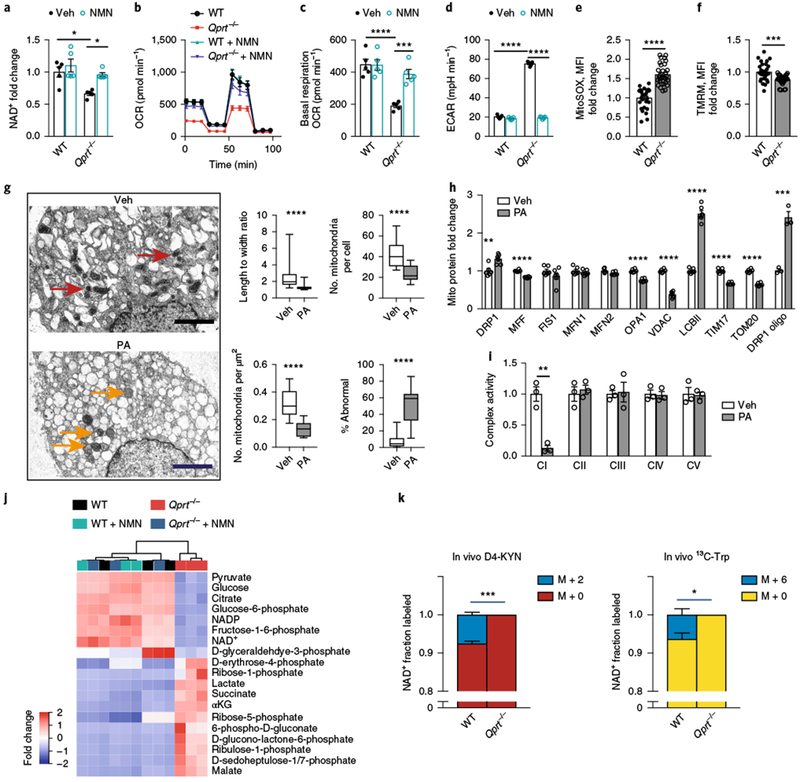
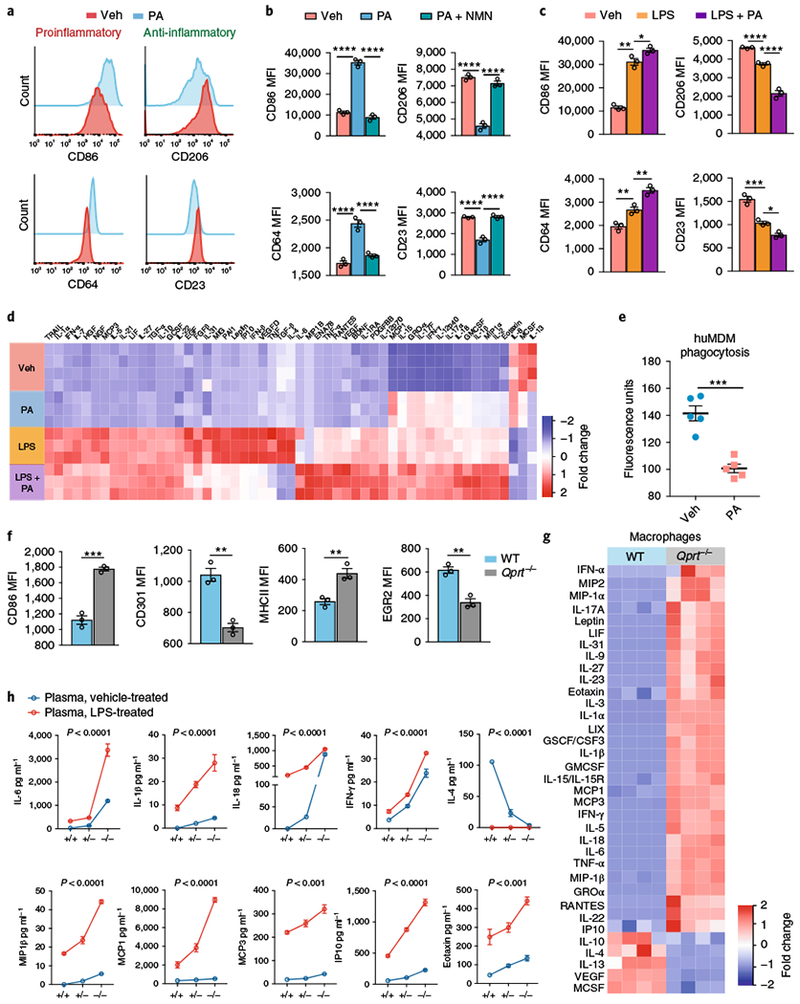
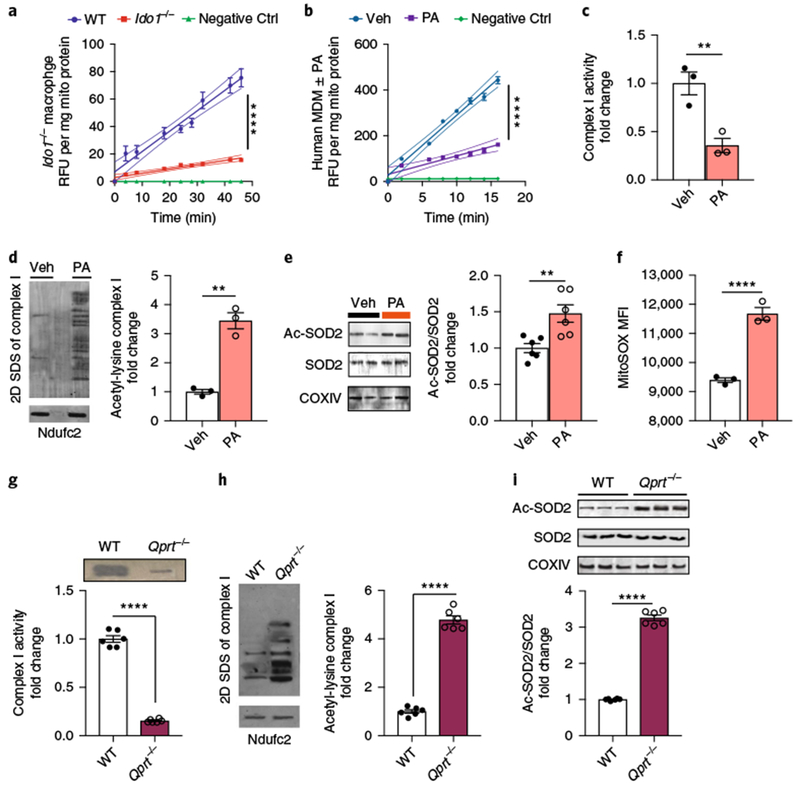
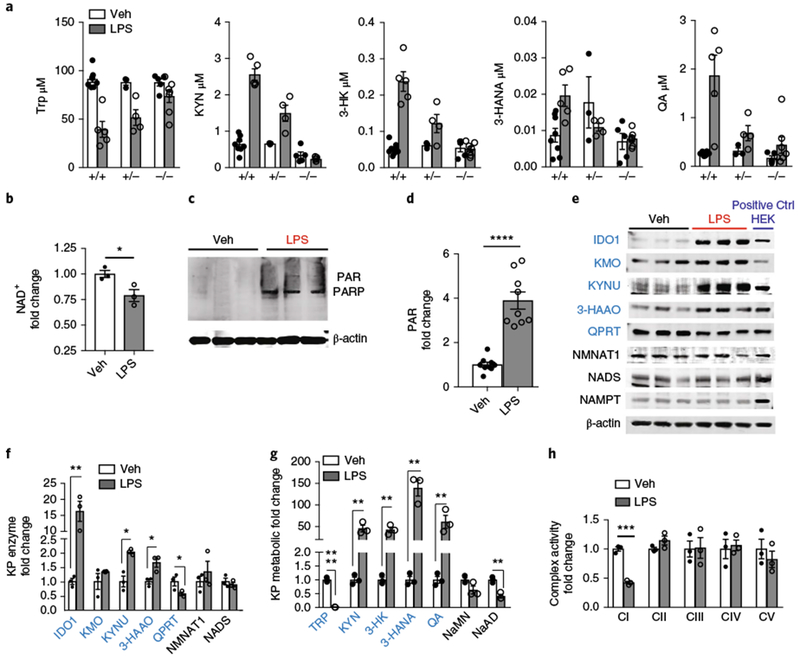
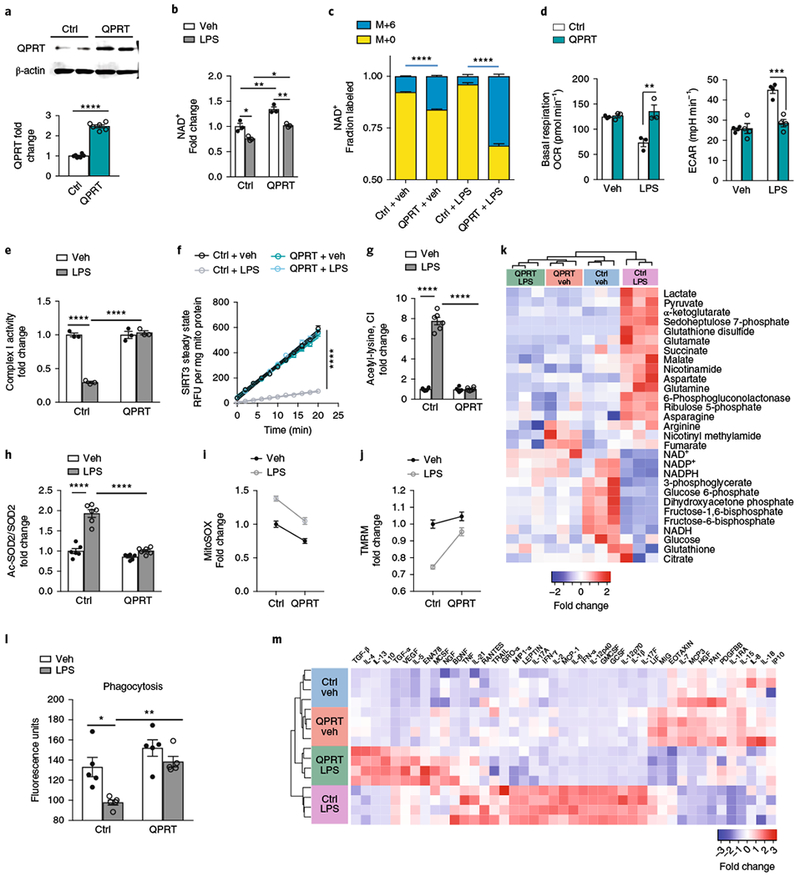
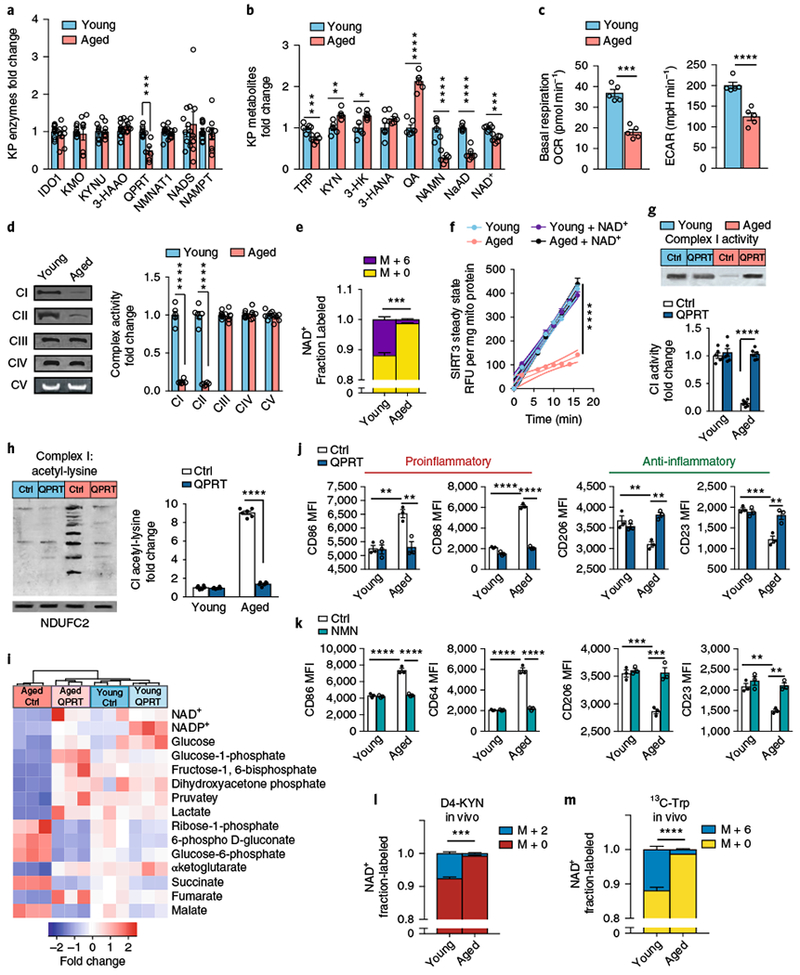
Recent advances highlight a pivotal role for cellular metabolism in programming immune responses. Here, we demonstrate that cell-autonomous generation of nicotinamide adenine dinucleotide (NAD+) via the kynurenine pathway (KP) regulates macrophage immune function in aging and inflammation. Isotope tracer studies revealed that macrophage NAD+ derives substantially from KP metabolism of tryptophan. Genetic or pharmacological blockade of de novo NAD+ synthesis depleted NAD+, suppressed mitochondrial NAD+-dependent signaling and respiration, and impaired phagocytosis and resolution of inflammation. Innate immune challenge triggered upstream KP activation but paradoxically suppressed cell-autonomous NAD+ synthesis by limiting the conversion of downstream quinolinate to NAD+, a profile recapitulated in aging macrophages. Increasing de novo NAD+ generation in immune-challenged or aged macrophages restored oxidative phosphorylation and homeostatic immune responses. Thus, KP-derived NAD+ operates as a metabolic switch to specify macrophage effector responses. Breakdown of de novo NAD+ synthesis may underlie declining NAD+ levels and rising innate immune dysfunction in aging and age-associated diseases.


Conflict of interest statement

Competing interests

The authors declare no competing interests.

Figures

Fig. 1|
Fig. 1|. The KP contributes to de novo NAD+ synthesis.
a, Diagram of the KP and formation of QA, the precursor for de novo NAD+ synthesis, which is then metabolized by the rate-limiting QPRT to NaMN. NMNAT, nicotinamide mononucleotide adenylyltransferase; NADS, NAD+ synthase. b-d, Human MDMs were treated with vehicle or the NAMPT inhibitor FK866 (10 μM for 20 h). b, Representative immunoblot of three independent experiments measuring KP enzymes ± FK866 (10 μM for 20 h). c, Quantification of KP enzyme levels normalized to β-actin; n = 9 biologically independent samples per group, represented as the mean ± s.e.m.; **P < 0.01 and ****P < 0.0001, two-tailed Student’s t-test). d, LC-MS of KP metabolites from human MDM cell lysates; n = 6 biologically independent samples per group, represented as the mean ± s.e.m.; *P < 0.05, **P < 0.01, ***P < 0.001, and ****P < 0.0001, two-tailed Student’s t-test. See also Supplementary Fig. 1a. e, Human MDMs ± FK866 (10 μM, 20 h) were supplemented with KYN (25 μM) or vehicle for 20 h. LC-MS measurements of NAD+; n = 6 biologically independent samples per group, represented as the mean ± s.e.m.; ****P < 0.0001, two-way ANOVA with Tukey’s post hoc test. See also Supplementary Fig. 1b,c. f, Experiments in e were repeated using mass-labeled D4-KYN. See Supplementary Fig. 1d. g, Human MDM cell lysates were assayed by LC-MS 20 h after the administration of FK866 and/or KYN and assayed for M + 2 NAD+. Data are represented as the mean ± s.e.m.; n = 3 biologically independent samples per group; ****P < 0.0001, two-tailed Student’s t-test.
Fig. 2|
Fig. 2|. Loss of ID01 lowers cellular NAD+ and disrupts macrophage mitochondrial respiration and dynamics.
a-d, Primary peritoneal macrophages from WT and Ido1−/− mice were supplemented with vehicle or 25 μM KYN for 20 h. See also Supplementary Fig. 2. a, Measurement of NAD+ levels; n = 16 biologically independent samples per WT group and n = 10 biologically independent samples per Ido1−/− group, represented as the mean ± s.e.m.; **P = 0.0093 for WT vehicle versus Ido1−/− vehicle *P = 0.0220 for Ido1−/− vehicle versus Ido1−/− KYN, two-way ANOVA with Tukey’s post hoc test. b, Representative trace from two independent experiments of real-time changes in oxygen-consumption rate (OCR) after treatment with oligomycin (1 μM), FCCP (2 μM), and rotenone (0.5 μM), respectively, represented by three vertical black arrows, using the Seahorse extracellular flux assay. Data are represented as the mean ± s.e.m. with n = 6 biologically independent samples for the WT group and n = 9 biologically independent samples for the Ido1−/− group. c, Quantification of basal respiration; n = 6 biologically independent samples for the WT group and n = 9 biologically independent samples for the Ido1−/− group, data are represented as the mean ± s.e.m.; ****P < 0.0001 for WT vehicle versus Ido1−/− vehicle, ****P < 0.0001 for Ido1−/− vehicle versus Ido1−/− KYN, two-way ANOVA with Tukey’s post hoc test. d, Quantification of ECAR; n = 6 biologically independent samples for the WT group and n = 9 biologically independent samples for the Ido1−/− group, represented as the mean ± s.e.m.; ****P < 0.0001 for WT vehicle versus Ido1−/− vehicle, ****P < 0.0001 for Ido1−/− vehicle versus Ido1−/− KYN by two-way ANOVA with Tukey’s post hoc test. See also Supplementary Fig. 2d–h. e, Representative TEM images from two independent experiments of WT (blue arrows) and Ido1−/− (red arrows) macrophages (scale bar, 2 μm). f, Quantification of length-to-width ratio, numbers, density, and percentage abnormal mitochondria in Ido1−/− macrophages; n = 257 biologically independent samples for the WT group and n = 269 biologically independent samples for the Ido1−/− group, represented as a box and whisker plot (5–95 percentile); ****P < 0.0001, two-tailed Student’s t-test. g, Peritoneal macrophages from WT, Ido1−/−, and WT + 1MT (200 μM, 20 h) animals were assayed for mitochondrial fission, fusion, and mass proteins using quantitative immunoblot analysis. Data are represented as the mean ± s.e.m. (n = 6 biologically independent samples per group; *P < 0.05, **P < 0.01, ***P < 0.001, one-way ANOVA with Tukey’s multiple comparisons test). h, Representative immunoblot for markers of autophagy and mitochondrial mass (n = 9 biologically independent samples per group; *P < 0.05, **P < 0.01, ***P < 0.001, one-way ANOVA with Tukey’s multiple comparisons test). i, Representative immunoblot and quantification of DRP1 oligomerization in Ido1−/− and 1MT-treated macrophages (n = 4 biologically independent samples per group, *P < 0.05, one-way ANOVA with Tukey’s multiple comparisons test). j, Left: representative BN-PAGE from two independent experiments of complexes I-V and positive control NDUCF2 derived from WT and Ido1−/− macrophage mitochondria. Right: quantification of BN-PAGE complex I-V activities; n = 4 biologically independent samples per group, represented as the mean ± s.e.m.; **P = 0.0019, Student’s t-test. See also Supplementary Fig. 2i.
Fig. 3|
Fig. 3|. Loss of QPRT reduces cellular NAD+ and disrupts macrophage oxidative phosphorylation, dynamics, and metabolism.
a-d WT and Qprt−/− macrophages were treated with vehicle or NMN 10 μM for 20 h. a, NAD+ levels were measured with LC-MS; n = 5 biologically independent samples per group, represented as the mean ± s.e.m.; *P = 0.0121 for WT vehicle versus Qprt−/− vehicle, *P = 0.0288 for Qprt−/− vehicle versus Qprt−/− + NMN, two-way ANOVA with Tukey’s post hoc test. b, Representative OCR trace from two independent experiments. c, Quantification of basal respiration; n = 5 biologically independent samples per group, represented as the mean ± s.e.m.; ****P < 0.0001 and ***P < 0.001, two-way ANOVA with Tukey’s post hoc test. d, Quantification of ECAR; n = 5 biologically independent samples per group, represented as the mean ± s.e.m.; ****P < 0.0001, two-way ANOVA with Tukey’s post-hoc test. See Supplementary Fig. 4a–d. e, Quantification of mitochondrial ROS using MitoSOX in Qprt−/− and WT macrophages; n = 30 biologically independent samples per group, represented as the mean ± s.e.m.; ****P < 0.0001, two-tailed Student’s t-test. f, Quantification of mitochondrial membrane potential using TMRM; n = 30 biologically independent samples per group, represented as the mean ± s.e.m.; ***P = 0.001, two-tailed Student’s t-test. g, Human MDMs were treated with PA (500 μM, 20 h). Left: transmission electron micrographs of vehicle- and PA-treated human MDMs shows altered morphology of mitochondria (vehicle, red arrows; PA, orange arrows; scale bar, 2 μM). Right: quantification of mitochondrial length-to-width ratio, number of mitochondria per cell, density, and percentage abnormal mitochondria (n = 227 biologically independent samples per group, represented as a box and whisker plot (5–95 percentile); ****P < 0.0001, two-tailed Student’s t-test). h, Quantification of mitochondrial fission, fusion, and mass proteins in human MDMs treated with PA (500 μM, 20 h; n = 6 biologically independent samples per group; **P < 0.01, ***P < 0.001, ****P < 0.0001, two-tailed Student’s t-test). i, BN-PAGE of complex I activity in PA-treated macrophages; n = 3 biologically independent samples per group, represented as the mean ± s.e.m.; **P = 0.0098, two-tailed Student’s t-test. j, Hierarchical clustering of targeted metabolomics for glycolysis, pentose phosphate shunt, and citric acid cycle metabolites in WT and Qprt−/− macrophages treated with vehicle or NMN (n = 3 biologically independent samples per group). See Supplementary Fig. 4e,f. k, WT and Qprt−/− mice were orally administered isotope-labeled KYN (D4-KYN) or Trp (13C-Trp) and de novo NAD+ synthesis was measured with LC-MS 4h later in peritoneal macrophages; n = 3 mice per group, represented as the mean ± s.e.m. *P = 0.0171, ***P = 0.0003, two-tailed Student’s t-test.
Fig. 4|
Fig. 4|. De novo NAD+ synthesis regulates basal and LPS-activated macrophage polarization, immune factor generation, and phagocytosis.
a–e Human MDMs were treated with the QPRT inhibitor PA (500 μM, 20 h) ± NMN (10 μM, 20 h) or ± LPS and assayed by flow cytometry for inflammatory surface markers and immune factors using Luminex multi-analyte measurements. a, Representative histograms of three independent experiments for the proinflammatory markers CD86 and CD64 and anti-inflammatory markers CD206 and CD23 in resting macrophages stimulated with PA. See Supplementary Fig. 5a,b. b, MFIs were quantified in human MDMs treated with PA and NMN; n = 3 biologically independent samples per group, 7,300–11,200 cells per group, represented as the mean ± s.e.m.; ****P < 0.0001, one-way ANOVA with Tukey’s post hoc test. c, MFIs for proinflammatory and anti-inflammatory markers in LPS-stimulated macrophages treated with PA; n = 3 biologically independent samples per group, 7,200–13,358 cells per group, represented as the mean ± s.e.m.; *P < 0.05, **P < 0.01, ***P < 0.001, ****P < 0.0001, one-way ANOVA with Tukey’s post hoc test. See Supplementary Fig. 5c. d, Hierarchical clustering of immune factors in culture medium of human MDMs ± PA and ± LPS (n = 4 per group; P < 0.05 by ANOVA). See also Supplementary Figure 5d. e, Phagocytosis of fluorescein-labeled E. coli in human MDMs treated with PA or vehicle; n = 5 biologically independent samples per group, represented as the mean ± s.e.m.; ***P = 0.0002, two-tailed Student’s t-test. f, WT and Qprt−/− peritoneal macrophages were assayed by flow cytometry for proinflammatory CD86 and major histocompatibility complex class II (MHCII) and anti-inflammatory CD301 and early growth response protein 2 (EGR2); n = 3 biologically independent samples per group, 2,145–3,224 cells per group, represented as the mean ± s.e.m.; **P < 0.01, ***P <0.001, two-tailed Student’s t-test. g, Hierarchical clustering of immune factors produced by peritoneal macrophages from WT and Qprt−/− mice 20 h after isolation. h, WT and Qprt−/− mice were systemically stimulated with either vehicle or LPS (5 mg kg−1, intraperitoneal injection) and plasma was assayed at 20 h for immune factors. n = 3 biologically independent samples for the WT group, n = 4 biologically independent samples for the Qprt−/− group, represented as the mean ± s.e.m. The two-way ANOVA effect of LPS is P < 0.0001 for all immune factors; the effect of genotype is P < 0.0001 for all immune factors except for monocyte chemoattractant protein 1 (MCP1) and eotaxin, where P < 0.001.
Fig. 5|
Fig. 5|. De novo NAD+ synthesis regulates SIRT3 deacetylation of complex I subunits and SOD2.
a, WT and Ido1−/− mouse peritoneal macrophages were assayed for SIRT3 steady-state kinetics; n = 3 biologically independent samples per group, represented as the mean ± s.e.m. with curved thin lines denoting 95% confidence intervals (CIs); ****P < 0.0001 via linear regression analysis. See also Supplementary Fig. 6a. b-f, Human MDMs were treated with PA (500 μM for 20 h) and assayed for SIRT3 activity, acetylation of complex I subunits and SOD2, and mitochondrial ROS. b, SIRT3 steady-state kinetics; n = 3 biologically independent samples per group, represented as the mean ± s.e.m. with curved thin lines denoting 95% CIs; ****P < 0.0001 via linear regression analysis. See also Supplementary Fig. 6b. c, BN-PAGE quantification of complex I activity; n = 3 biologically independent samples per group, represented as the mean ± s.e.m.; **P = 0.0098, two-tailed Student’s t-test. d, Representative 2D SDS gel electrophoresis of three independent experiments of complex I with quantification of acetyl-lysine in vehicle versus PA-treated human MDMs, n = 3 biologically independent samples per group, represented as the mean ± s.e.m.; **P = 0.0010, two-tailed Student’s t-test. e, Representative immunoblot of two independent experiments of acetylated-SOD2 (ac-SOD2) and SOD2 and quantification of the ac-SOD2/total SOD2 ratio, n = 6 biologically independent samples per group, represented as the mean ± s.e.m; **P = 0.0056, two-tailed Student’s t-test. f, Mean fluorescence index of mitochondrial ROS; n = 3 biologically independent samples per group, 14,700-15,200 cells per group, represented as the mean ± s.e.m.; ****P < 0.0001, two-tailed Student’s t-test. g-i, WT and Qprt−/− peritoneal macrophages were assayed for complex I activity and SIRT3 deacetylation of complex I subunits and SOD2. g, Complex I activity is reduced in Qprt−/− macrophages; n = 6 biologically independent samples per group, represented as the mean ± s.e.m.; ****P < 0.0001, two-tailed Student’s t-test. h, Quantification of acetyl-lysine residues in complex I subunits; n = 6 biologically independent samples per group, represented as the mean ± s.e.m.; ****P < 0.0001, two-tailed Student’s t-test. i, Ratio of ac-SOD2 to total SOD2; n = 6 biologically independent samples per group, represented as the mean ± s.e.m.; ****P < 0.0001, two-tailed Student’s t-test.
Fig. 6|
Fig. 6|. LPS suppresses QPRT expression and de novo NAD+ synthesis in human MDMs.
a, WT, Ido1+/−, and Ido1−/− mice were stimulated with LPS (5 mg kg−1 intraperitoneally) and KP metabolites were measured 20 h later in plasma using LC-MS, n = 3–8 per group, represented as the mean ± s.e.m.; two-way ANOVA, effects of genotype are: P < 0.05, 0.0001, 0.0001, 0.05, and 0.001 for Trp, KYN, 3-HK, 3-HANA, and QA, respectively. b-h, Human MDMs were treated with LPS (100 ng ml−1) or vehicle for 20 h. b, Representative LC-MS of two independent experiments of cellular NAD+ levels, n = 3 biologically independent samples per group, represented as the mean ± s.e.m.; *P = 0.0231, two-tailed Student’s t-test. c, Representative immunoblot of three independent experiments of human MDM cell lysates showing PARylated PARP (molecular weight = 116 kDa). d, Quantification of polyADP-ribosylation (PAR) in LPS versus vehicle-treated cells, normalized to vehicle; n = 9 biologically independent samples per group, represented as the mean ± s.e.m.; ****P < 0.0001, two-tailed Student’s t-test. e, Representative immunoblot of three independent experiments for KP enzymes in human MDMs stimulated with vehicle or LPS for 20 h. Far right lane: positive Ctrl (+ Ctrl HEK) consists of 20 μg lysates derived from HEK cells transiently transfected with the respective KP enzyme complementary DNA. f, Quantification of KP enzyme levels in LPS and vehicle-stimulated human MDMs at 20 h, normalized to loading control β-actin and then normalized to vehicle-treated; n = 3 biologically independent samples per group, represented as the mean ± s.e.m.; *P < 0.05, **P < 0.01, two-tailed Student’s t-test. See also Supplementary Fig. 6f,g. g, LC-MS of human MDM cell lysates for KP and de novo NAD+ metabolites; n = 3 biologically independent samples per group, represented as the mean ± s.e.m.; **P < 0.01, two-tailed Student’s t-test. See also Supplementary Fig. 10g. h, BN-PAGE of complex I activity in LPS-treated human MDMs; n = 3 biologically independent samples per group, represented as the mean ± s.e.m.; ***P = 0.0002, two-tailed Student’s t-test.
Fig. 7|
Fig. 7|. Increasing QPRT expression in LPS-treated human MDMs restores mitochondrial metabolism and immune responses.
Human MDMs transfected with QPRT or control (GFP) vector were stimulated with either vehicle or LPS (100 ng ml−1) and assayed at 20 h. a, Representative quantitative immunoblot analysis of three independent experiments of control (Ctrl) and QPRT-overexpressing human MDMs; n = 6 biologically independent samples per group, represented as the mean ± s.e.m.; ****P < 0.0001, two-tailed Student’s t-test. b, LC-MS of NAD+ in control and QPRT-overexpressing human MDMs ± LPS; n GFP = 3 biologically independent samples per group, represented as the mean ± s.e.m. Two-way ANOVA, effect of QPRT P < 0.001 and effect of LPS P < 0.01; Tukey’s post hoc test, *P < 0.05, **P < 0.01. c, Isotope-labeled 13C-Trp was added to Ctrl and QPRT human MDMs ± LPS; the fraction of labeled M+6 NAD+ was quantified with LC-MS; n = 3 biologically independent samples per group, represented as the mean ± s.e.m.; ****P < 0.0001, two-tailed Student’s t-test. d, Quantification of basal respiration and ECAR in control and QPRT-overexpressing human MDMs ± LPS; n = 3 biologically independent samples per group for basal respiration: two-way ANOVA, effect of QPRT P < 0.01 and effect of LPS P < 0.05; Tukey’s post hoc test **P = 0.0021; n = 4 per group for ECAR: two-way ANOVA effect of QPRT P < 0.001 and effect of LPS P < 0.0001, Tukey’s post hoc test ***P = 0.00031; data are represented as the mean ± s.e.m. See also Supplementary Fig. 6j,k. e, Complex I activity in LPS-stimulated macrophages overexpressing QPRT, as assayed by BN-PAGE; n = 3 biologically independent samples per group, represented as the mean ± s.e.m.; two-way ANOVA, effects of QPRT and LPS P < 0.0001; Tukey’s post hoc test ****P < 0.0001. See Supplementary Fig. 8a,b. f, SIRT3 steady-state kinetics in LPS-stimulated human MDMs ± QPRT overexpression; n = 6 biologically independent samples per group, represented as the mean ± s.e.m. with curved lines denoting 95% CIs; ****P < 0.0001 by linear regression analysis for Ctrl + LPS versus the other groups. g, Deacetylation of complex I subunits in LPS-stimulated macrophages ± QPRT overexpression; n = 6 biologically independent samples per group, represented as the mean ± s.e.m.; two-way ANOVA effects of QPRT and LPS, P < 0.0001; Tukey’s post hoc test, ****P < 0.0001. h, Ratios of ac-SOD2 to total SOD2 in LPS-stimulated human MDMs ± QPRT overexpression; n = 6 biologically independent samples per group, represented as the mean ± s.e.m.; two-way ANOVA effects of QPRT and LPS, P < 0.0001; Tukey’s post hoc test ****P < 0.0001. See Supplementary Fig. 8c. i, Mitochondrial ROS in LPS-stimulated human MDMs ± QPRT overexpression; n = 30 biologically independent samples per group, represented as the mean ± s.e.m.; two-way ANOVA effects of QPRT and LPS, P < 0.0001. j, TMRM in LPS-stimulated human MDMs ± QPRT overexpression; n = 30 biologically independent samples per group, represented as the mean ± s.e.m.; two-way ANOVA effects of QPRT and LPS, P < 0.0001. k, Hierarchical clustering of targeted metabolomics of control and QPRT-overexpressing human MDMs ± LPS. See also Supplementary Fig. 7 for untargeted metabolomics analyses. l, Phagocytosis of fluorescein-labeled E. coli is rescued in LPS-treated human MDMs with QPRT overexpression; n = 5 biologically independent samples per group, represented as the mean ± s.e.m.; two-way ANOVA, effects of QPRT and LPS, ***P = 0.0006 and **P < 0.003, respectively; Tukey’s post hoc test, *P < 0.05 and **P < 0.01. m, Hierarchical clustering of immune factors in control and QPRT human MDMs ± LPS, n = 4 per group; P < 0.05 by ANOVA with multiple comparisons. See also Supplementary Fig. 8d,e.
Fig. 8|
Fig. 8|. De novo NAD+ synthesis is reduced in aging human MDMs and in vivo in aging mouse macrophages.
a–f, Young and aged human MDMs were derived from individuals ≤35 and ≥65 years old, respectively, and analyzed for QPRT levels, KP and NAD+ metabolites, mitochondrial respiration, and immune polarization state. See Supplementary Figs. 9,10. a, Quantitative immunoblot analysis of human MDMs of QPRT expression in aging versus young macrophages; n = 9 biologically independent samples per group for IDO1 and NADS, n = 10 biologically independent samples per group for 3-HAAO, n = 8 biologically independent samples per group for all other enzymes, represented as the mean ± s.e.m.; ***P = 0.0006, two-tailed Student’s t-test. b, LC-MS quantification of KP metabolites, NAD+ precursors, and NAD+ in young versus aged macrophages; n = 6 biologically independent samples per group, represented as the mean ± s.e.m.; *P < 0.05, **P < 0.01, ***P < 0.001, ****P < 0.0001, two-tailed Student’s t-test. c, Basal respiration and ECAR in young compared to aged macrophages; n = 5 biologically independent samples per group, represented as the mean ± s.e.m.; ***P = 0.0002, ****P < 0.0001, two-tailed Student’s t-test. d, Left: representative BN-PAGE blot of complex I and II activities in young versus aged human MDMs. Right: quantification of complex activities; n = 6 biologically independent samples per group, represented as the mean ± s.e.m.; ****P < 0.0001, two-tailed Student’s t-test. e, 13C-Trp was added to young and aged human MDMs and the fraction of labeled M+6 NAD+ was quantified with LC-MS; n = 3 biologically independent samples per group, represented as the mean ± s.e.m.; ***P = 0.0004, two-tailed Student’s t-test. f, Young and aged human MDMs were assayed for SIRT3 steady-state activity; n = 6 biologically independent samples per group, represented as the mean ± s.e.m.; the curved thin lines denote 95% CIs; ****P < 0.0001 via linear regression analysis. g-j, Young and aged human MDMs were transfected with either control vector (Ctrl) or QPRT vector (QPRT) and assayed for complex activities, targeted metabolomics, and immune polarization. g, Top: representative BN-PAGE blot of complex I activity in young and aged human MDMs transfected with either control or QPRT vectors. Bottom: quantification of complex I activity; n = 6 biologically independent samples per group, represented as the mean ± s.e.m.; two-way ANOVA, effect of age and QPRT, ****P < 0.0001; Tukey’s post hoc test, ****P < 0.0001. h, Left: representative 2D SDS blot of complex I from young and aged human MDMs ± QPRT overexpression assayed for acetyl-lysines. Right: quantification of acetyl-lysines in complex I; n = 6 biologically independent samples per group, represented as the mean ± s.e.m.; two-way ANOVA, effect of age and QPRT, ****P < 0.0001; Tukey’s post hoc test, ****P < 0.0001). i, Hierarchical clustering of targeted metabolomics in young versus aged human MDMs transfected with control or QPRT vector (n = 3 biologically independent samples per group). j, MFIs of the proinflammatory markers CD86 and CD64 and anti-inflammatory markers CD206 and CD23 in aged and young human MDMs transfected with control or QPRT vector. N = 3 biologically independent samples per group, 8,374–12,576 cells per group, represented as the mean ± s.e.m.; two-way ANOVA effect sizes: CD86, effect of age and QPRT, P < 0.01; CD64, effect of age and QPRT, P < 0.0001; CD206, effect of QPRT, P < 0.01; CD23, effect of age, P < 0.001, and effect of QPRT, P<0.01; Bonferroni post hoc test: **P < 0.01, ***P < 0.001, ****P < 0.0001. k, Effect of NMN supplementation (10 μM, 20 h). N = 3 biologically independent samples per group, represented as the mean ± s.e.m.; two-way ANOVA effect sizes: CD86, effect of age and NMN, P < 0.0001; CD64, effect of age and NMN, P < 0.0001; CD206, effect of age and NMN, P < 0.001; CD23, effect of age and NMN, P < 0.01; Bonferroni post hoc test: **P < 0.01, ***P < 0.001, ****P < 0.0001. l-m, De novo NAD+ synthesis is reduced in aging mouse macrophages in vivo; n = 3 biologically independent samples per group; ***P = 0.0002 and ****P < 0.0001 for young versus aged, two-tailed Student’s t-test. Young (3 months) and aged (16–18 months) C57B/6J mice were administered 8 mg of D4-KYN (l) or 13C-Trp (m) by oral gavage, and de novo NAD+ levels were measured in peritoneal macrophages 4 h later with LC-MS. Data are represented as the mean ± s.e.m.

Comment in

References

    1. Pearce EL & Pearce EJ Metabolic pathways in immune cell activation and quiescence. Immunity 38, 633–643 (2013). - PMC - PubMed
    1. Mills EL, Kelly B & O’Neill LAJ Mitochondria are the powerhouses of immunity. Nat. Immunol. 18, 488–498 (2017). - PubMed
    1. Verdin E NAD+ in aging, metabolism, and neurodegeneration. Science 350, 1208–1213 (2015). - PubMed
    1. Katsyuba E & Auwerx J Modulating NAD+ metabolism, from bench to bedside. EMBO J. 36, 2670–2683 (2017). - PMC - PubMed
    1. Yang Y & Sauve AA NAD+ metabolism: bioenergetics, signaling and manipulation for therapy. Biochim. Biophys. Acta 1864, 1787–1800 (2016). - PMC - PubMed

Publication types

MeSH terms