. 2018 Nov 26;9(1):4970.
doi: 10.1038/s41467-018-07455-9.

Quantifying post-transcriptional regulation in the development of Drosophila melanogaster

Affiliations

Quantifying post-transcriptional regulation in the development of Drosophila melanogaster

Kolja Becker et al. Nat Commun. .

Abstract

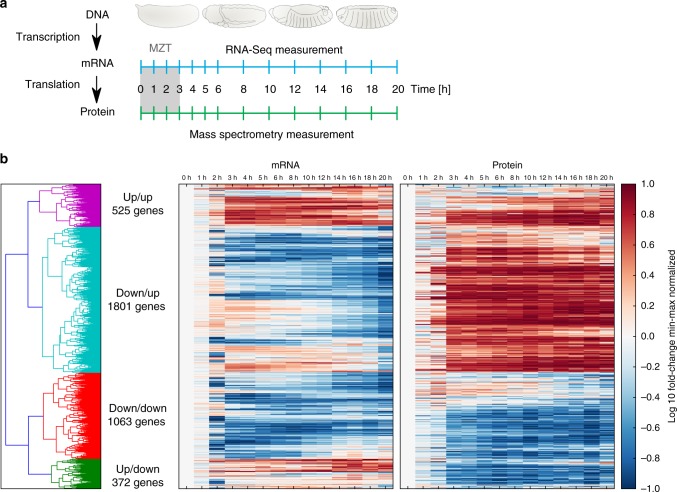
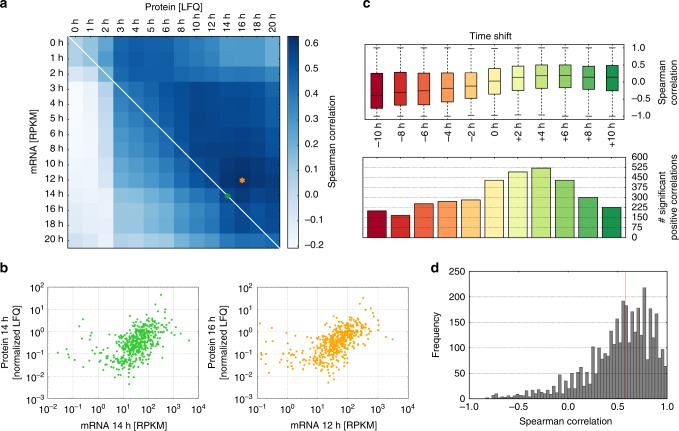
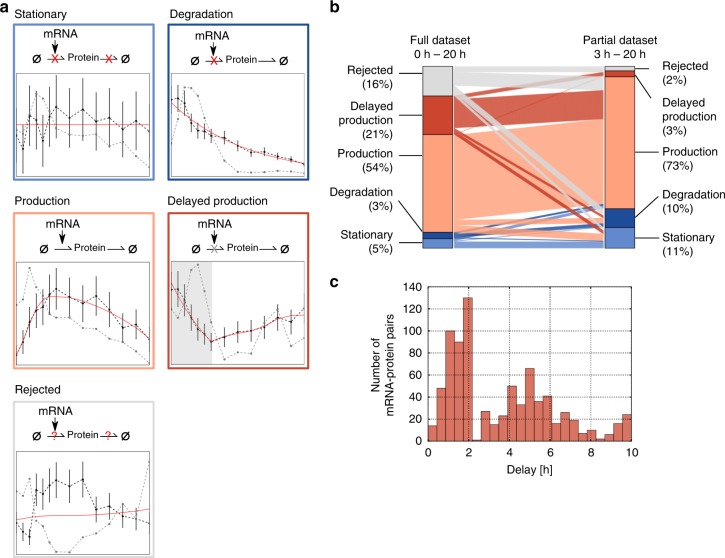
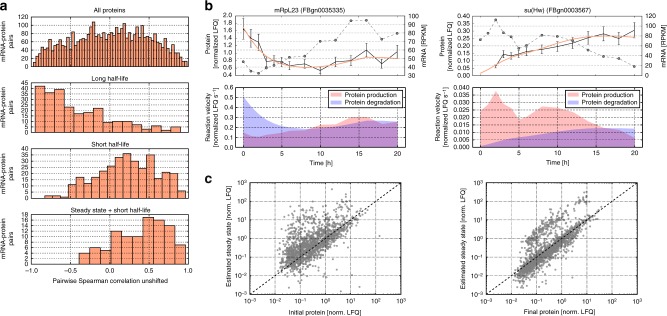
Even though proteins are produced from mRNA, the correlation between mRNA levels and protein abundances is moderate in most studies, occasionally attributed to complex post-transcriptional regulation. To address this, we generate a paired transcriptome/proteome time course dataset with 14 time points during Drosophila embryogenesis. Despite a limited mRNA-protein correlation (ρ = 0.54), mathematical models describing protein translation and degradation explain 84% of protein time-courses based on the measured mRNA dynamics without assuming complex post transcriptional regulation, and allow for classification of most proteins into four distinct regulatory scenarios. By performing an in-depth characterization of the putatively post-transcriptionally regulated genes, we postulate that the RNA-binding protein Hrb98DE is involved in post-transcriptional control of sugar metabolism in early embryogenesis and partially validate this hypothesis using Hrb98DE knockdown. In summary, we present a systems biology framework for the identification of post-transcriptional gene regulation from large-scale, time-resolved transcriptome and proteome data.


Conflict of interest statement

S.S. is currently employed at Boehringer Ingelheim International GmbH. The remaining authors declare no competing interests.

Figures

Fig. 1
Fig. 1
Paired transcriptome and proteome of Drosophila embryogenesis. a Time-points of paired mRNA and protein measurements during Drosophila embryonic development using RNA-Seq and mass spectrometry, respectively. The initial time point (0 h) represents egg deposition; the maternal-to-zygotic transition (MZT) occurs within the first 3 h of development. b Heatmaps of mRNA and protein time courses. The 3761 mRNA/protein pairs (y-axis), for which protein could be quantified in at least 10 of 14 time points, are shown for the developmental time points (x-axis). The color code indicates the mRNA and protein fold-changes relative to t= 0 h after min-max normalization between −1 and 1. Time courses are sorted according to hierarchical clustering using the Euclidean distance (see also dendrogram on the left). Time courses within each of the four clusters (green, red, blue, purple) roughly follow similar dynamics, reflecting concordant or opposing mRNA and protein dynamics (increase (up) or decrease (down))
Fig. 2
Fig. 2
Limited correlation between mRNA and protein levels. a Global RNA−protein correlation across all samples. Heatmap of Spearman correlation coefficients between protein abundance (x-axis; quantified using MaxLFQ), and mRNA levels (y-axis; expressed as RPKM values), at the same (diagonal) or shifted (off-diagonal) time points of embryonic development. Only the top 500 proteins showing largest absolute fold-changes compared to the 0 h time point were considered. Green and orange stars indicate maximum correlation between same and shifted time points, respectively. Corresponding scatter plots are shown in (b). b Maximum global RNA−protein correlation. Scatter plots showing correlation of mRNA (RPKM) and protein (LFQ) levels at 14 h (left, ρ= 0.56), or between mRNA at 12 h and protein at 16 h (right, ρ= 0.63). Chosen time points correspond to the orange and green stars marked in (a). c Local correlations relating the mRNA and protein time courses of individual genes were calculated using the Spearman correlation coefficient. Boxplots indicate the distribution of Spearman correlation coefficients for all 3761 mRNA−protein pairs (black line: median; boxes: quartiles; whiskers: 95-percentile) (upper panel). Time shifts between mRNA and protein dynamics were introduced by adding a constant to the time axis of the protein (0 h: no shift). Positive and negative values reflect that protein lags behind or is advanced relative to its mRNA, respectively. Number of mRNA−protein pairs with a significant (Student’s t test, two-sided, p< 0.05), positive correlation for each time shift (bottom panel). d Distribution of maximum Spearman correlation coefficients across all time shifts. For each individual mRNA−protein pair (n= 3761), the maximum correlation between the mRNA and protein time courses at any time shift between 0 h and +10 h was determined and considered in this histogram. The red line indicates the median of all correlation coefficients
Fig. 3
Fig. 3
Kinetic models quantitatively relate mRNA and protein dynamics. a Schematic representation of model variants incorporating protein synthesis and degradation (thin arrows). Red and gray crosses indicate absence or delayed onset of individual reaction steps, respectively. The measured mRNA time courses were used as a model input, and simulated protein output was fitted to the corresponding experimental data by tuning the kinetic parameters. Each of the four different model variants was fitted separately and the best model was selected (see Methods). If all four models were rejected, the protein was classified as potentially post-transcriptionally regulated. An exemplary model fit for each class is given (red line), alongside with corresponding mRNA (gray) and protein (black) expression. Error bars represent standard deviation in protein according to the chosen linear error model. b Model-based classification results for 3761 mRNA−protein pairs. Barplot showing fractions of proteins in each class for the full dataset (left; 0−20 h) or post-MZT only (right; 3−20 h). Connecting lines indicate the migration of one protein from one model class to another between both scenarios. c Distribution of estimated delay times of 800 proteins assigned to the delay model in which protein translation occurs only with a lag time after egg deposition
Fig. 4
Fig. 4
Kinetic models explain lack of mRNA−protein correlation. a The correlation of mRNA and protein time courses depends on protein dynamics and initial expression levels. Histograms for the distribution of Spearman correlations for all 3761 mRNA−protein pairs (top panel, n= 3761), proteins with long half-life (second panel, n= 260), proteins with short half-life (third panel, n= 331) and proteins with short half-life close to their estimated steady-state at the onset of embryogenesis (bottom panel, n= 101). See main text for details. b Examples of genes with inverse mRNA and protein dynamics. Left: For mRpL23 (FBgn0035335), mRNA level (dashed line) increased while protein levels (black line) decreased. Error bars represent standard deviation of protein according to the chosen linear error model. Model fit is shown as colored line. The lower panel shows the simulated velocities of protein production and degradation, which are initially unbalanced. Right: Conversely, for su(Hw) (FBgn0003567) the protein production velocity initially exceeds that of degradation, protein amount (black line) increased, while mRNA level decreases. c Protein levels early in development tend to deviate from the model-predicted protein steady-state. Measured protein levels for mRNA−proteins pairs classified into the production model (n= 2027) are plotted against estimated protein steady-states. Steady-state estimates were derived from the fitted model parameters as well as given mRNA concentrations at 0 h (left panel, Pearson correlation ρ= 0.61) and 20 h (right panel, Pearson correlation ρ= 0.79) using the equation α/λ * mRNA[t] (α: production rate; λ degradation rate and t time)
Fig. 5
Fig. 5
Protein classes are enriched for specific biological functions. Distinct GO terms are significantly (hypergeometric test, BH corrected p value < 0.05) overrepresented in the production and delay category as well as for the rejected class (indicated by color). GO terms were arranged according to their semantic similarity and a 2D projection was generated via multidimensional scaling. Each circle represents a single GO term and the size of each circle is proportional to the corrected p value (see legend)
Fig. 6
Fig. 6
Post-transcriptionally regulated proteins are enriched for RBP binding motifs. a Seven RBP sequence motifs are enriched in the group of potentially post-transcriptionally regulated proteins (adjusted enrichment p value < 0.05). In total we scanned for enrichment of 67 Drosophila-specific motifs corresponding to 51 distinct RBPs. For each RBP, only the sequence logo with highest enrichment is shown. b Putative post-transcriptional regulators are regulated at the protein expression level during Drosophila development. Measured protein profiles (black solid line—normalized LFQ) of four RBPs, alongside their corresponding mRNA expression (dashed gray line) and the best model fit (colored line) are presented. Error bars represent standard deviation of protein according to a linear error model. The expression level of the three remaining RBPs (RBP1-LIKE, ARET, and CG17838) were below the proteomics detection limit
Fig. 7
Fig. 7
Hrb98DE post-transcriptionally regulates glucose metabolism. a Proteome changes upon in vivo knockdown of HRB98DE during Drosophila development. Bars show the percentage of all genes within each protein class that are differentially expressed upon Hrb98DE knockdown. Absolute numbers are also shown (differentially expressed proteins in class/number of all proteins in class). Significant overrepresentation of differential expression is observed in the rejected and delayed-production categories and preferentially contain an Hrb98DE motif in their mRNA sequence, when compared to the background of all expressed genes (left bar). * indicates p < 0.05 using a hypergeometric test. b Transcriptome and proteome changes upon knockdown of HRB98DE in S2R+ cells, shown as a scatterplot of mRNA vs. protein fold-changes. Significant cases of only mRNA changing (pink) or only protein changing (light blue) are highlighted. Dashed lines indicate thresholds of fold-changes for mRNA (absolute log2 fold-change > 1.3, BH corrected p value < 0.05) or protein (absolute log2 fold-change > 1.5, nominal p value < 0.01). c Heatmap of fold-changes for mRNA and protein level of differentially expressed genes upon Hrb98DE knockdown in S2R+ cells (in 14 cases mRNA and protein are both significantly changing, in 26 cases only significant change on protein level, 4149 with no change of mRNA or protein). For genes with no significant change in either mRNA or protein only a subset of 20 randomly chosen genes is shown. d Splicing changes at the mRNA level upon knockdown of HRB98DE in S2R+ cells. Venn diagram showing differentially spliced genes upon Hrb98DE knockdown and their overlap with genes previously identified as Hrb98DE targets or genes annotated as regulators of glucose metabolic processes (GO:0010906). The previously identified Hrb98DE targets were defined by combining Hrb98DE targets reported by Blanchette et al. (2009), Ji and Tulin (2016) and mRNAs with the Hrb98DE binding motif. e Differentially spliced genes are enriched for Hrb98DE targets (blue striped bar) or genes annotated as regulators of glucose metabolic processes (red striped bar), when compared to the background of all detected genes (clear bars). ** denotes significance with a p value below 0.01 (hypergeometric test)

References

    1. de Sousa Abreu, R., Penalva, L. O., Marcotte, E. M. & Vogel, C. Global signatures of protein and mRNA expression levels. Mol. Biosyst. 10.1039/b908315d (2009). - PMC - PubMed
    1. Maier T, Güell M, Serrano L. Correlation of mRNA and protein in complex biological samples. FEBS Lett. 2009;583:3966–3973. doi: 10.1016/j.febslet.2009.10.036. - DOI - PubMed
    1. Liu Y, Beyer A, Aebersold R. On the dependency of cellular protein levels on mRNA abundance. Cell. 2016;165:535–550. doi: 10.1016/j.cell.2016.03.014. - DOI - PubMed
    1. Schwanhausser B, et al. Global quantification of mammalian gene expression control. Nature. 2011;473:337–342. doi: 10.1038/nature10098. - DOI - PubMed
    1. Ingolia NT, Ghaemmaghami S, Newman JRS, Weissman JS. Genome-wide analysis in vivo of translation with nucleotide resolution using ribosome profiling. Science. 2009;324:218–223. doi: 10.1126/science.1168978. - DOI - PMC - PubMed

Publication types