. 2019 Jan;25(1):75-81.
doi: 10.1038/s41591-018-0254-9. Epub 2018 Nov 26.

A CD4+ T cell population expanded in lupus blood provides B cell help through interleukin-10 and succinate

Affiliations

A CD4+ T cell population expanded in lupus blood provides B cell help through interleukin-10 and succinate

Simone Caielli et al. Nat Med. 2019 Jan.

Abstract

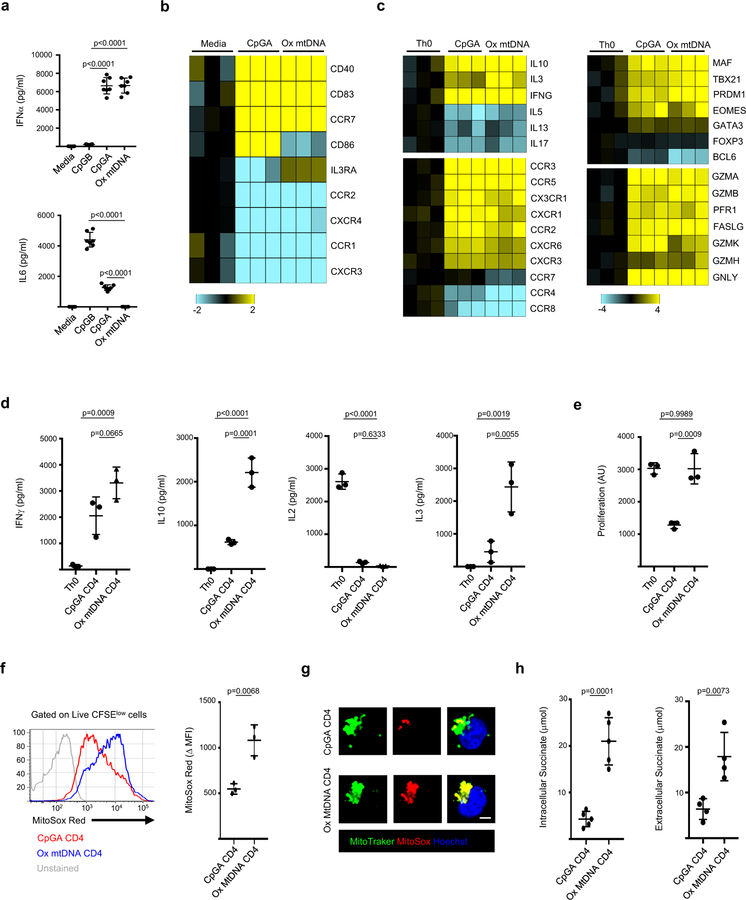
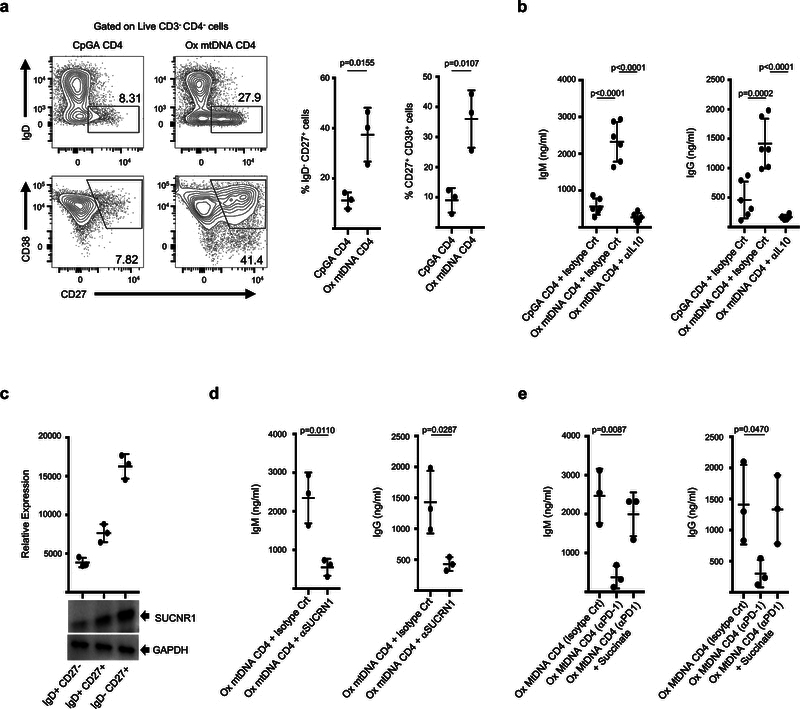
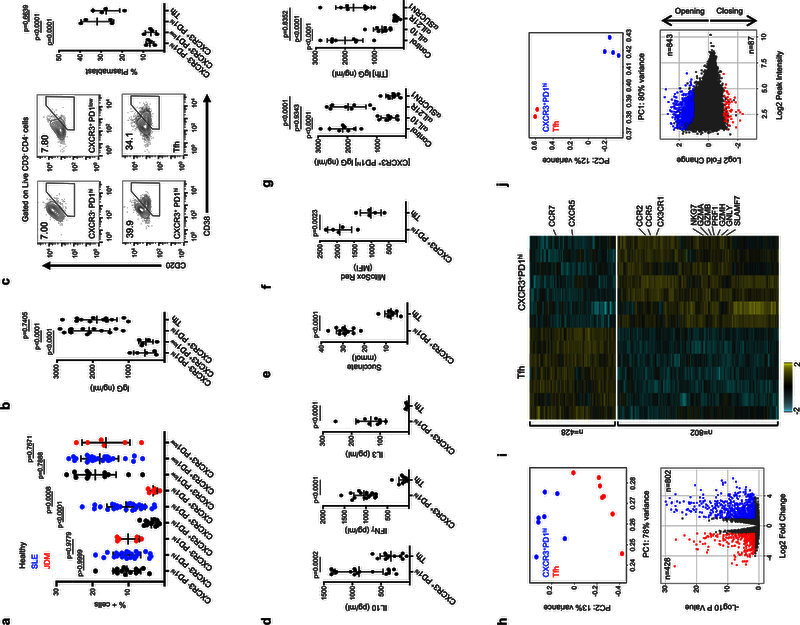
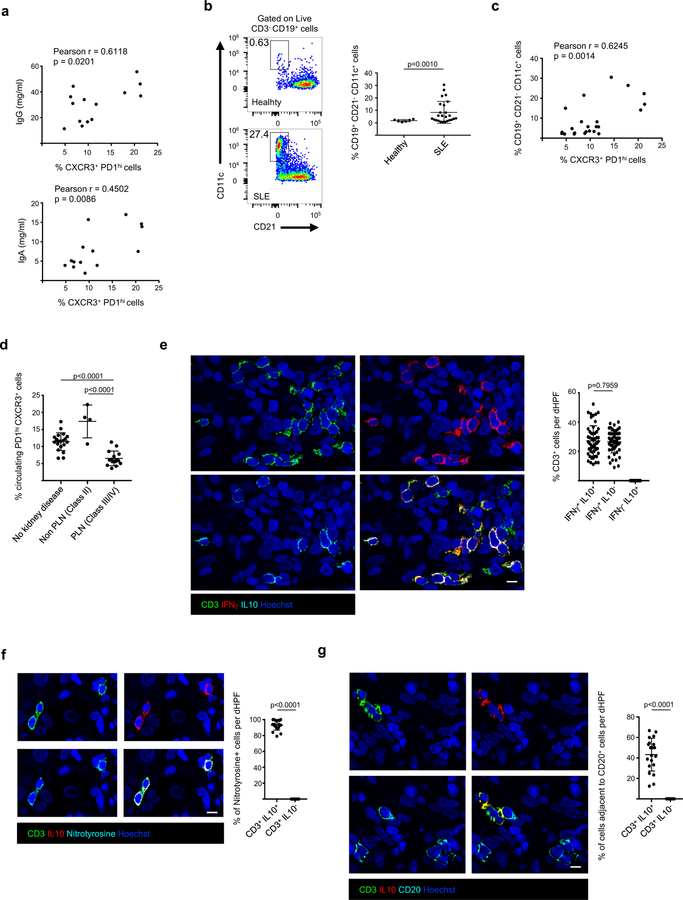
Understanding the mechanisms underlying autoantibody development will accelerate therapeutic target identification in autoimmune diseases such as systemic lupus erythematosus (SLE)1. Follicular helper T cells (TFH cells) have long been implicated in SLE pathogenesis. Yet a fraction of autoantibodies in individuals with SLE are unmutated, supporting that autoreactive B cells also differentiate outside germinal centers2. Here, we describe a CXCR5-CXCR3+ programmed death 1 (PD1)hiCD4+ helper T cell population distinct from TFH cells and expanded in both SLE blood and the tubulointerstitial areas of individuals with proliferative lupus nephritis. These cells produce interleukin-10 (IL-10) and accumulate mitochondrial reactive oxygen species as the result of reverse electron transport fueled by succinate. Furthermore, they provide B cell help, independently of IL-21, through IL-10 and succinate. Similar cells are generated in vitro upon priming naive CD4+ T cells with plasmacytoid dendritic cells activated with oxidized mitochondrial DNA, a distinct class of interferogenic toll-like receptor 9 ligand3. Targeting this pathway might blunt the initiation and/or perpetuation of extrafollicular humoral responses in SLE.


Conflict of interest statement

Competing financial interests

Figures

Figure 1
Figure 1. Ox mtDNA induces a unique pDC phenotype.
a, Cytokine profile of pDCs activated for 24 h with media, CpGB, CpGA or Ox mtDNA (n=7 independent experiments). b, Gene expression profile of pDCs in response to CpGA or Ox mtDNA (n=3 independent experiments). c, Gene expression profile of Th0, CpA and Ox mtDNA CD4+ T cell (n=3 independent experiments). d, e Cytokine profile (d) and proliferation (e) of Th0, CpGA or Ox mtDNA CD4+ T cells upon reactivation with CD3/CD28 (n=3 independent experiments). f, g MtROS production by CpGA or Ox mtDNA CD4+ T cells was assessed by flow cytometry (f, n=3 independent experiments) or by immunofluorescence microscopy (g, one representative of three independent experiments). Scale bar = 7 μm. h, Intracellular (left) and extracellular (right) succinate levels in CpGA or Ox mtDNA CD4+ T cells (n=5 independent experiments). Shown are mean ± s.e.m.; statistical analysis by nonparametric one-way ANOVA (a-e) and two-tailed nonparametric unpaired t-test at 95% CI (f, h).
Figure 2
Figure 2. Ox mtDNA CD4+ T cells help B cells through IL10 and succinate.
a, Percentage of IgD CD27+ and CD27+ CD38+ B cells upon co-culture with CpGA or Ox mtDNA CD4+ T cells (n=3 independent experiments). Representative flow cytometry density plots are also shown. b, IgM and IgG levels in the supernatants from CpGA or Ox mtDNA CD4+ T cells and naïve B cell co-cultures (n=6 independent experiments). c, Immunoblot analysis of succinate receptor (SUCNR1) expression by purified human B cells subsets (n=3 independent experiments). d, IgM and IgG levels in the supernatants from Ox mtDNA CD4+ T cell and naïve B cell co-cultures in the presence of anti-SUCRN1 (n=3 independent experiments). e, IgM and IgG levels in the supernatants from co-cultures of Ox mtDNA CD4+ T cells, generated in the presence of isotype control or anti-PD1 antibody, and naïve B cells (n=3 independent experiments). Shown are mean ± s.e.m.; statistical analysis by nonparametric one-way ANOVA (b) and two-tailed nonparametric unpaired t-test at 95% CI (a, d, e).
Figure 3
Figure 3. Memory CXCR5 CXCR3+ PD1hi CD4+ T cells represent the blood counterpart of Ox mtDNA CD4+ T cells.
a, Percentage of CXCR3 PD1hi, CXCR3+ PD1hi and CXCR3+ PD1low CD4+ T cells in the blood CD45RA CXCR5 compartment of healthy controls (n=13), SLE patients (n=27) or JDM patients (n=6). b-c, IgG levels (b, n=12 independent experiments) and CD20/CD38 expression (c, n=4 independent experiments) on naïve B cells co-cultured with CXCR3 PD1hi CD4+ T cells, CXCR3+ PD1hi CD4+ T cells, CXCR3+ PD1low CD4+ T cells or Tfh cells. d, Cytokine profile of sorted CXCR3+ PD1hi CD4+ T cells and Tfh cells (n=18 independent experiments). e-f, Succinate (e, n=12 independent experiments) and mtROS (f, n=5 independent experiments) levels in CXCR3+ PD1hi CD4+ T cells and Tfh cells. g, IgG levels in the supernatants from co-cultures of CXCR3+ PD1hi CD4+ T cells or Tfh cells and naïve B cells (n=8 independent experiments). h, Top: principal component analysis (PCA) of RNA-seq data corresponding to genes differentially expressed between CXCR3+ PD1hi CD4+ T cells and Tfh cells (n=7 independent experiments). Bottom: volcano plot of up-regulated genes in each population (DESeq2, Wald test, adjusted p-value <0.05 and fold change >2). i, Heat map of differentially expressed transcripts in CXCR3+ PD1hi CD4+ T cells and Tfh cells (n=7 independent experiments). j, Top: PCA of ATAC-seq data on peaks differentially accessible between CXCR3+ PD1hi CD4+ T cells (n=4 independent experiments) and Tfh cells (n=2 independent experiments). Bottom: chromatin sites with differential accessibility. Plot indicates the number of opening/closing chromatin peaks in CXCR3+ PD1hi CD4+ T cells when compared to Tfh cells (EdgeR, adjusted p-value < 0.05 and fold change >2). Shown are mean ± s.e.m.; statistical analysis by nonparametric one-way ANOVA (a-c; g) and two-tailed nonparametric unpaired t-test at 95% CI (d-f).
Figure 4
Figure 4. IL10+ IFNγ+ ROS+ PD1+ CD4+ T cells accumulate in PLN lesions.
a, Pearson correlation analysis between the frequency of SLE blood CXCR3+ PD1hi CD4+ T cells and serum immunoglobulin IgG and IgA levels (n=14 biologically independent samples). b, Representative flow cytometry density plot (left) and percentage of CD19+CD21CD11c+ B cells (ABCs) among CD3 CD19+ cells (right) in the blood of healthy donors (n=6) or SLE patients (n=25). c, Pearson correlation analysis between the frequency of blood CXCR3+ PD1hi CD4+ T cells and ABCs. d, Percentage of CXCR3+ PD1hi CD4+ T cells in blood of SLE patients with nephritis Class II (n=4 biologically independent samples), Class III/IV (PLN; n=15 biologically independent samples) or without kidney disease (n=20 biologically independent samples). e, Representative immunofluorescence microscopy of CD3, IFNγ and IL10 staining in the kidney of a class IV LN section. The percentage of CD3+ IFNγ+ IL10+; CD3+ IFNγ+ IL10 and CD3+ IFNγ IL10+ cells is also shown (n=10 class III/IV PLN samples; 5 dHPF [digital High Power Field] per sample). f, Representative immunofluorescence microscopy of CD3, Nytrotyrosine and IL10 staining in the kidney of a class IV LN section. The percentage of CD3+ IL10+ Nytrotyrosine+ and CD3+ IL10 Nytrotyrosine+ cells is also shown (n=5 class III/IV PLN samples; 4 dHPF per sample). g, Representative immunofluorescence microscopy of CD3, IL10 and CD20 staining in the kidney of a class IV LN section. The percentage of CD3+ IL10+ and CD3+ IL10 cells adjacent to CD20+ B cells is also shown (n=5 class III/IV PLN samples; 4 dHPF per sample). Scale bar = 10 μm. Shown are mean ± s.e.m.; statistical analysis by nonparametric one-way ANOVA (d) and two-tailed nonparametric unpaired t-test at 95% CI (Welch’s correction b; f-g).

Comment in

References

    1. Tsokos GC Systemic lupus erythematosus. The New England journal of medicine 365, 2110–2121 (2011). - PubMed
    1. Tipton CM, et al. Diversity, cellular origin and autoreactivity of antibody-secreting cell population expansions in acute systemic lupus erythematosus. Nat Immunol 16, 755–765 (2015). - PMC - PubMed
    1. Caielli S, et al. Oxidized mitochondrial nucleoids released by neutrophils drive type I interferon production in human lupus. J Exp Med 213, 697–713 (2016). - PMC - PubMed
    1. Guiducci C, et al. TLR recognition of self nucleic acids hampers glucocorticoid activity in lupus. Nature 465, 937–941 (2010). - PMC - PubMed
    1. Means TK, et al. Human lupus autoantibody-DNA complexes activate DCs through cooperation of CD32 and TLR9. J Clin Invest 115, 407–417 (2005). - PMC - PubMed

Publication types

MeSH terms