. 2018 Nov 26;8(1):17348.
doi: 10.1038/s41598-018-35587-x.

DNA methylation dynamics during embryonic development and postnatal maturation of the mouse auditory sensory epithelium

Affiliations

DNA methylation dynamics during embryonic development and postnatal maturation of the mouse auditory sensory epithelium

Ofer Yizhar-Barnea et al. Sci Rep. .

Abstract

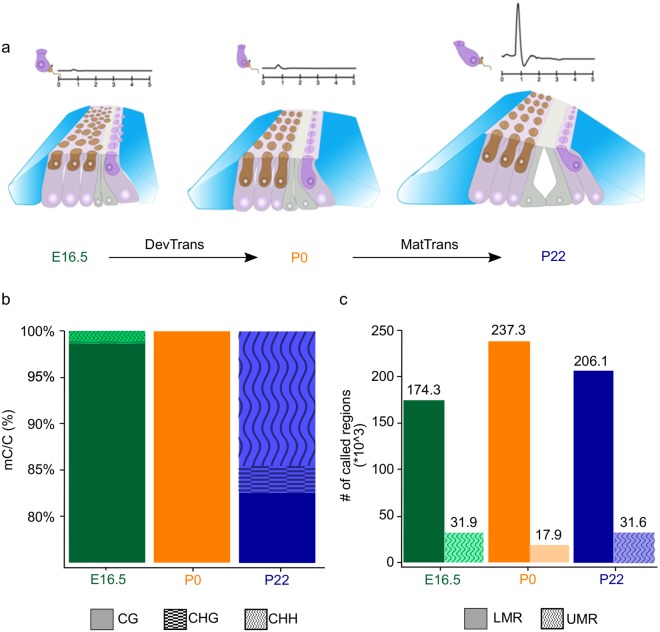
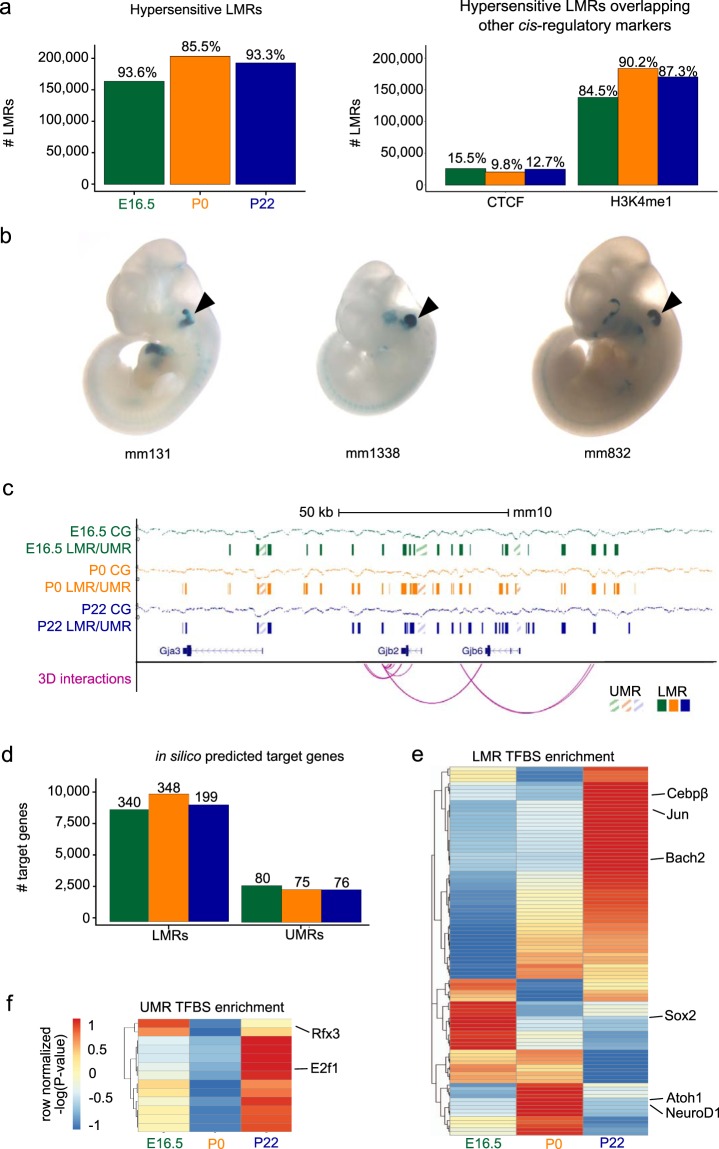
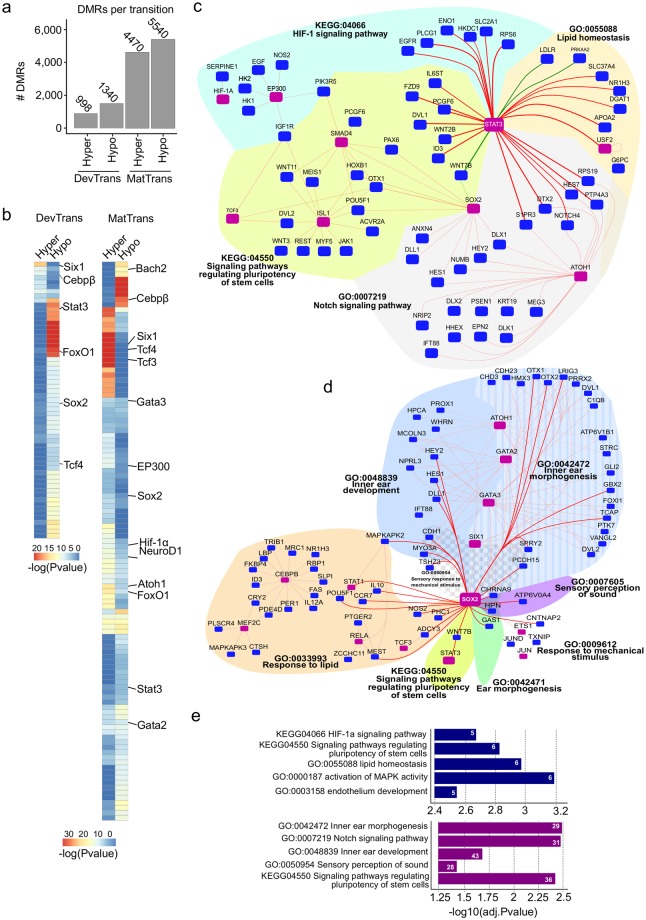
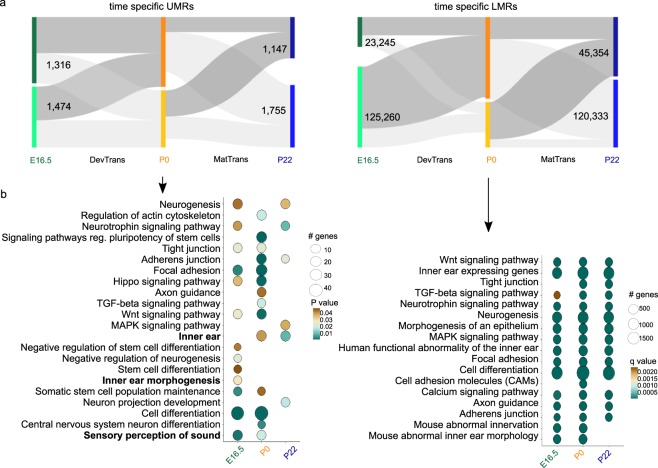
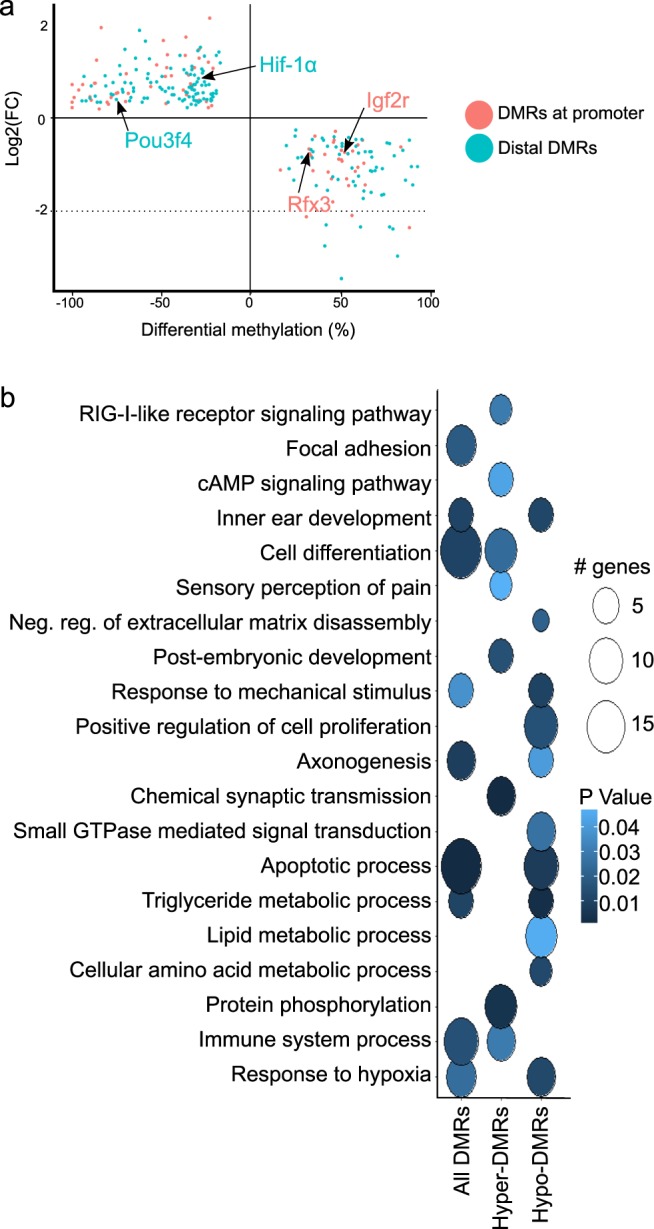
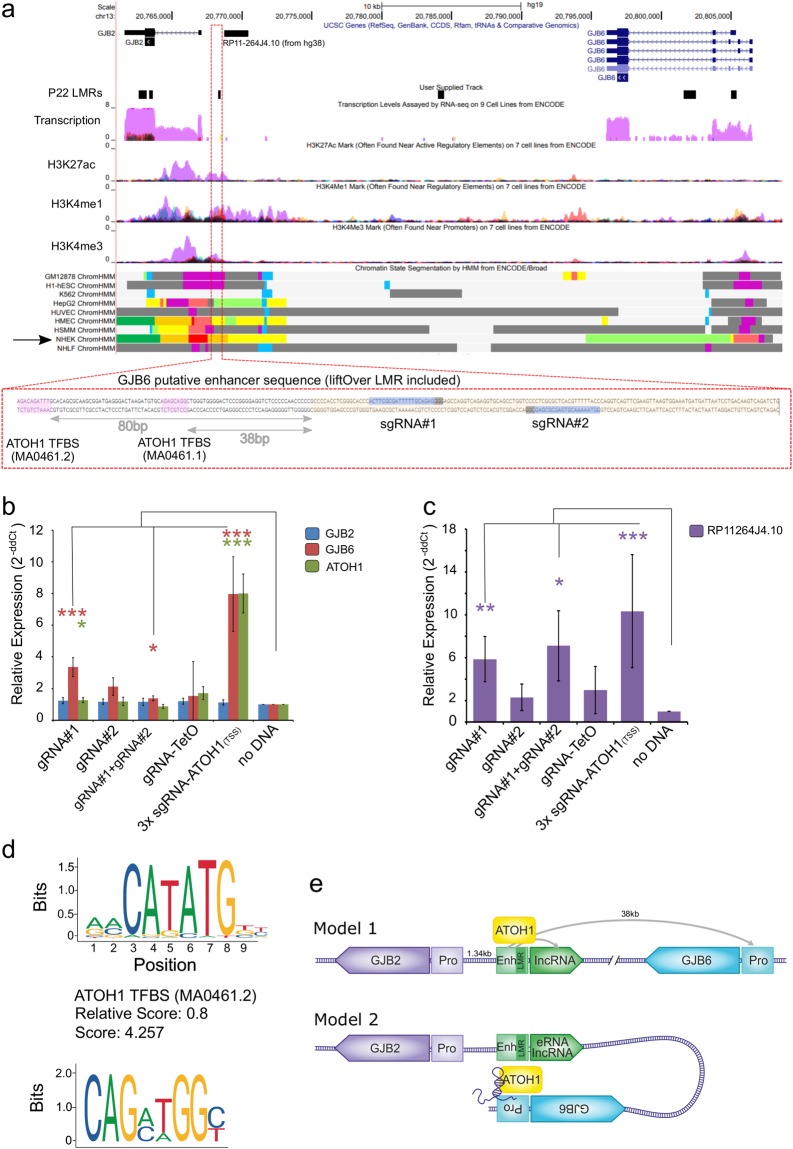
The inner ear is a complex structure responsible for hearing and balance, and organ pathology is associated with deafness and balance disorders. To evaluate the role of epigenomic dynamics, we performed whole genome bisulfite sequencing at key time points during the development and maturation of the mouse inner ear sensory epithelium (SE). Our single-nucleotide resolution maps revealed variations in both general characteristics and dynamics of DNA methylation over time. This allowed us to predict the location of non-coding regulatory regions and to identify several novel candidate regulatory factors, such as Bach2, that connect stage-specific regulatory elements to molecular features that drive the development and maturation of the SE. Constructing in silico regulatory networks around sites of differential methylation enabled us to link key inner ear regulators, such as Atoh1 and Stat3, to pathways responsible for cell lineage determination and maturation, such as the Notch pathway. We also discovered that a putative enhancer, defined as a low methylated region (LMR), can upregulate the GJB6 gene and a neighboring non-coding RNA. The study of inner ear SE methylomes revealed novel regulatory regions in the hearing organ, which may improve diagnostic capabilities, and has the potential to guide the development of therapeutics for hearing loss by providing multiple intervention points for manipulation of the auditory system.


Conflict of interest statement

The authors declare no competing interests.

Figures

Figure 1
Figure 1
General features of inner ear sensory epithelium (SE) methylomes. (a) Illustration of the inner ear SE composition of sensory hair cells (brown, dark purple) and non-sensory supporting cells (blue, grey, light purple) at E16.5, P0, and P22. Representative auditory brainstem responses (ABR) are shown above each time point. DevTrans: Development Transition, represents the methylation dynamics for the P0 compared to E16.5; MatTrans: Maturation Transition, represents the methylation dynamics for the P22 vs P0 development. (b) Distribution of all methylated cytosines in CpG (mCG) (solid), non-CpG CHG (checkered), and non-CpG CHH (waved) contexts for the three time points. The figure represents merged data from two independent biological replicates for each time point. The average genomic coverage was 19.5X in E16.5, 11.1X in P0, and 15.1X in P22. (c) Number of low-methylated regions (LMRs) (solid) and unmethylated regions (UMRs) (dotted) at each time point.
Figure 2
Figure 2
Putative regulatory landscape of the inner ear SE. (a) Right bar plot shows the number of low-methylated regions (LMRs) overlapping known DNase I Hypersensitive Sites (DHS) from the mouse ENCODE project. The numbers on each bar represent the percent overlap with respect to all LMRs. Left bar plot shows the number of hypersensitive LMRs that overlap CTCF binding sites and H3K4me1 enhancer peaks. The numbers on each bar denote percent overlaps. (b) Examples of experimentally validated mouse non-coding fragments with otic (ear) enhancer activity as assessed in transgenic mice from Vista Enhancer Browser for which we found an overlap with LMRs at one of the three time points. (c) Browser shot of the Gjb2 gene locus, illustrating percent methylation levels, LMRs, unmethylated regions (UMRs) and their putative interactions with target genes. (d) Bar plot showing the number of putative target genes interacting with LMRs and UMRs. The numbers on each bar denote the count of known deafness target genes. (e, f) Heatmap of row normalized -log(P-value) for the relative enrichment across the three time points for transcription factor (TF) motifs present in LMRs (e) UMRs (f) and filtered for expression. Representative TFs are shown on the side.
Figure 3
Figure 3
Methylation dynamics across development and maturation transitions. (a) Bar plot showing the number of hyper- and hypo-differentially methylated regions (DMRs) identified in DevTrans and MatTrans. (b) Heatmap representation of enriched transcription factor binding site (TFBS) motifs in DMRs for each transition. (c, d) In silico transcriptional regulatory networks based on DMR target gene interactions during DevTrans (green connecting line) and MatTrans (red connecting line). Known deafness transcription factors (TFs)/genes are marked by purple squares. TF-target gene interactions are clustered according to common GO terms (indicated by various color and patterned filled areas). Centralized specific TF in silico transcriptional regulatory networks around the hair cell marker, Stat3 (c) or supporting cell marker Sox2 (d). All direct interactions with centralized TFs are indicated by bold lines. (e) The enriched GO biological process terms and pathways for the overall regulatory networks of DevTrans (top) and MatTrans (bottom) (Table S7), number of GO term connected genes are shown in white.
Figure 4
Figure 4
Analysis of time point-specific unmethylated region (UMR) and low-methylated region (LMR) putative regulatory regions. (a) Time point-specific UMRs (5,692) and LMRs (314,192) and their dynamics through the time points, represented as Sankey plots; regions defined at a specific time point as UMR/LMR (dark grey) and regions not defined as UMR/LMR (light grey). (b) GO term enrichment analysis of time point-specific UMR (top) and time point-specific LMR (bottom) associated genes; for UMR analysis, Circle fill is according to P value (<0.05) and for time point-specific LMR according to q value (FDR < 0.05). Circle diameter is proportional to the number of genes associated with each term.
Figure 5
Figure 5
Gene expression and DNA methylation correlation for DevTrans. (a) Scatter plot of the differential methylation (P0/E16.5, percentage) at promoter and distal DMRs plotted against log2 of the fold change for the RNA-seq expression data (P0/E16.5, RPKM) of the putative target gene. Only genes whose expression is anti-correlated with the methylation level at associated DMR are shown, that is, expression increases (FC is positive) and methylation decreases (difference is negative) or vice versa. (b) GO term enrichment analysis of genes shown in a. Circle fill is according to P value (<0.05) and diameter is proportional to the number of genes associated with each term.
Figure 6
Figure 6
Inner ear sensory epithelium (SE) low-methylated regions (LMRs) are informative about human deafness. (a) Examples of experimentally validated mouse non-coding fragments with otic (ear) enhancer (black arrowhead) activity as assessed in transgenic mice from the VISTA Enhancer Browser for which we found overlap with lifted over LMRs at one of the three time points. (b) Browser shot of hearing-related variants at mouse-to-human LMRs and their target gene interactions on chromosome 6p21. Known interactions are shown as solid lines, predicted interactions as dashed lines. (c) Browser shot of mouse-to-human LMRs and known interactions around the Pendred syndrome gene SLC26A4. Layered H3K27ac from seven cell types and DHS data are shown in (b) and (c) to illustrate how SE LMRs can assist in the identification of cis-regulatory elements of interest.
Figure 7
Figure 7
CRISPR-on modulation of GJB6 and non-coding lncRNA RP11-264J4.10 expression via a putative enhancer. (a) UCSC browser snapshot presenting the candidate enhancer lifted over from mouse (mm10) to human (hg19) (track: “P22 lifted LMRs”, black box indicators); additional information derived from ENCODE regulation hub is presented to support the characterization of the candidate sequence as an enhancer (track: ‘transcription’ - purple signal = NHEK cell line, track: ‘NHEK ChromHMM’ – orange indicating ‘Active enhancer’). Below, zoomed view of the candidate sequence, with the location of the lifted-over LMR, gRNA targets and ATOH1 TFBS indicated. (b, c) Expression of GJB2, GJB6 and ATOH1 (b) and RP11-264J4.10 ncRNA (c) measured by qRT-PCR (normalized to GAPDH, compared to ‘no DNA’, n = 4–5, ***p < 0.01, *p < 0.05). (d) ATOH1 transcription factor binding motif found at the candidate enhancer, score is calculated by JASPAR. (e) Suggested mechanism of GJB6 regulation by the putative enhancer, shown in two models. Model 1 depicts a physical distal interaction between the GJB2 proximal putative enhancer (yellow box) and the GJB6 promoter (light orange box) mediated by ATOH1 and/or the lncRNA (purple). Model 2 demonstrates the folding of the chromatin, linking the putative enhancer with the GJB6 promoter, mediated by ATOH1 and/or the lncRNA.

References

    1. Groves AK, Fekete DM. Shaping sound in space: the regulation of inner ear patterning. Development. 2012;139:245–257. doi: 10.1242/dev.067074. - DOI - PMC - PubMed
    1. Kelley MW. Regulation of cell fate in the sensory epithelia of the inner ear. Nat. Rev. Neurosci. 2006;7:837. doi: 10.1038/nrn1987. - DOI - PubMed
    1. Koffler T, Ushakov K, Avraham KB. Genetics of hearing loss: syndromic. Otolaryngol. Clin. North Am. 2015;48:1041–1061. doi: 10.1016/j.otc.2015.07.007. - DOI - PMC - PubMed
    1. Dror AA, Avraham KB. Hearing impairment: a panoply of genes and functions. Neuron. 2010;68:293–308. doi: 10.1016/j.neuron.2010.10.011. - DOI - PubMed
    1. Richardson GP, de Monvel JB, Petit C. How the genetics of deafness illuminates auditory physiology. Ann. Rev. Physiol. 2011;73:311–334. doi: 10.1146/annurev-physiol-012110-142228. - DOI - PubMed

Publication types

MeSH terms