. 2019 Jan;51(1):96-105.
doi: 10.1038/s41588-018-0274-x. Epub 2018 Nov 26.

Gain-of-function DNMT3A mutations cause microcephalic dwarfism and hypermethylation of Polycomb-regulated regions

Affiliations

Gain-of-function DNMT3A mutations cause microcephalic dwarfism and hypermethylation of Polycomb-regulated regions

Patricia Heyn et al. Nat Genet. 2019 Jan.

Abstract

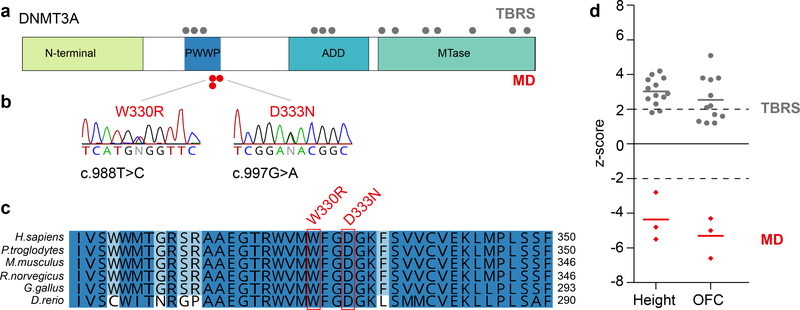
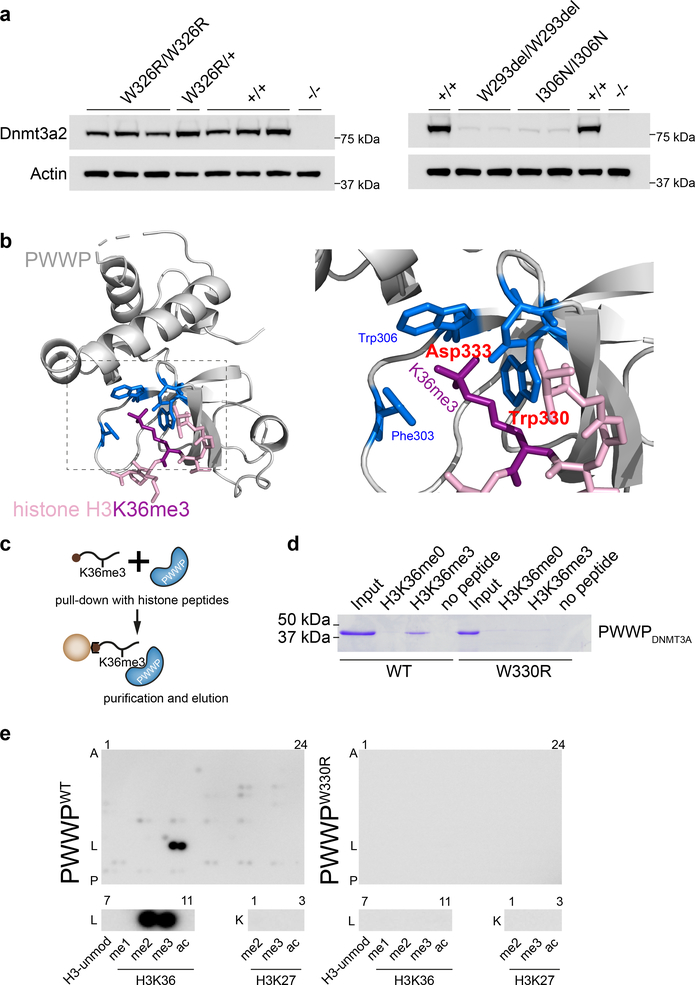
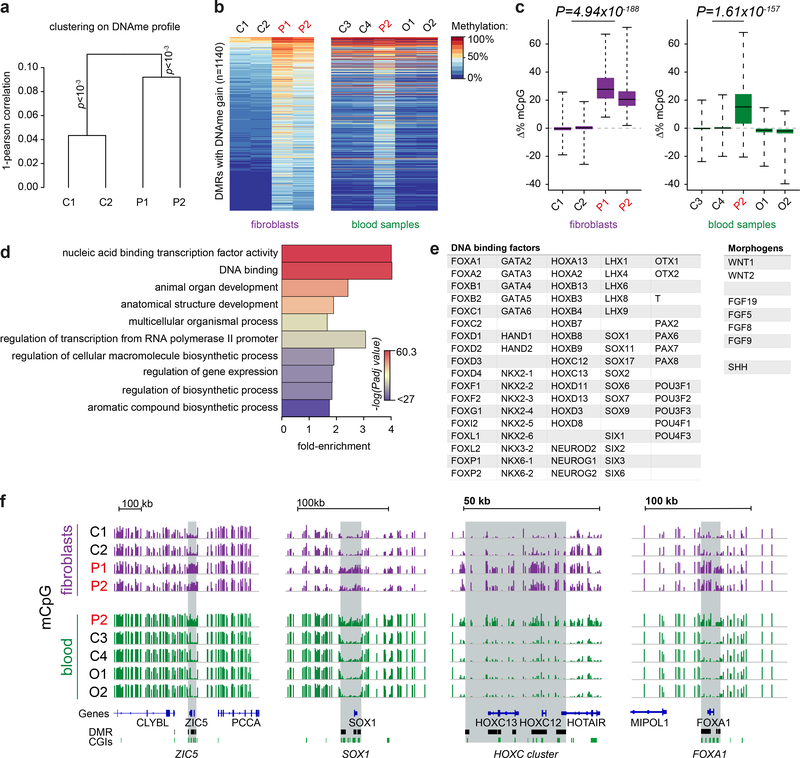
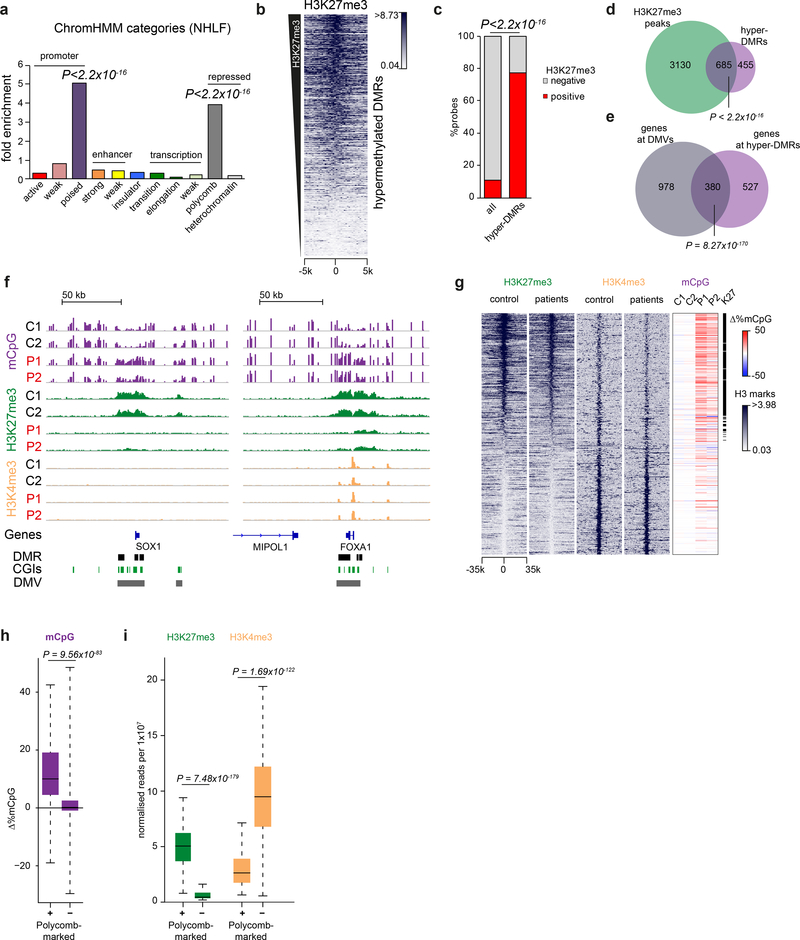
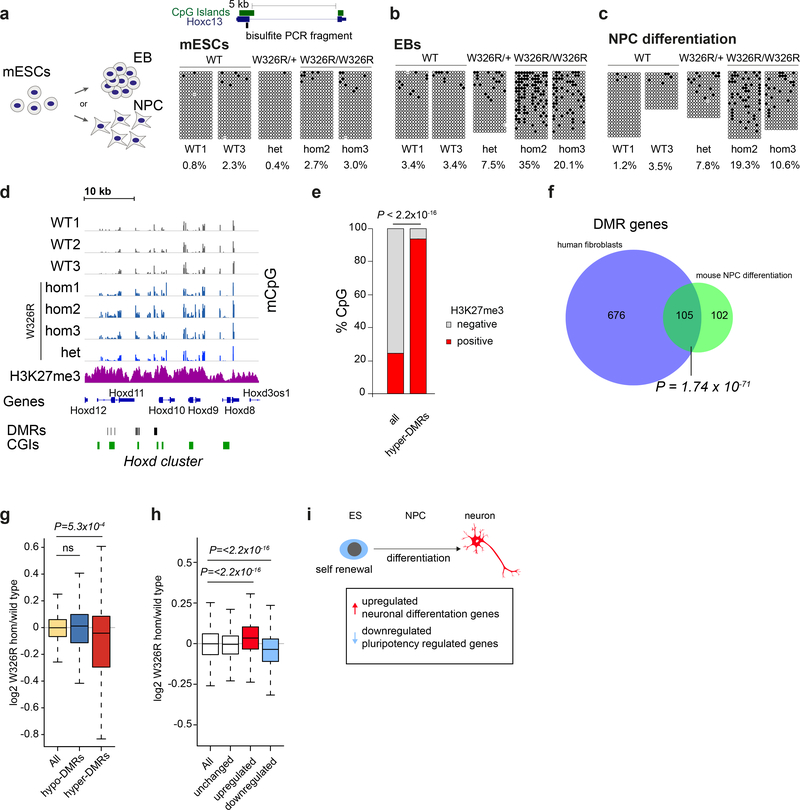
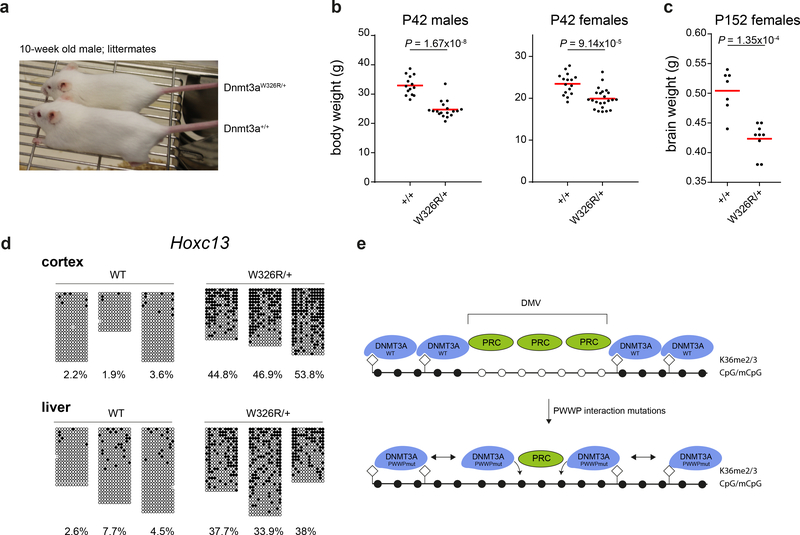
DNA methylation and Polycomb are key factors in the establishment of vertebrate cellular identity and fate. Here we report de novo missense mutations in DNMT3A, which encodes the DNA methyltransferase DNMT3A. These mutations cause microcephalic dwarfism, a hypocellular disorder of extreme global growth failure. Substitutions in the PWWP domain abrogate binding to the histone modifications H3K36me2 and H3K36me3, and alter DNA methylation in patient cells. Polycomb-associated DNA methylation valleys, hypomethylated domains encompassing developmental genes, become methylated with concomitant depletion of H3K27me3 and H3K4me3 bivalent marks. Such de novo DNA methylation occurs during differentiation of Dnmt3aW326R pluripotent cells in vitro, and is also evident in Dnmt3aW326R/+ dwarf mice. We therefore propose that the interaction of the DNMT3A PWWP domain with H3K36me2 and H3K36me3 normally limits DNA methylation of Polycomb-marked regions. Our findings implicate the interplay between DNA methylation and Polycomb at key developmental regulators as a determinant of organism size in mammals.


Conflict of interest statement

Competing Interests:

The authors declare no competing interests.

Figures

Fig. 1|
Fig. 1|. De novo mutations in DNMT3A cause microcephalic dwarfism.
a, Schematic of DNMT3A protein and domains. Position of microcephalic dwarfism (MD) mutations (red) and Tatton-Brown-Rahman syndrome (TBRS) overgrowth (grey) mutations (Tatton-Brown et al. 2014) (MTase, DNA methyltransferase domain) b, The heterozygous de novo c.988T>C mutation results in substitution of a Tryptophan residue (patient 1 and 2). The heterozygous de novo c.997G>A mutation results in substitution of an Aspartic acid residue (patient 3). Both residues are conserved in vertebrates c, and replaced with a physiochemically dissimilar residue: Arginine (p.W330R) and Asparagine (p.D333N) respectively. Sequence alignments, Clustal Omega. d, The W330R and D333N mutations cause extreme growth failure and microcephaly (red diamonds, n=3 independent patients), in direct contrast to DNMT3A overgrowth patients (grey circles, n=13 and n=12 patients, respectively for height and OFC). Height and head circumference (OFC) plotted as z-scores (s.d. for population mean adjusted for age and sex). Dashed lines at −2 and +2 s.d indicate 95% confidence interval for general population. Horizontal bars, mean values for respective patient groups. TBRS morphometric data reproduced from Tatton-Brown et al. 201411.
Fig. 2|
Fig. 2|. The W330R mutation impairs binding of di/tri-methylated H3K36.
a, Murine Dnmt3aW326R protein, containing the orthologous substitution to W330R, is stably expressed, in contrast to corresponding overgrowth PWWP mutations (W293del, I306N). Immunoblotting of cell lysates from CRISPR/Cas9 genome-edited mouse embryonic stem cells (mESC). Multiple independent cell lines, with genotypes as indicated. Representative of n=3 (WT, W326R lines) and n=2 (W293del, I306N) independent experiments. Immunoblots are cropped. b, Structural modelling of the PWWP domain predicts the W330R mutation to disrupt interaction with H3K36me3. The highlighted amino acids (blue) form a cage that binds trimethylated lysine 36 (purple). The amino acids altered in MD patients (tryptophan at codon 330 and aspartate at codon 333) are labelled in red. Backbones of PWWP and histone H3 N-terminal tail depicted in grey and pink respectively. c,d, Recombinant PWWPWT but not PWWPW330R protein binds H3K36me3 peptide. (c) Schematic of streptavidin pull-down of biotinylated histone peptides. (d) Coomassie stained gel of eluted protein from histone peptide pull-downs (cropped). Input, 9% of total protein. Histone peptide H3 (aa 21–44). H3K36me0 corresponding unmodified peptide. Representative of n=3 expts. e, PWWPW330R does not bind H3K36me2, H3K36me3 or other histone-tail modifications. MODified™ Histone Peptide Array representing 384 distinct or combinatorial histone modifications probed with recombinant PWWP proteins as indicated. Below, magnified insets of row L7–11 (histone 3 aa26–45) and K1–3 (histone 3 aa16–35) demonstrates that PWWPWT binds to H3K36me2 (L9) and H3K36me3 (L10), but PWWPW330R does not. Representative of n = 2 independent expts; see also Supplementary Fig. 1b.
Fig. 3|
Fig. 3|. DNA methylation is increased at key developmental gene loci in patient cells.
a, DNA methylation in DNMT3AW330R/+ patient fibroblasts significantly differs from controls. Unsupervised Ward clustering based on Pearson correlations of all probes from Illumina EPIC arrays for n=2 independent patients and 2 independent controls. Pvclust, approximately-unbiased p-values using 1000 bootstraps. b,c, A methylation signature is evident in DNMT3AW330R patient cells across tissues, comprising 1140 sites of increased methylation. (b) Heat map of differentially methylated regions (DMRs) hypermethylated in patient fibroblasts and peripheral blood leukocytes (PBLs). P1, P2, patients (DNMT3AW330R/+); C1-C4 healthy controls; O1, O2, TBRS overgrowth patients. (c) Quantification of DNA methylation for DMRs (n=1140 DMRs) depicted in panel (b). Box, 25th-75th percentile; whiskers, full data range; centre line, median; Δ%mCpG, percent change of methylation relative to mean of control. p value, two-sided, paired Wilcoxon rank sum tests for mean of control probes vs mean patient probes. d, Gene ontology analysis of genes associated with hypermethylated DMRs. Top ten significant hits shown. Color indicates Benjamini-Hochberg adjusted FDR significance level, genes associated with DMR probes (n=907 genes) versus genes associated with all probes on the array (n=18159), two-sided Fisher’s exact test. e, Exemplars of DNA binding factors and morphogens associated with DMRs. f, Representative genome browser views of hypermethylated DMRs demonstrating increased DNA methylation at key developmental genes in microcephalic dwarfism patient samples. All tracks scaled 0–100% mCpG, DNA methylation. CGI, CpG islands.
Fig. 4|
Fig. 4|. DNA methylation is increased at polycomb-marked DNA methylation valleys.
a, Hypermethylated DMRs in DNMT3AW330R patient cells are significantly enriched at poised promoters and polycomb-repressed regions. Plotted, enrichment of chromatin state categories as identified in normal human lung fibroblasts (NHLF) by ChromHMM in patient hypermethylated DMRs. P-values for each enriched category, two-sided Fisher’s exact test hyper-DMR probes (n=10871 probes) vs all probes (n=403348). (ChromHMM: software annotating Chromatin state by a Hidden Markov Model). b-d, H3K27me3 sites in control dermal fibroblasts correlate with hypermethylated DMRs in patient cells. (b) Heat map of normalised H3K27me3 ChIP-seq reads in control fibroblasts (mean of C1, C2) centred on DMRs, ranked by DMR mean H3K27me3 levels. Scale indicates normalised read counts. Window size, 250 bp. (c,d) Quantification of H3K27me3 enrichment at hypermethylated DMRs. (c) Percentage of Infinium array probes overlapping H3K27me3 peaks in control fibroblasts (red, mean of C1 and C2). All, all probes on the array (n=403348 probes). Hyper-DMRs, probes within hypermethylated DMRs (n=10871). p-value, two-sided Fisher’s exact test. (d) Venn diagram displaying overlap of hypermethylated DMRs (n=1140) with H3K27me3 peaks (n=3815) in controls. p value, two-sided Fisher’s exact test. (e) Genes associated with hypermethylated DMRs (n=907 genes), significantly overlap genes associated with DMVs (n=1,358). Two-sided Fisher’s exact test, genes associated with hyper-DMRs vs all genes represented on array. (f) Increased methylation is distributed across H3K27me3 regions, but excluded from H3K4me3 peaks. Representative IGV genome browser views. For all tracks: DNA methylation (magenta, scale 0–100%), H3K27me3 (green, scale 0–4 scaled read counts per 107 reads), H3K4me3 (yellow, scale 0–8 scaled read counts per 107 reads) in control (C1, C2) and patient (P1, P2) dermal fibroblasts. DNA methylation data for SOX1 and FOXA1 (Fig. 3f) are shown again for comparison with H3K27me3 and H3K4me3. g, Polycomb-marked DNA methylation valleys (DMVs) are hypermethylated in DNMT3AW330R/+ patients. Shown, heat maps of n=1,152 DMVs of normalised H3K27me3/K4me3 read counts for control (C1,C2 mean) and patient (P1,P2 mean) fibroblasts, centred on DMVs and ranked by mean H3K27me3 levels in controls. Δ%mCpG, percent change of DMV methylation relative to mean of controls. Window size, 500bp. h, i, Quantification of data shown in panel g. (h) Polycomb-marked DMVs exhibit increased methylation in patient cells, while non-polycomb associated regions do not. Y-axis indicates mean difference between patients and controls: 0, no change; >0 increased in patients; <0 decreased in patients. (i) Polycomb-marked DMVs with increased methylation in patient cells, exhibit lower levels of H3K4me3 in controls (C1, C2 mean). Box, 25th-75th percentile; (h) whiskers, full data range; (i) whiskers, 1.5x interquartile range; centre line, median. Polycomb marked DMV definition, see methods. (p-values in h,i, two-sided Wilcoxon rank sum tests, polycomb positive (+) (n=524) versus negative (−) (n=628) DMVs).
Fig. 5|
Fig. 5|. Hypermethylation of polycomb-marked regions is observed on differentiation of Dnmt3aW326R pluripotent stem cells.
a-e, DNA methylation at DMRs occurs during cellular differentiation to embryoid bodies (EBs) and neural progenitor cells (NPCs) in CRISPR/Cas9-edited Dnmt3aW326R mESCs. Bisulfite sequencing of the Hoxc13 locus of (a) LIF/serum maintained mESCs, (b) after 9 days differentiation to EBs and (c) after 9 days neural induction to NPCs. For EBs and NPC differentiation, representative of n=2 independent experiments each. Blocks, independent cell lines; open and closed circles, unmethylated and methylated CpGs, respectively; dots, undetermined methylation status; columns CpG sites; rows individual sequences. Total percentage methylation calculated per sample. (d) Genome browser view of RRBS DNA methylation profiles after 9 days neural differentiation. Tracks, independent wild type (dark grey), and Dnmt3aW326R (blue) cell lines. Neural precursor cell H3K27me3 data (magenta) from published ChIP-seq dataset. DNA methylation (scale 0–80%, all tracks). (e) Hypermethylated DMRs are enriched for H3K27me3 peaks in wildtype NPCs. Percentage of CpGs observed in RRBS overlapping with H3K27me3 peaks. H3K27me3 data from wild type NPC ChIP-seq dataset. All, all CpGs observed (n=1178718 CpGs). Hyper-DMRs, CpGs within hypermethylated DMRs (3117). P-value, two-sided Fisher’s exact test. f, Hypermethylated gene loci in Dnmt3aW326R NPCs substantially overlap those in patient cells. Venn diagram of orthologous genes (human n=781; mouse n=207) associated with respective DMRs. P-value, two-sided Fisher’s exact test. (g) Reduced expression for genes associated with hyper-DMRs is evident during NPC differentiation. RNA-seq data for NPC differentiation experiment from panel d. (n=3 wild-type clones, n=3 Dnmt3aW326R/W326R clones). log2 CPM ratios of Dnmt3aW326R/W326R versus wildtype at 9 day NPC differentiation plotted. Box, 25th-75th percentile; whiskers, 1.5x interquartile range from box; centre line, median. Two-sided Wilcoxon rank sum test, All genes with coverage in RRBS (n=12620 genes) vs genes associated with hypo-DMRs (n=169) or hyper-DMRs (n=161). h-i, Neurogenic gene transcription bias in Dnmt3aW326R/W326R NPCs. (h) log2 CPM ratios of genes for Dnmt3aW326R/W326R versus wild-type 9 day-differentiated NPCs. All, all genes n=13,022; and gene sets, upregulated (n=3,864 genes), unchanged (n=3,516) and downregulated genes (n=3,281) during differentiation from mESCs to neurons. Box, 25th-75th percentile; whiskers, 1.5x interquartile range from box; centre line, median. Two-sided Wilcoxon rank sum test, log2 W326R/WT for All vs up or downregulated gene sets. (i) Schematic: Gene sets defined on basis of published dataset of mESC differentiation to terminally differentiated neurons. Downregulated and upregulated gene sets defined as those genes with reduced and increased transcripts respectively in neurons relative to ES cells. The downregulated set therefore contains pluripotency-related genes (light blue) and the upregulated set, neuronal differentiation genes (light red).
Fig. 6|
Fig. 6|. Dnmt3aW326R/+ mice have reduced brain size and body weight, alongside hypermethylation of developmental genes.
a, 10-week old Dnmt3aW326R/+ mouse next to wild-type littermate. (b) Body weight for 6 week-old Dnmt3aW326R/+ mice compared to wild type littermates. Males, n=14 wildtype and n=18 Dnmt3aW326R/+ animals. Females, n= 16 wildtype and n=23 Dnmt3aW326R/+ animals. (c) Brain weight of female Dnmt3aW326R/+ mice compared to wild type litter mates at 5 months of age. n=7 wildtype and 9 Dnmt3aW326R/+ animals. h,i P-values, two-tailed t-test. Horizontal bar, mean weight per group. (d) Locus-specific (Hoxc13) bisulfite sequencing for cortex and liver samples from Dnmt3aW326R/+ and wild-type littermates (n=3/group; female, age 8 weeks). e, Proposed model linking disruption of the H3K36me2/3<--> PWWP interaction with DMV DNA methylation. WT-DNMT3A is normally targeted to H3K36me2 and H3K36me3, marks present widely in the genome,, but rarely coexist with H3K27me3 ,. This limits availability of free-DNMT3A to bind at other locations. When the PWWP-H3K36me2/3 interaction is disrupted, sufficient free DNMT3A is available to methylate genomic DNA at DMVs. Enzymatic activity of DNMT3A and DNA methylation impair PRC2 chromatin binding,, leading to secondary loss of H3K27me3. Notably, the long isoform of DNMT3A (DNMT3A1) localises to the edge of Polycomb domains,. When mutated it is therefore well placed to methylate these regions. DNMT3A1 is also the major isoform expressed after ESC differentiation, potentially explaining timing of hypermethylation. Filled circles methylated CpG, open circles unmethylated CpG. Diamonds, H3K36me2/3 modified histones.

References

    1. Klingseisen A & Jackson AP Mechanisms and pathways of growth failure in primordial dwarfism. Genes and Development 25, 2011–2024 (2011). - PMC - PubMed
    1. Bicknell LS et al. Mutations in the pre-replication complex cause Meier-Gorlin syndrome. Nat Genet 43, 356–9 (2011). - PMC - PubMed
    1. Bicknell LS et al. Mutations in ORC1, encoding the largest subunit of the origin recognition complex, cause microcephalic primordial dwarfism resembling Meier-Gorlin syndrome. Nat Genet 43, 350–5 (2011). - PubMed
    1. Guernsey DL et al. Mutations in origin recognition complex gene ORC4 cause Meier-Gorlin syndrome. Nat Genet 43, 360–4 (2011). - PubMed
    1. Burrage LC et al. De Novo GMNN Mutations Cause Autosomal-Dominant Primordial Dwarfism Associated with Meier-Gorlin Syndrome. Am J Hum Genet 97, 904–13 (2015). - PMC - PubMed

Methods only references:

    1. Barski A et al. High-resolution profiling of histone methylations in the human genome. Cell 129, 823–37 (2007). - PubMed
    1. Murray JE et al. Extreme growth failure is a common presentation of ligase IV deficiency. Hum Mutat 35, 76–85 (2014). - PMC - PubMed
    1. de Bruin C et al. An XRCC4 splice mutation associated with severe short stature, gonadal failure, and early-onset metabolic syndrome. J Clin Endocrinol Metab 100, E789–98 (2015). - PMC - PubMed
    1. Guerois R, Nielsen JE & Serrano L Predicting changes in the stability of proteins and protein complexes: a study of more than 1000 mutations. J Mol Biol 320, 369–87 (2002). - PubMed
    1. Triche TJ Jr., Weisenberger DJ, Van Den Berg D, Laird PW & Siegmund KD Low-level processing of Illumina Infinium DNA Methylation BeadArrays. Nucleic Acids Res 41, e90 (2013). - PMC - PubMed

MeSH terms