. 2019 Mar;38(13):2305-2319.
doi: 10.1038/s41388-018-0577-5. Epub 2018 Nov 26.

Integrative network biology analysis identifies miR-508-3p as the determinant for the mesenchymal identity and a strong prognostic biomarker of ovarian cancer

Affiliations

Integrative network biology analysis identifies miR-508-3p as the determinant for the mesenchymal identity and a strong prognostic biomarker of ovarian cancer

Linjie Zhao et al. Oncogene. 2019 Mar.

Erratum in

Abstract

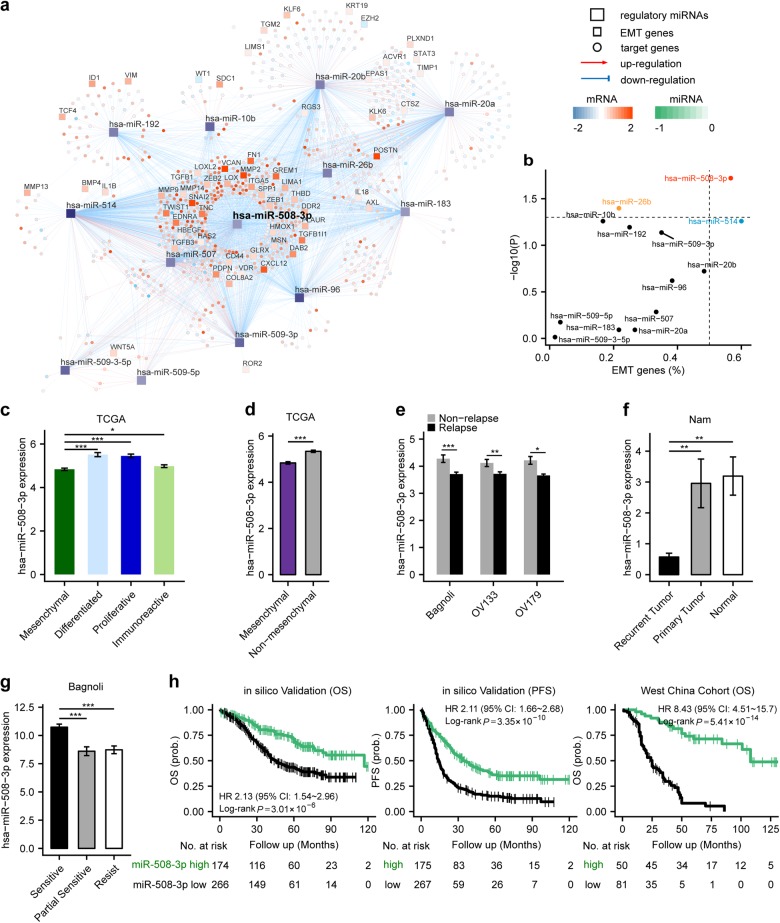
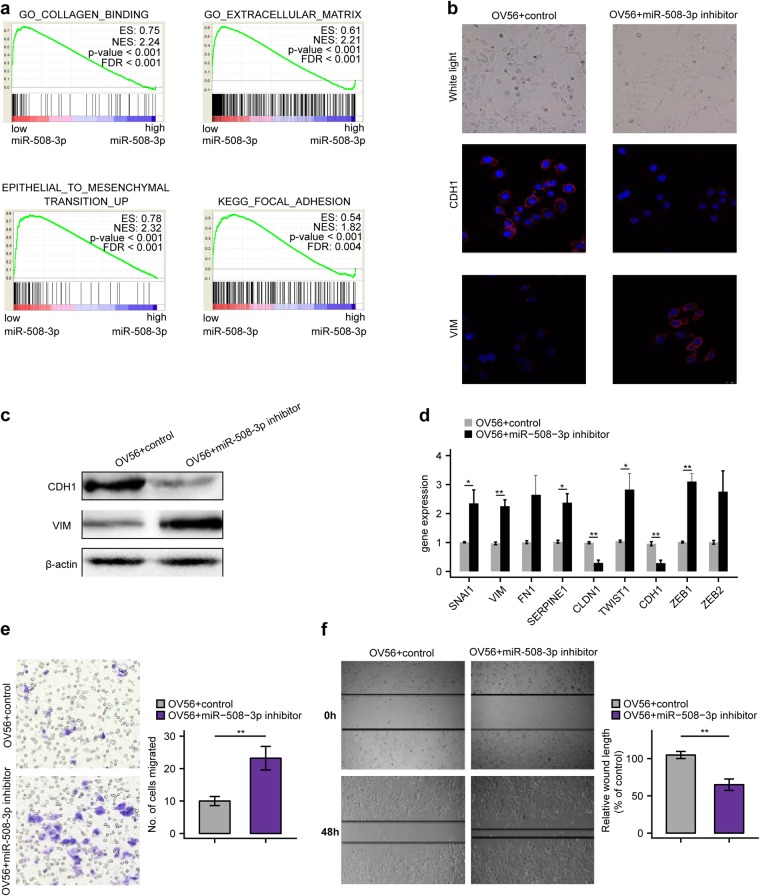
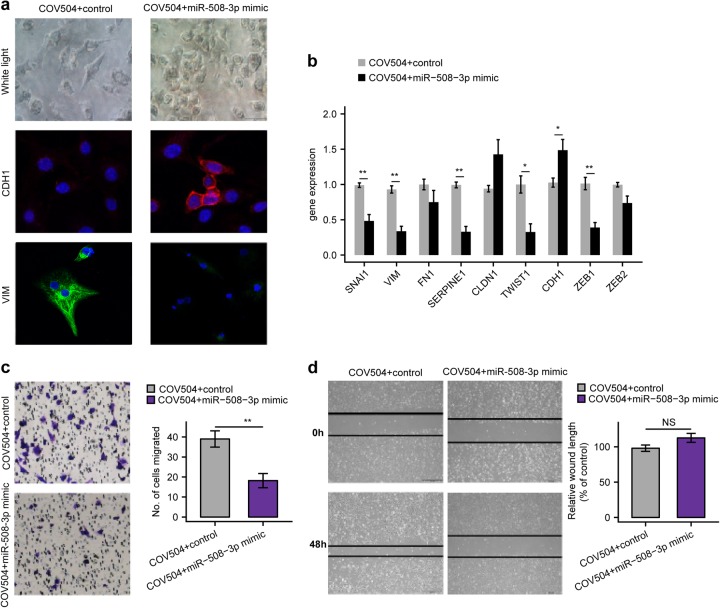
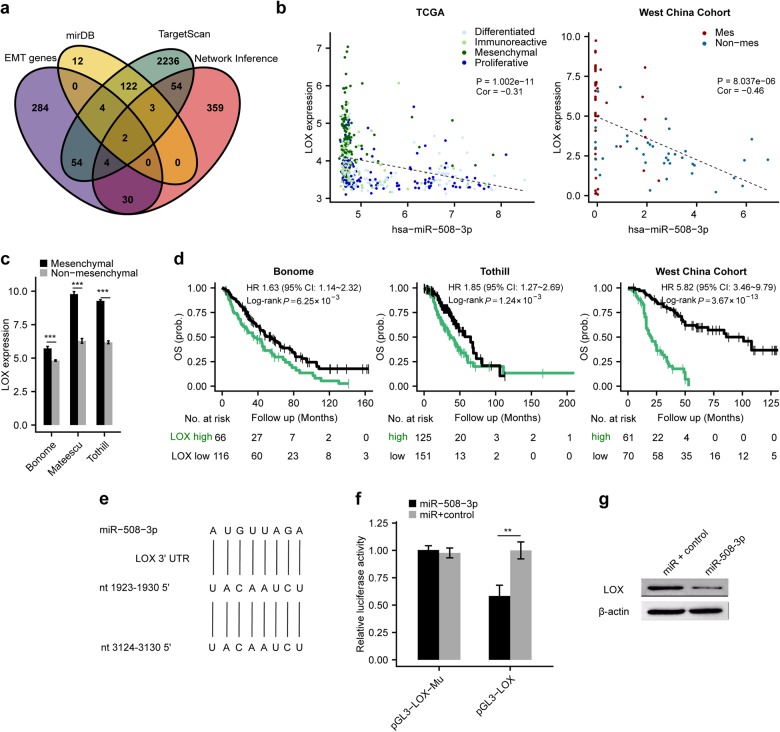
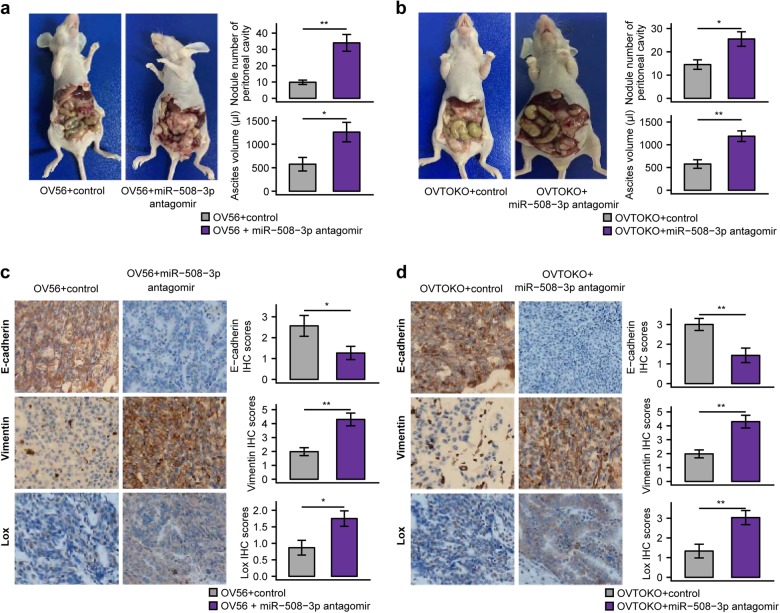
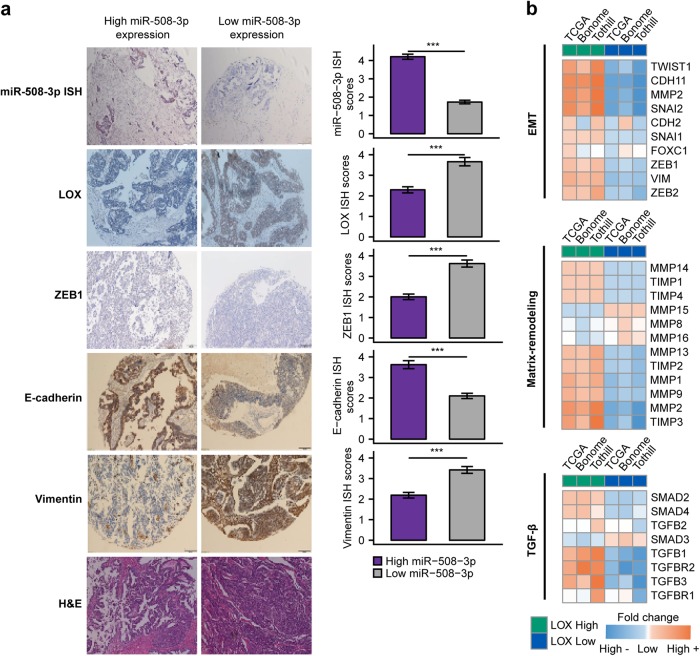
Ovarian cancer is a heterogeneous malignancy that poses tremendous clinical challenge. Based on unsupervised classification of whole-genome gene expression profiles, four molecular subtypes of ovarian cancer were recently identified. However, single-driver molecular events specific to these subtypes have not been clearly elucidated. We aim to characterize the regulatory mechanisms underlying the poor prognosis mesenchymal subtype of ovarian cancer using a systems biology approach, involving a variety of molecular modalities including gene and microRNA expression profiles. miR-508-3p emerged as the most powerful determinant that regulates a cascade of dysregulated genes in the mesenchymal subtype, including core genes involved in epithelial-mesenchymal transition (EMT) program. Moreover, miR-508-3p down-regulation, due to promoter hypermethylation, was directly correlated with metastatic behaviors in vitro and in vivo. Taken together, our multidimensional network analysis identified miR-508-3p as a master regulator that defines the mesenchymal subtype and provides a novel prognostic biomarker to improve management of this disease.


Conflict of interest statement

The authors declare that they have no conflict of interest.

Figures

Fig. 1
Fig. 1
Network biology analysis defines miR-508-3p as the major regulatory network of mesenchymal-specific and EMT genes. a The differential microRNA expression between mesenchymal and non-mesenchymal ovarian cancer in the TCGA data set (green: lowly expressed in the mesenchymal subtype). Predicted genes regulated by the microRNAs are shown according to their differential expression between mesenchymal and non-mesenchymal tumors (blue: lowly expressed in the mesenchymal subtype, orange: highly expressed in the mesenchymal subtype). The edges between microRNAs and genes are depicted in red (induction) or blue (repression) based on the predicted signs of regulations of miRs on genes. EMT genes from the Taube EMT signature [15] are underscored as rectangles. b Statistical significance of overrepresentation of a microRNA’s regulon for EMT genes (−log10 transformed Benjamini-Hochberg-adjusted P-values, hypergeometric tests) vs. the proportion of EMT genes regulated by a microRNA. microRNAs which had significant EMT genes over-representation (Benjamini-Hochberg-adjusted P < 0.05) or regulate over half of EMT genes of are color-coded. c miR-508-3p expression is significantly lower in the mesenchymal subtype in TCGA dataset than the other three subtypes (n = 104 for mesenchymal, n = 124 for differentiated, n = 133 for proliferative, and n = 101 for immunoreactive). d Compared to non-mesenchymal subtypes, miR-508-3p expression is significantly lower in the mesenchymal subtype of ovarian cancer in TCGA (n = 104 for mesenchymal, n = 358 for non-mesenchymal). e miR-508-3p expression in ovarian cancer patients with relapse are significantly lower than those without relapse in Bagoli (n = 29 for non-relapse, n = 101 for relapse), OV133 (n = 39 for non-relapse, n = 94 for Relapse) and OV179 (n = 55 for non-relapse, n = 124 for relapse) datasets. f The expression levels of miR-508-3p in recurrent tumors (n = 8) are significantly lower than primary tumors (n = 8) and normal ovarian tissues (n = 4). g The expression levels of miR-508-3p are significantly higher in sensitive tumors (n = 69), compared to partial sensitive tumors (n = 26) and resistant tumors (n = 35). In all bar plots, p-values were based on Mann–Whitney-Wilcoxon test (*P < 0.05, **P < 0.01, ***P < 0.001). h Kaplan–Meier curves demonstrating OS and PFS of ovarian cancer patients in miR-508-3p low and high expression subgroups (stratified by the average expression level of miR-508-3p) in a merged cohort of three public datasets (Bagoli, OV133 and OV179). Using West China cohort (n = 131) for in-house validation, Kaplan–Meier curves confirmed significantly poorer overall survival in miR-508-3p low expression subgroup (also stratified by the average expression level of miR-508-3p) than tumors with high expression of miR-508-3p. P-values were based on log-rank tests
Fig. 2
Fig. 2
Inhibition of miR-508-3p in ovarian cancer cells is sufficient to induce mesenchymal phenotype. a Gene set enrichment analysis confirmed EMT-related programs are upregulated in miR-508-3p low expression group in TCGA. b Inverse phase microscopy (upper panel) and E-cadherin and vimentin staining (lower panels) of OV56 cells transfected with miR-508-3p inhibitor or control miRNA (miR-Ctrl) for 72 h. Cell nuclei were stained with DAPI. c The protein levels of E-cadherin and vimentin in OV56 cells transfected with miR-508-3p inhibitor or control miRNA (miR-Ctrl) for 72 h. β-actin was used as a control. d The mRNA levels of EMT genes between OV56 cells transfected with miR-508-3p inhibitor or control miRNA (miR-Ctrl) for 72 h. β-actin was used as a control. e Transwell chamber analysis of OV56 cells transfected with miR-508-3p inhibitor or control miRNA (miR-Ctrl) for 72 h. f Wound healing analysis of OV56 cells transfected with miR-508-3p inhibitor or control miRNA (miR-Ctrl) for 72 h. In all bar plots, p-values are based on two-tailed Student’s t-tests (*P < 0.05, **P < 0.01)
Fig. 3
Fig. 3
Enforced miR-508-3p expression reversed the mesenchymal identify of the mesenchymal subtype ovarian cancer. a Inverse phase microscopy (upper panel) and E-cadherin and vimentin staining (lower panels) of COV504 cells transfected with miR-508-3p mimic or control. Cell nuclei were stained with DAPI. b mRNA levels of key EMT genes in COV504 cells from the same transfection and treated the same way as described above. c Transwell chamber assay of the COV504 cells from the same transfection as described previously. d Wound healing analysis of COV504 cells transfected with miR-508-3p mimic or control for 72 h. In all bar plots, P-values are based on two-tailed Student’s t-tests (*P < 0.05, **P < 0.01)
Fig. 4
Fig. 4
LOX is a downstream target of miR-508-3p in maintaining the mesenchymal identity of ovarian cancer. a Venn diagram illustrating miR-508-3p target prediction by taking the common genes between predicted target genes by miRDB and TargetScan databases, EMT signature genes and predicted target genes in the regulatory network. b Significant correlation between LOX expression and miR-508-3p expression in the TCGA dataset and West China cohort. r, Pearson correlation coefficient. c The expression of LOX is significantly higher in mesenchymal tumors than non-mesenchymal tumors in Bonome, Mateescu, and Tothill datasets. P-values are based on Mann–Whitney-Wilcoxon Test (***P < 0.001). d Kaplan–Meier curves showed significantly poorer overall survival in LOX high expression subgroup (stratified by the average expression level of LOX) than LOX low expression subgroup in Bonome, Tothill and West China cohorts, respectively. P-values are based on log-rank tests. e The two predicted binding sites of miR-508-3p were shown in the LOX 3′-UTR region. f The pGL3-LOX reporter gene has the full length of LOX 3′-UTR cloned into pGL3-control vector. The pGL3-LOX-Mu vector has the two miR-508-3p binding sites deleted and confirmed by sequencing OV56 cells were transfected with pGL3-LOX or pGL3-LOX-Mu, respectively, together with miR-508-3p mimic or negative control. P-values are based on two-tailed Student’s t-tests (**P < 0.01). g The expression level of LOX in OV56 cells transfected with miR-508-3p mimic or control
Fig. 5
Fig. 5
miR-508-3p inhibition promotes tumor progression in the peritoneal metastasis model of ovarian cancer. a Representative images of peritoneal metastasis and quantification of metastatic nodule number and ascites volume in control miRNA- and miR-508-3p antagomir-treated OV56 mouse model. b Representative images of peritoneal metastasis and quantification of metastatic nodule number and ascites volume in control miRNA- and miR-508-3p antagomir-treated OVTOKO mouse model. c OV56 tumor samples from control and miR-508-3p antagomir treated mice were stained for E-cadherin, vimentin and LOX by IHC. d OVTOKO tumor samples from control and miR-508-3p antagomir treated mice were stained for E-cadherin, vimentin and LOX by IHC. P-values are based on two-tailed Student’s t-tests (*P < 0.05, **P < 0.01, ***P < 0.001)
Fig. 6
Fig. 6
Correlation between miR-508-3p and E-cadherin, VIM, LOX and ZEB1 expression and in West China serous ovarian cancer cohorts. a Representative images of ISH staining for miR-508-3p and IHC staining for LOX, ZEB1, E-cadherin, and vimentin in miR-508-3p-low and -high expression cases. The miR-508-3p expression was stratified by using average of miR-508-3p qPCR expression as threshold. P-values are based on two-tailed Student’s t-tests (*P < 0.05, **P < 0.01, ***P < 0.001). b Heatmap showing the average log2 fold difference of the indicated genes (rows) in EMT-related programs (top: EMT, middle: matrix remodeling, bottom: TGF-β) between LOX-high and LOX-low ovarian cancer specimens of each respective dataset (columns)

References

    1. Matulonis UA, Sood AK, Fallowfield L, Howitt BE, Sehouli J, Karlan BY. Ovarian cancer. Nat Rev Dis Prim. 2016;2:16061. doi: 10.1038/nrdp.2016.61. - DOI - PMC - PubMed
    1. Bowtell DD, Böhm S, Ahmed AA, Aspuria PJ, Bast RC, Jr, Beral V, et al. Rethinking ovarian cancer II: reducing mortality from high-grade serous ovarian cancer. Nat Rev Cancer. 2015;15:668–79. doi: 10.1038/nrc4019. - DOI - PMC - PubMed
    1. Karnezis AN, Cho KR, Gilks CB, Pearce CL, Huntsman DG. The disparate origins of ovarian cancers: pathogenesis and prevention strategies. Nat Rev Cancer. 2017;17:65–74. doi: 10.1038/nrc.2016.113. - DOI - PubMed
    1. Kossaï Myriam, Leary Alexandra, Scoazec Jean-Yves, Genestie Catherine. Ovarian Cancer: A Heterogeneous Disease. Pathobiology. 2017;85(1-2):41–49. doi: 10.1159/000479006. - DOI - PubMed
    1. Tothill RW, Tinker AV, George J, Brown R, Fox SB, Lade S, et al. Novel molecular subtypes of serous and endometrioid ovarian cancer linked to clinical outcome. Clin Cancer Res. 2008;14:5198–208. doi: 10.1158/1078-0432.CCR-08-0196. - DOI - PubMed

Publication types

MeSH terms