

Altered Local Field Potential Relationship Between the Parafascicular Thalamic Nucleus and Dorsal Striatum in Hemiparkinsonian Rats
- PMID: 30478502
- PMCID: PMC6426816
- DOI: 10.1007/s12264-018-0312-9
Altered Local Field Potential Relationship Between the Parafascicular Thalamic Nucleus and Dorsal Striatum in Hemiparkinsonian Rats
Abstract
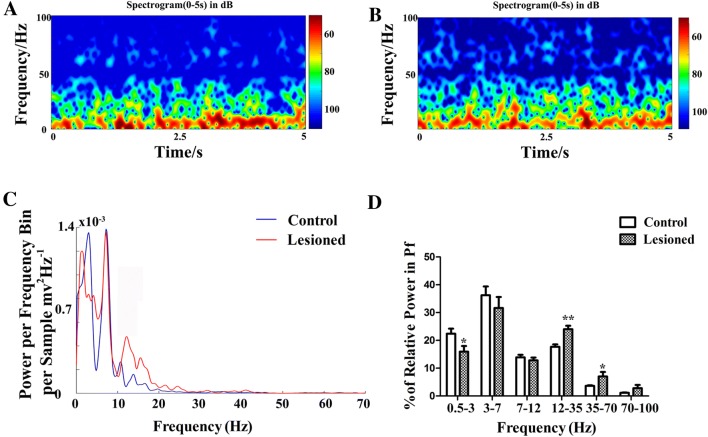
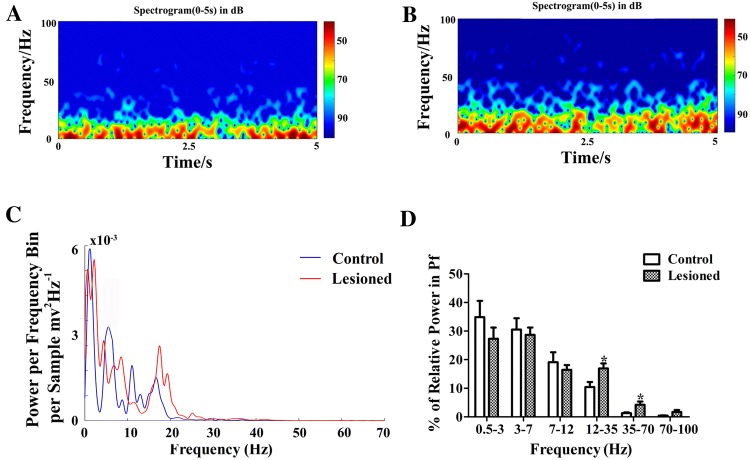
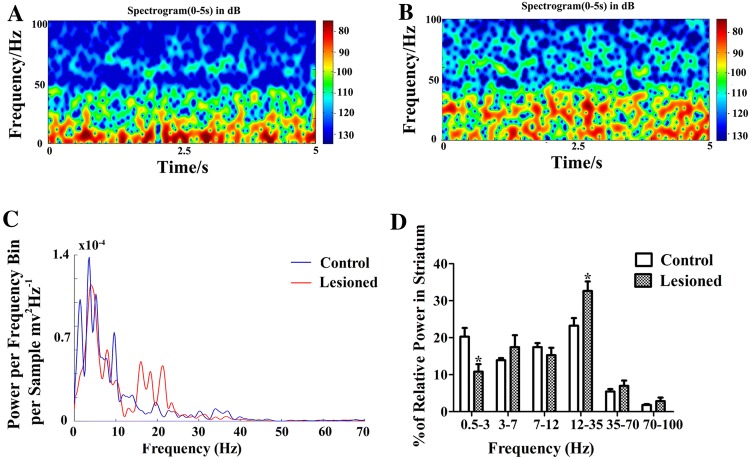
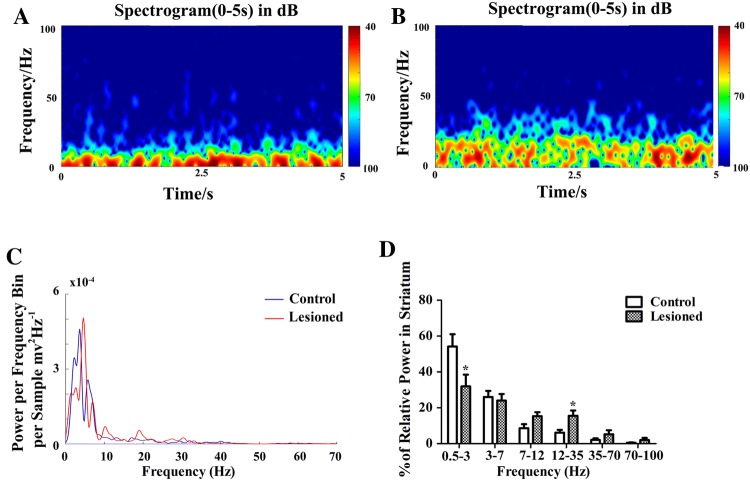
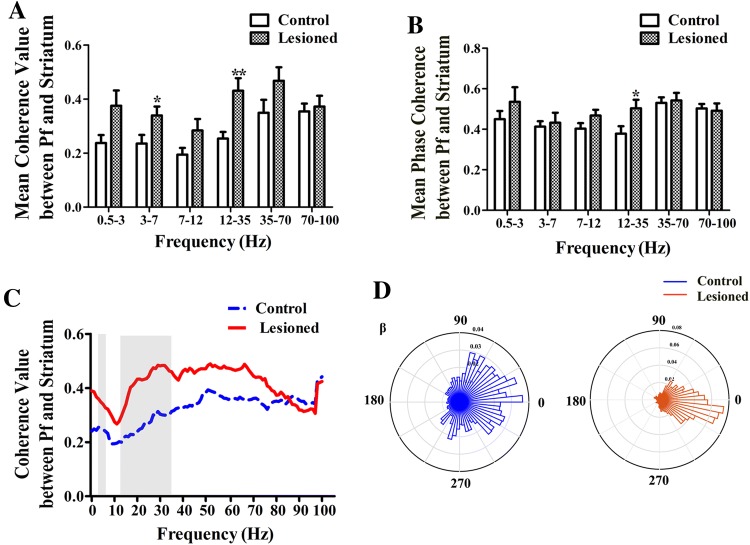
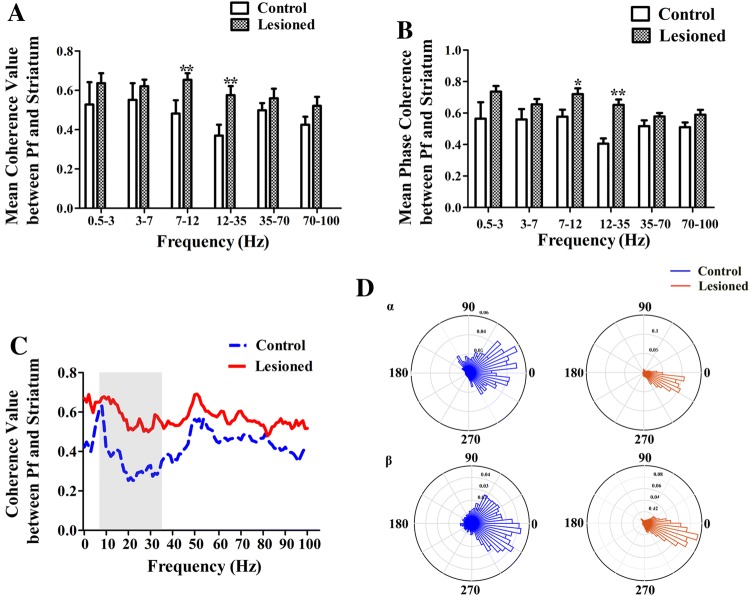
The thalamostriatal pathway is implicated in Parkinson's disease (PD); however, PD-related changes in the relationship between oscillatory activity in the centromedian-parafascicular complex (CM/Pf, or the Pf in rodents) and the dorsal striatum (DS) remain unclear. Therefore, we simultaneously recorded local field potentials (LFPs) in both the Pf and DS of hemiparkinsonian and control rats during epochs of rest or treadmill walking. The dopamine-lesioned rats showed increased LFP power in the beta band (12 Hz-35 Hz) in the Pf and DS during both epochs, but decreased LFP power in the delta (0.5 Hz-3 Hz) band in the Pf during rest epochs and in the DS during both epochs, compared to control rats. In addition, exaggerated low gamma (35 Hz-70 Hz) oscillations after dopamine loss were restricted to the Pf regardless of the behavioral state. Furthermore, enhanced synchronization of LFP oscillations was found between the Pf and DS after the dopamine lesion. Significant increases occurred in the mean coherence in both theta (3 Hz-7 Hz) and beta bands, and a significant increase was also noted in the phase coherence in the beta band between the Pf and DS during rest epochs. During the treadmill walking epochs, significant increases were found in both the alpha (7 Hz-12 Hz) and beta bands for two coherence measures. Collectively, dramatic changes in the relative LFP power and coherence in the thalamostriatal pathway may underlie the dysfunction of the basal ganglia-thalamocortical network circuits in PD, contributing to some of the motor and non-motor symptoms of the disease.
Keywords: Dorsal striatum; Local field potential; Parafascicular thalamic nucleus; Parkinson’s disease; Synchronization.
Figures
Similar articles
-
State-Dependent Spike and Local Field Synchronization between the Thalamic Parafascicular Nucleus and the Dorsal Striatum in a Rat Model of Parkinson's Disease.Neuroscience. 2019 Apr 15;404:27-38. doi: 10.1016/j.neuroscience.2019.01.055. Epub 2019 Feb 19. Neuroscience. 2019. PMID: 30790668
-
Functional correlates of exaggerated oscillatory activity in basal ganglia output in hemiparkinsonian rats.Exp Neurol. 2014 Nov;261:563-77. doi: 10.1016/j.expneurol.2014.07.010. Epub 2014 Jul 30. Exp Neurol. 2014. PMID: 25084518 Free PMC article.
-
Ventral Medial Thalamic Nucleus Promotes Synchronization of Increased High Beta Oscillatory Activity in the Basal Ganglia-Thalamocortical Network of the Hemiparkinsonian Rat.J Neurosci. 2016 Apr 13;36(15):4196-208. doi: 10.1523/JNEUROSCI.3582-15.2016. J Neurosci. 2016. PMID: 27076419 Free PMC article.
-
Oscillatory activity in the cortico-basal ganglia-thalamic neural circuits in Parkinson's disease.Eur J Neurosci. 2018 Oct;48(8):2869-2878. doi: 10.1111/ejn.13853. Epub 2018 Feb 8. Eur J Neurosci. 2018. PMID: 29381817 Review.
-
Roles of centromedian parafascicular nuclei of thalamus and cholinergic interneurons in the dorsal striatum in associative learning of environmental events.J Neural Transm (Vienna). 2018 Mar;125(3):501-513. doi: 10.1007/s00702-017-1713-z. Epub 2017 Mar 21. J Neural Transm (Vienna). 2018. PMID: 28324169 Free PMC article. Review.
Cited by
-
Transient Increases in Neural Oscillations and Motor Deficits in a Mouse Model of Parkinson's Disease.Int J Mol Sci. 2024 Sep 2;25(17):9545. doi: 10.3390/ijms25179545. Int J Mol Sci. 2024. PMID: 39273491 Free PMC article.
-
Homeobox Gene Six3 is Required for the Differentiation of D2-Type Medium Spiny Neurons.Neurosci Bull. 2021 Jul;37(7):985-998. doi: 10.1007/s12264-021-00698-5. Epub 2021 May 20. Neurosci Bull. 2021. PMID: 34014554 Free PMC article.
-
2 Hz EA Reduces Heroin Withdrawal-Induced Hyperalgesia and Heroin Relapse by Downregulating P2X3 Receptors in DRG Neurons.Biomed Res Int. 2019 Dec 24;2019:1873859. doi: 10.1155/2019/1873859. eCollection 2019. Biomed Res Int. 2019. PMID: 31950033 Free PMC article.
-
Dyskinesia is Closely Associated with Synchronization of Theta Oscillatory Activity Between the Substantia Nigra Pars Reticulata and Motor Cortex in the Off L-dopa State in Rats.Neurosci Bull. 2021 Mar;37(3):323-338. doi: 10.1007/s12264-020-00606-3. Epub 2020 Nov 19. Neurosci Bull. 2021. PMID: 33210188 Free PMC article.
-
Glutamatergic Neurons in the Caudal Zona Incerta Regulate Parkinsonian Motor Symptoms in Mice.Neurosci Bull. 2022 Jan;38(1):1-15. doi: 10.1007/s12264-021-00775-9. Epub 2021 Oct 11. Neurosci Bull. 2022. PMID: 34633650 Free PMC article.
References
-
- Hornykiewicz O, Kish SJ. Biochemical pathophysiology of Parkinson’s disease. Adv Neurol. 1987;45:19–34. - PubMed
MeSH terms
Substances
LinkOut - more resources
Full Text Sources
