

Development of a Non-invasive Assessment of Hypoxia and Neovascularization with Magnetic Resonance Imaging in Benign and Malignant Breast Tumors: Initial Results
- PMID: 30478507
- PMCID: PMC7480075
- DOI: 10.1007/s11307-018-1298-4
Development of a Non-invasive Assessment of Hypoxia and Neovascularization with Magnetic Resonance Imaging in Benign and Malignant Breast Tumors: Initial Results
Abstract
Purpose: To develop a novel magnetic resonance imaging (MRI) approach for the noninvasive assessment of hypoxia and neovascularization in breast tumors.
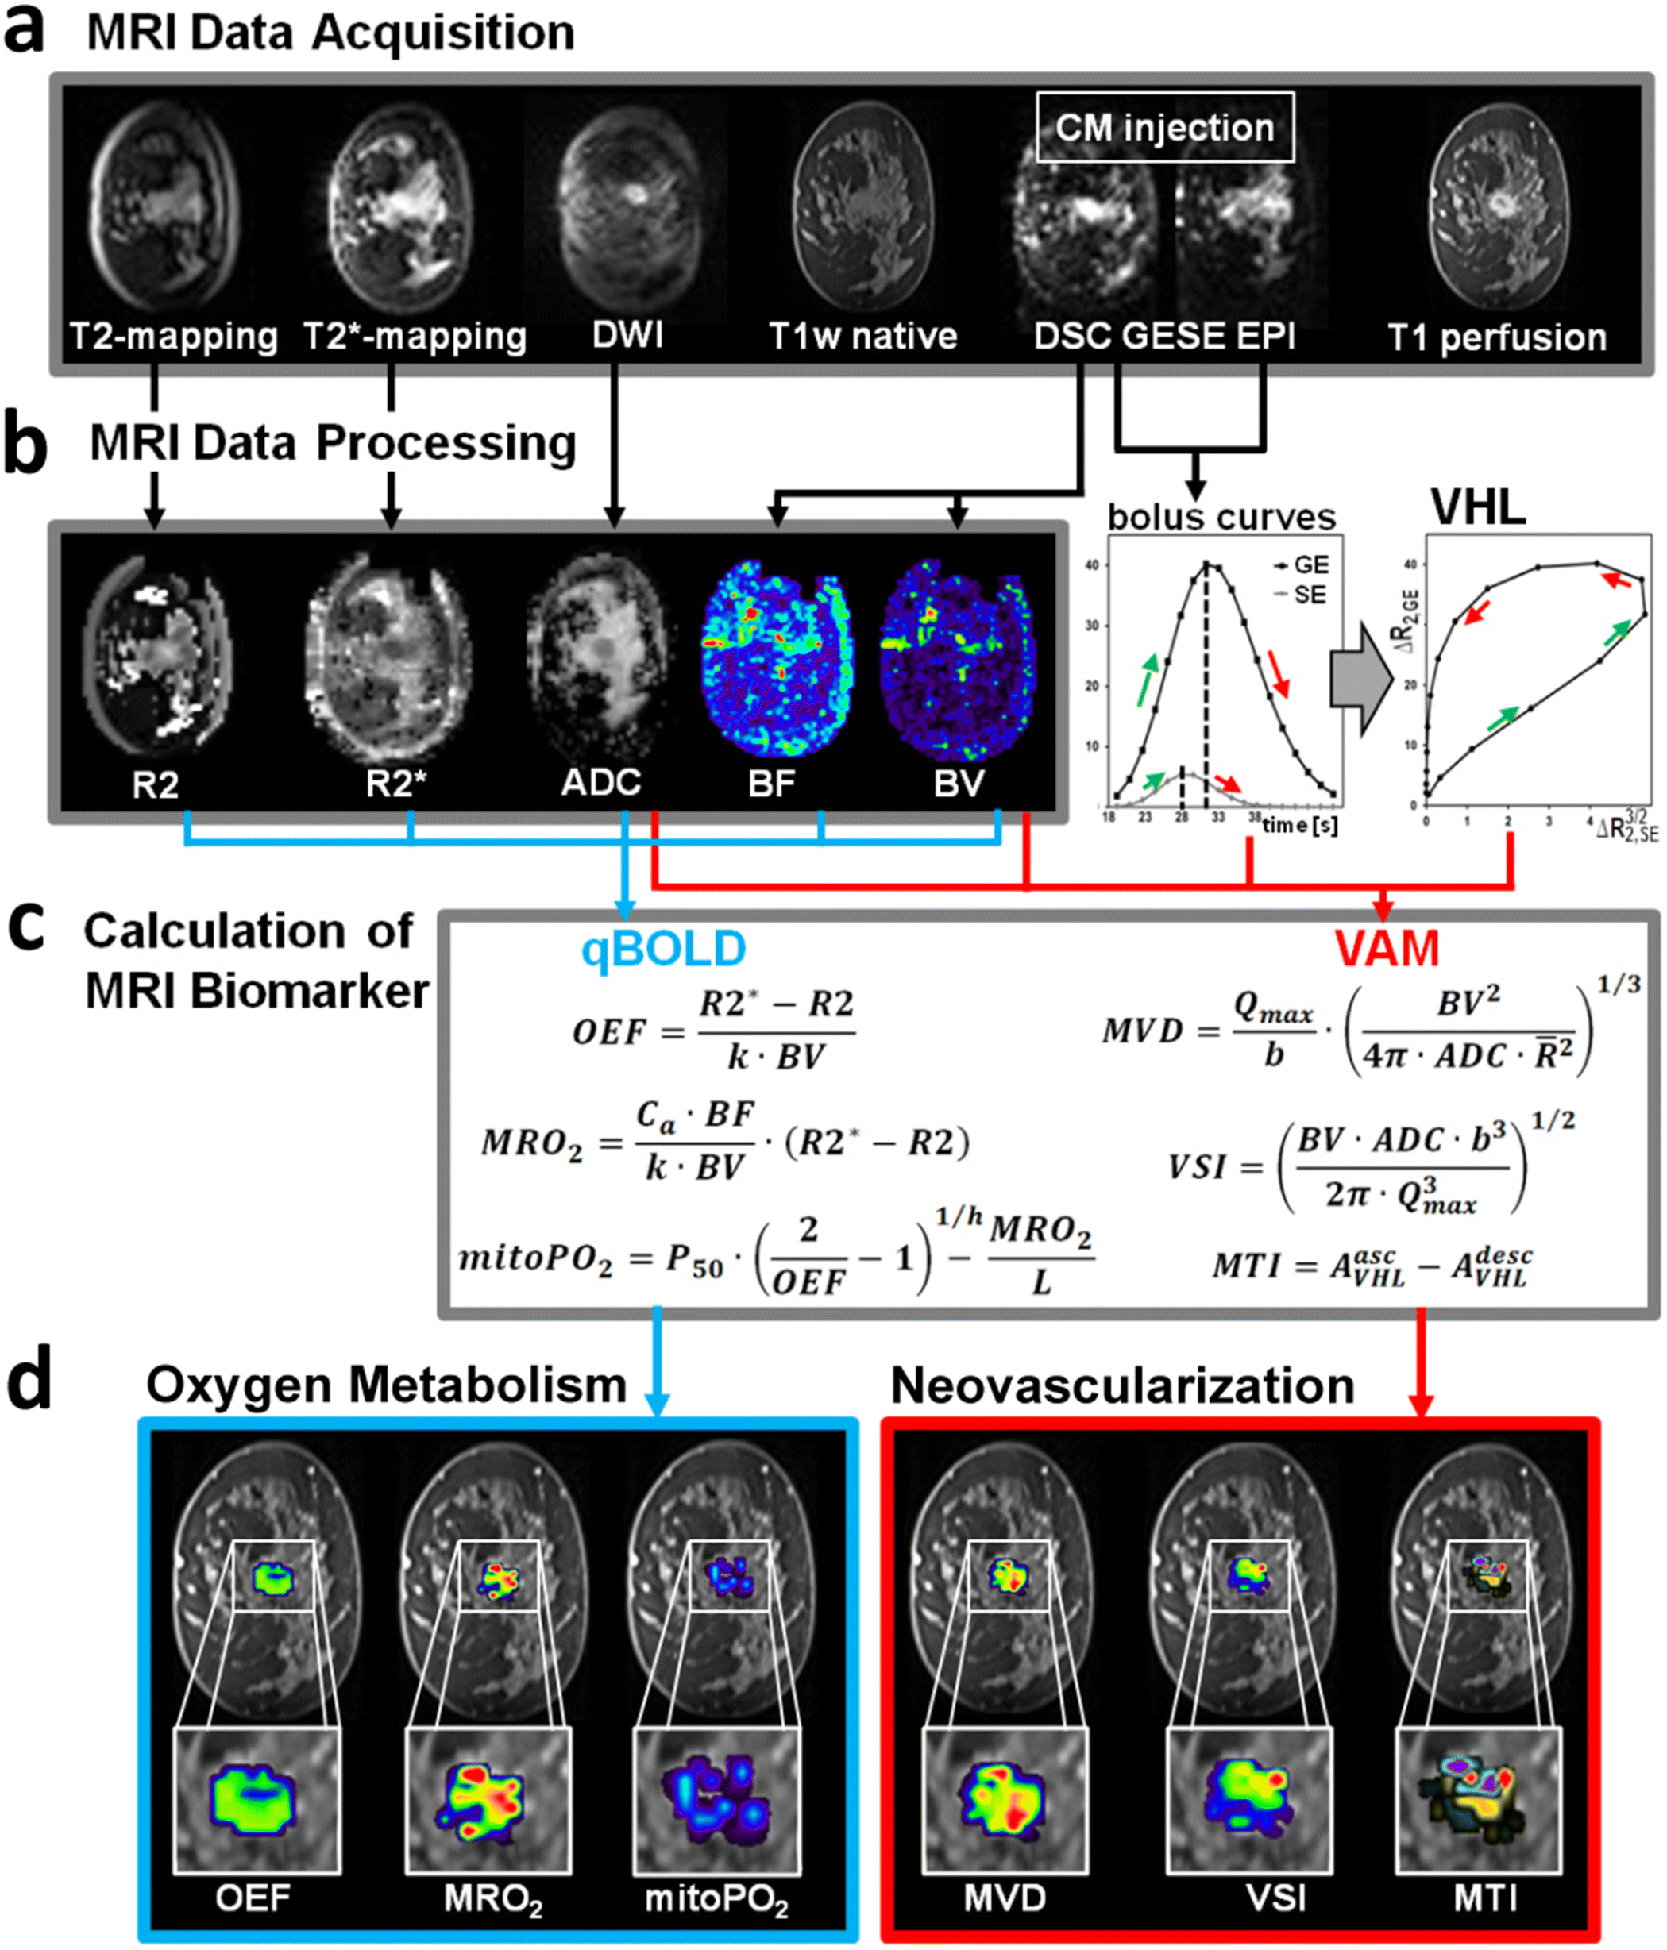
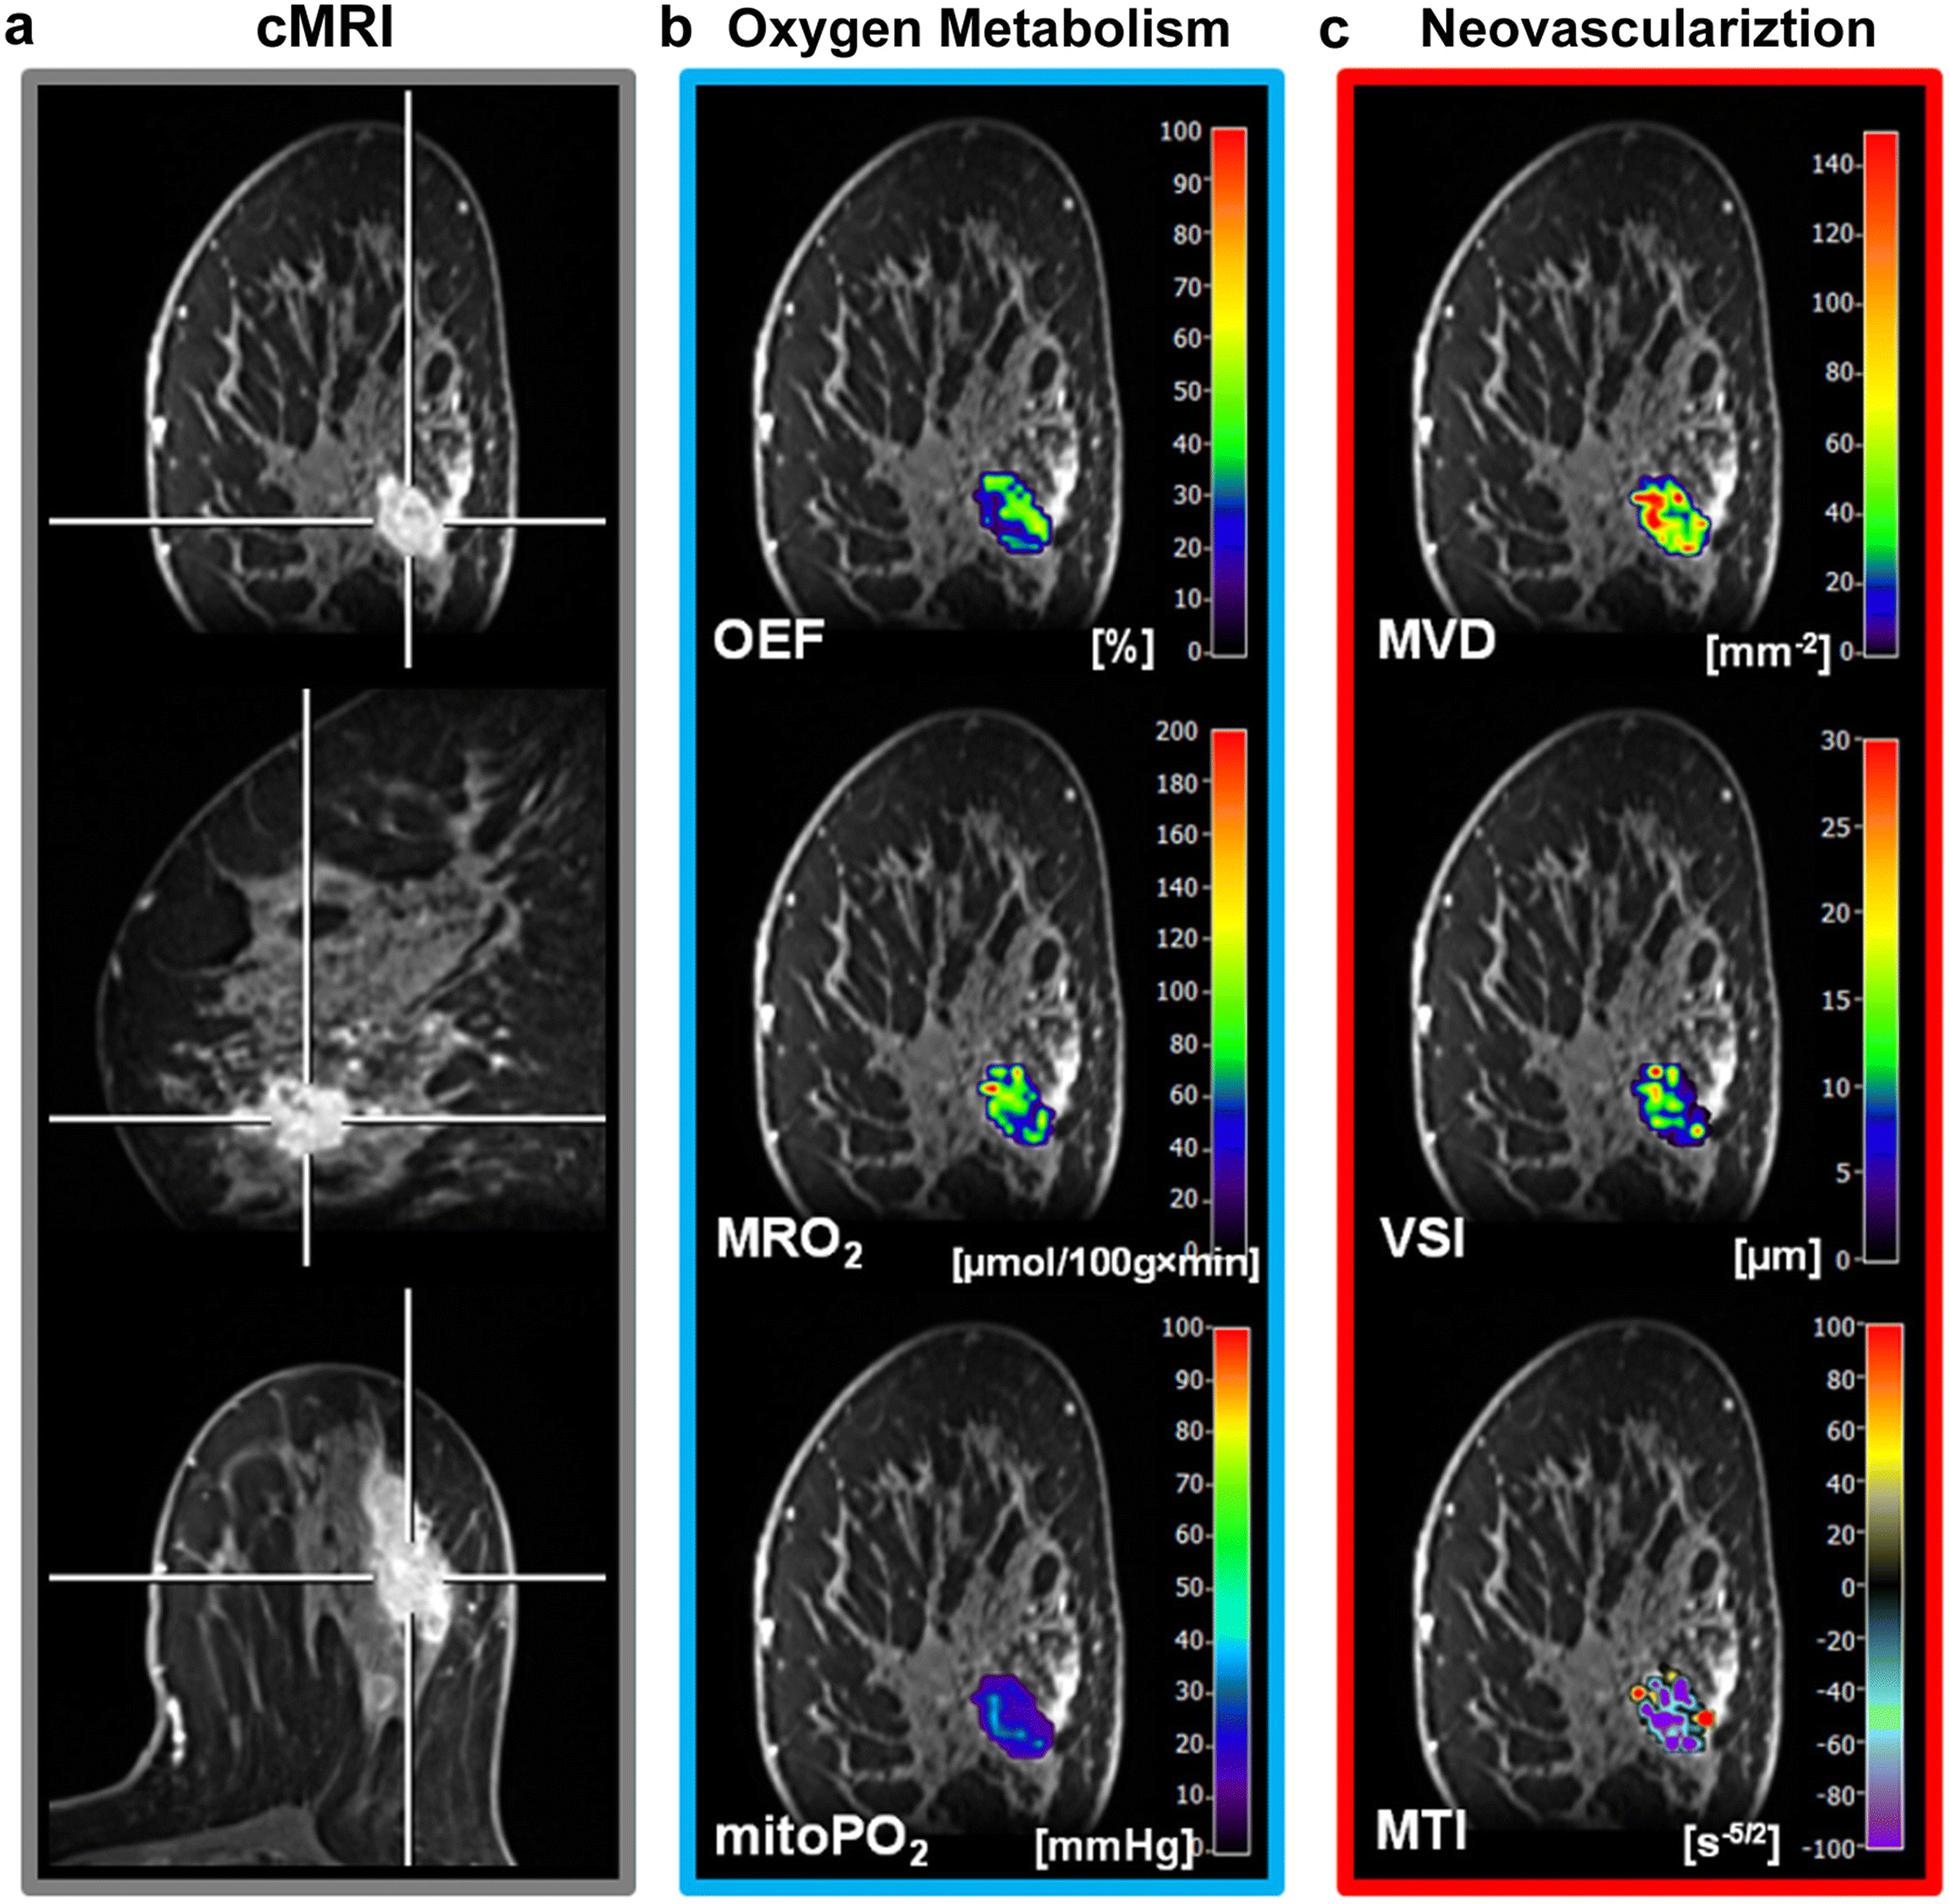
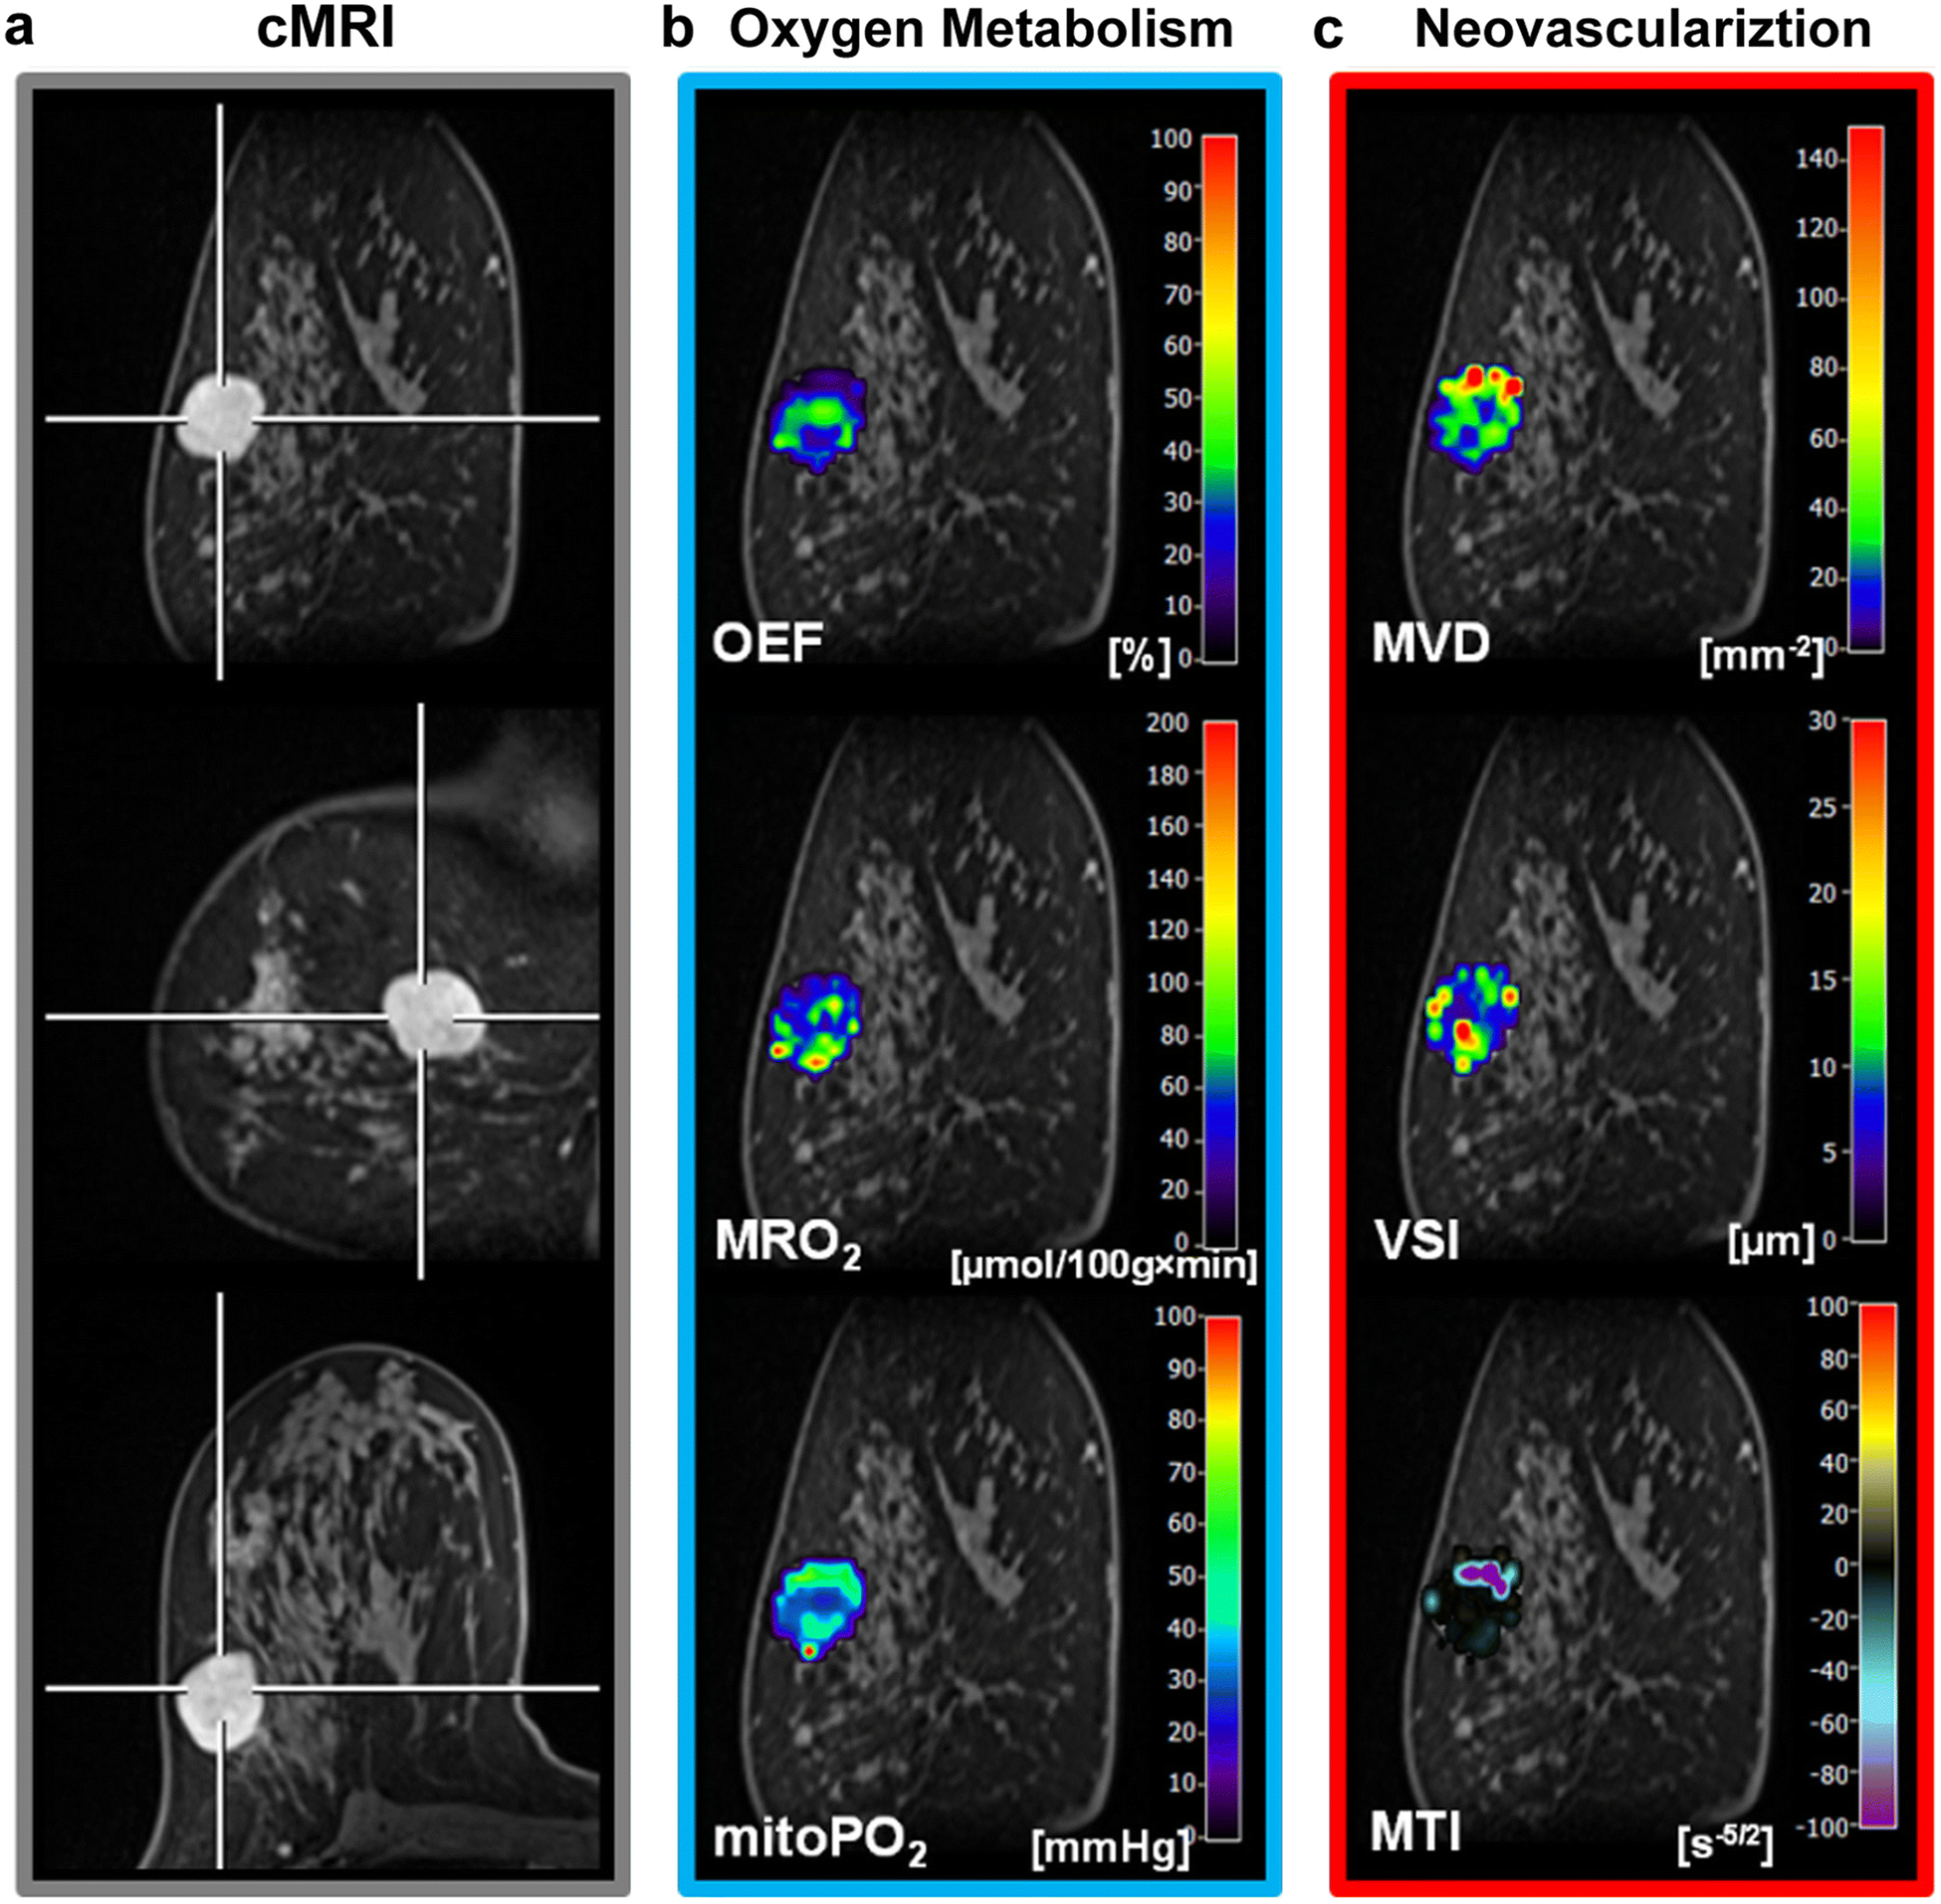
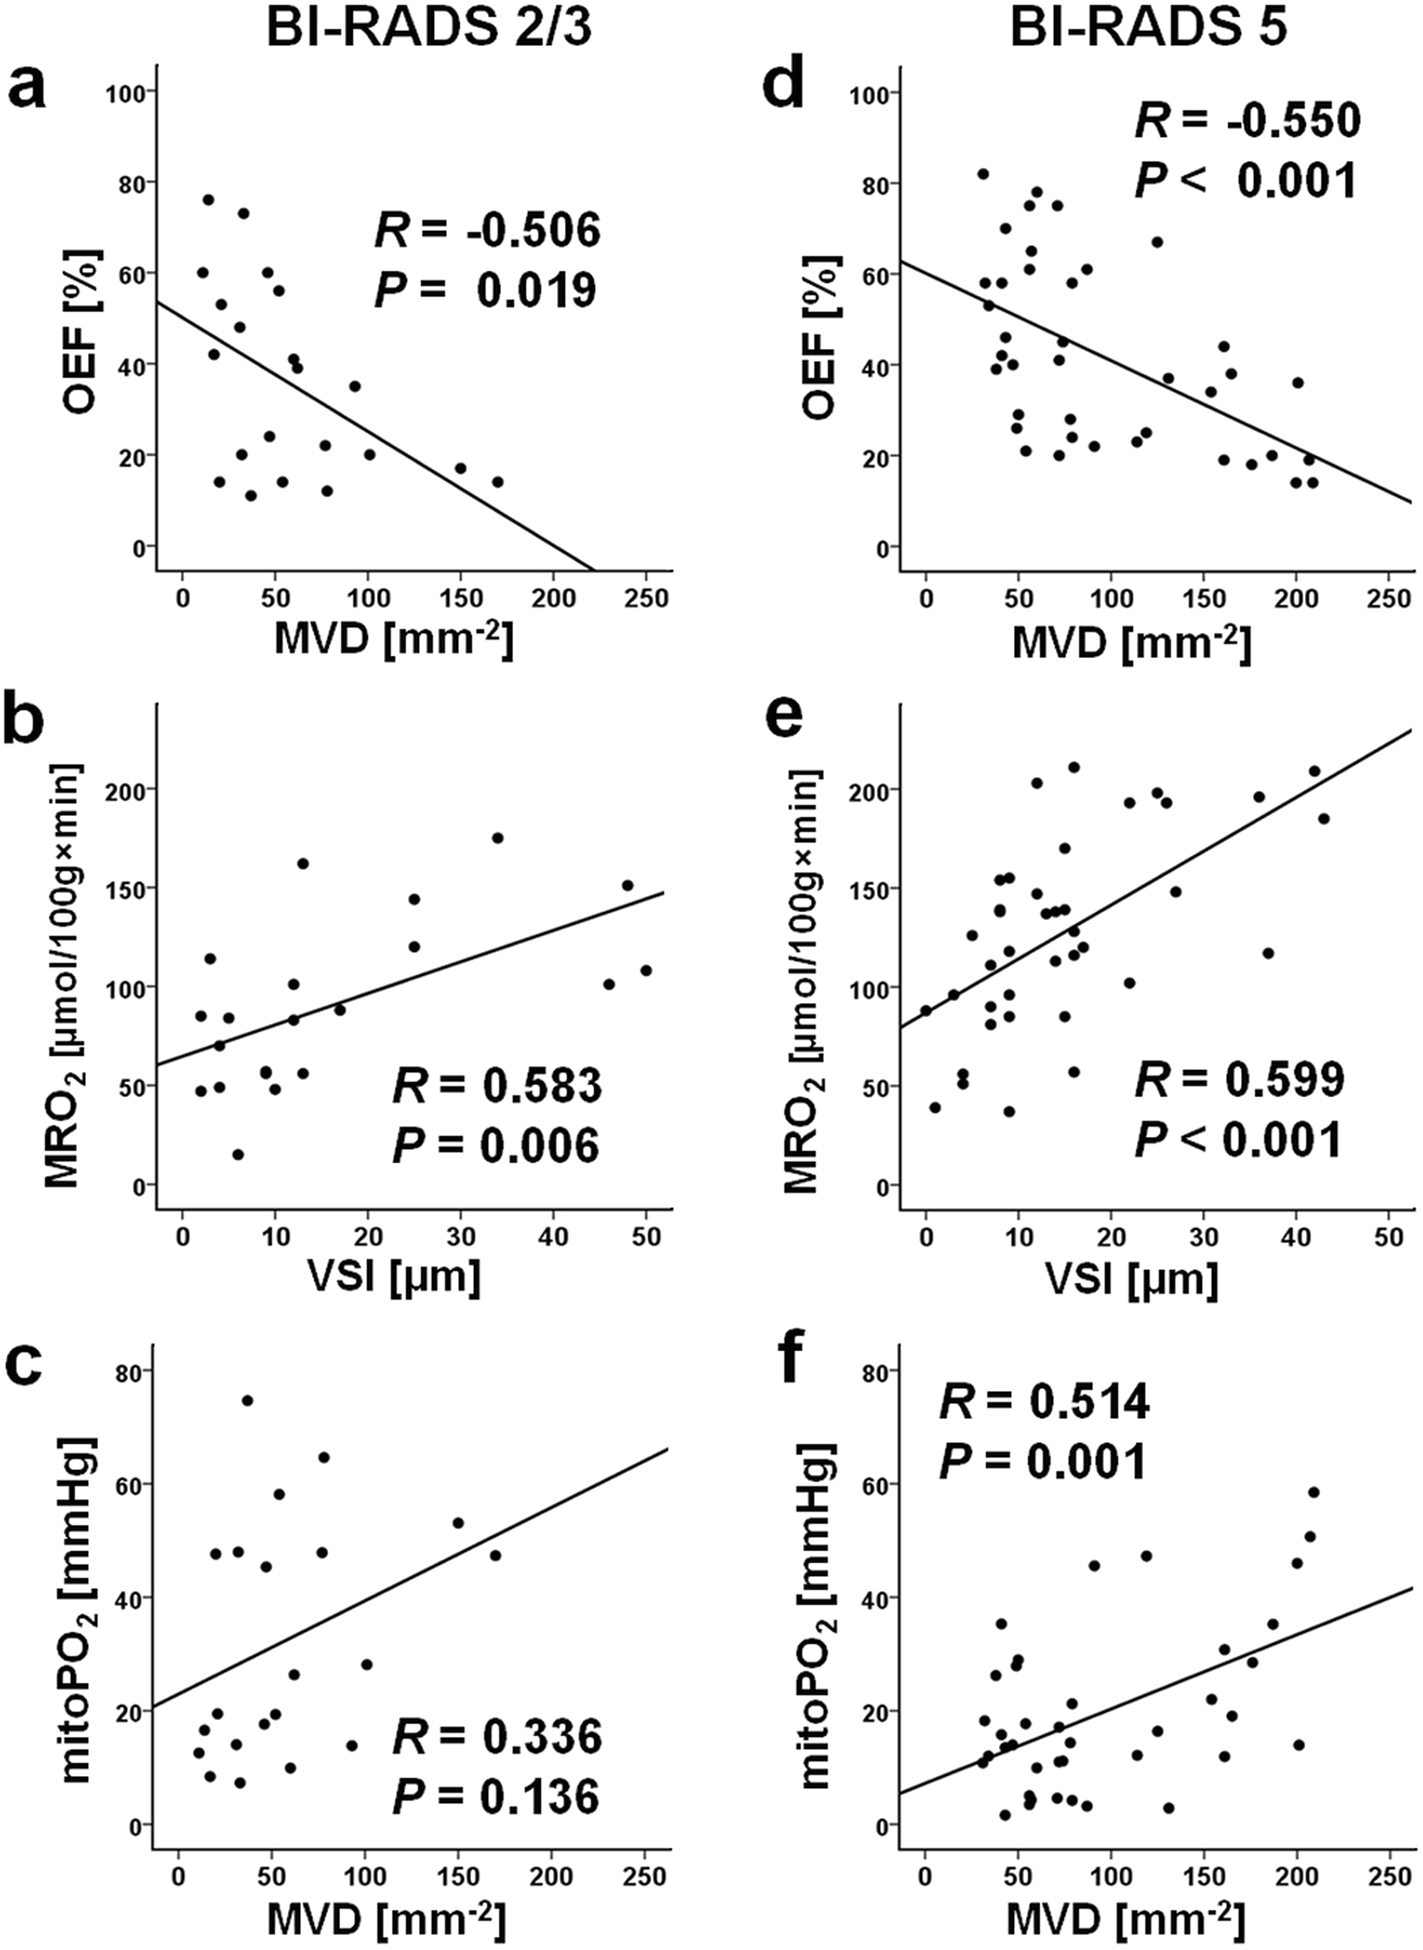
Procedures: In this IRB-approved prospective study, 20 patients with suspicious breast lesions (BI-RADS 4/5) underwent multiparametric breast MRI including quantitative BOLD (qBOLD) and vascular architecture mapping (VAM). Custom-made in-house MatLab software was used for qBOLD and VAM data postprocessing and calculation of quantitative MRI biomarker maps of oxygen extraction fraction (OEF), metabolic rate of oxygen (MRO2), and mitochondrial oxygen tension (mitoPO2) to measure tissue hypoxia and neovascularization including vascular architecture including microvessel radius (VSI), density (MVD), and type (MTI). Histopathology was used as standard of reference. Appropriate statistics were performed to assess and compare correlations between MRI biomarkers for hypoxia and neovascularization.
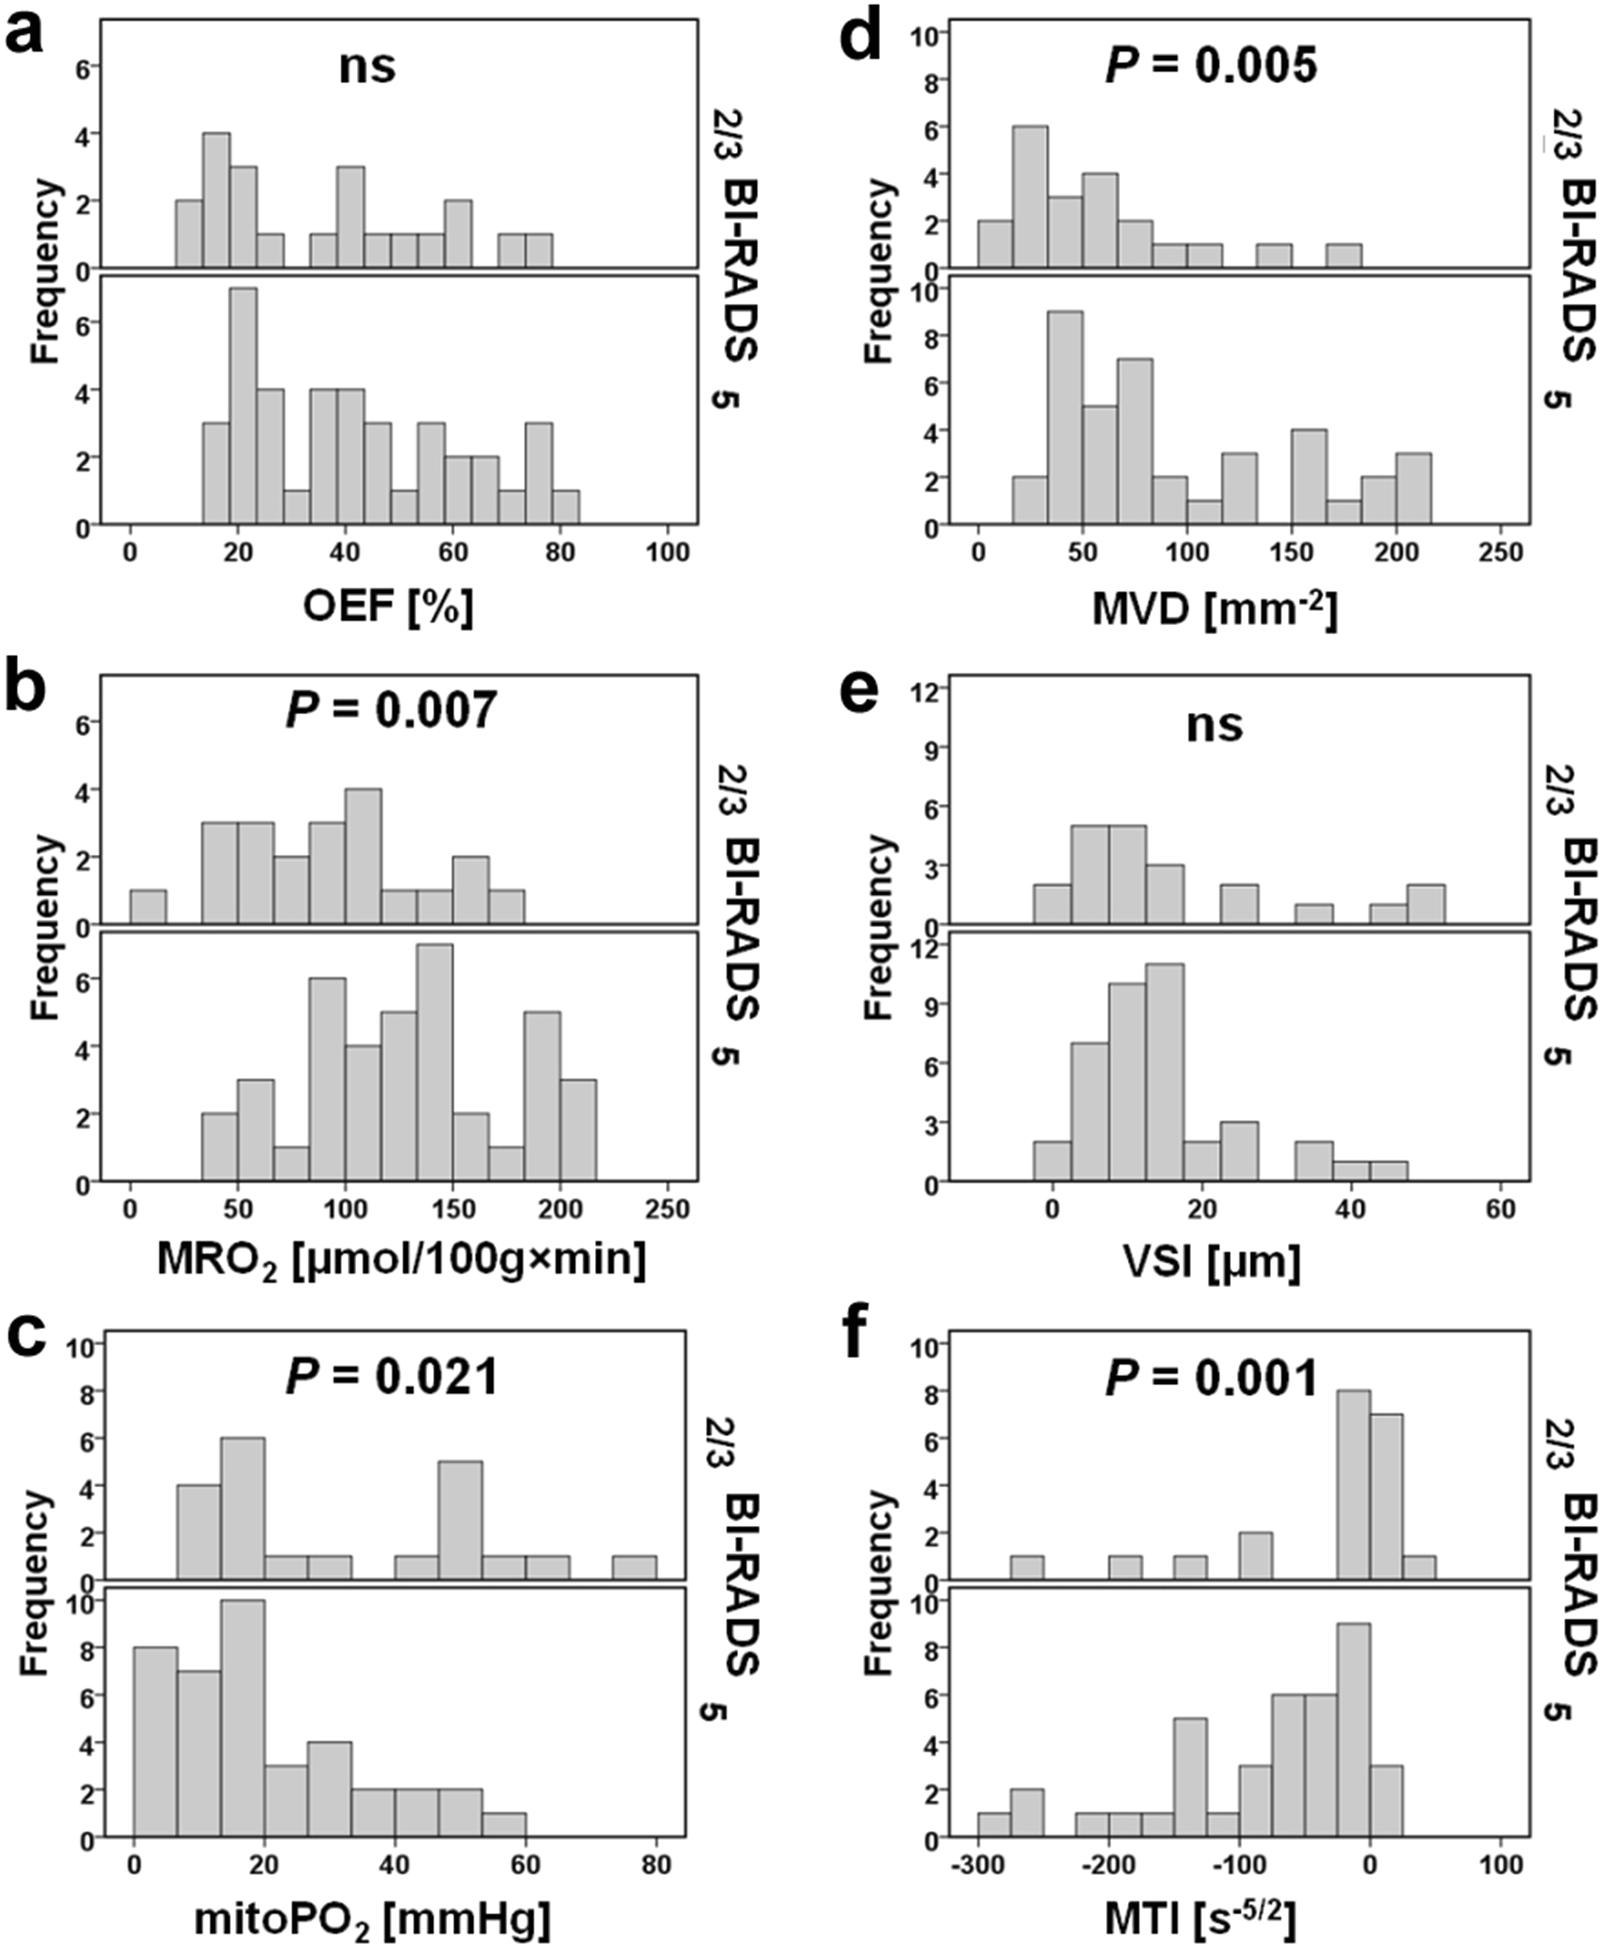
Results: qBOLD and VAM data with good quality were obtained from all patients with 13 invasive ductal carcinoma (IDC) and 7 benign breast tumors with a lesion diameter of at least 10 mm in all spatial directions. MRI biomarker maps of oxygen metabolism and neovascularization demonstrated intratumoral spatial heterogeneity with a broad range of biomarker values. Bulk tumor neovasculature consisted of draining venous microvasculature with slow flowing blood. High OEF and low mitoPO2 were associated with low MVD and vice versa. The heterogeneous pattern of MRO2 values showed spatial congruence with VSI. IDCs showed significantly higher MRO2 (P = 0.007), lower mitoPO2 (P = 0.021), higher MVD (P = 0.005), and lower (i.e., more pathologic) MTI (P = 0.001) compared with benign breast tumors. These results indicate that IDCs consume more oxygen and are more hypoxic and neovascularized than benign tumors.
Conclusions: We developed a novel MRI approach for the noninvasive assessment of hypoxia and neovascularization in benign and malignant breast tumors that can be easily integrated in a diagnostic MRI protocol and provides insight into intratumoral heterogeneity.
Keywords: Breast cancer; Imaging biomarkers; MRI; Neovascularization; Oxygen metabolism; Tumor hypoxia.
Conflict of interest statement
Conflict of Interest:
The authors declare that they have no conflict of interest.
Figures
Similar articles
-
Non-Invasive Assessment of Hypoxia and Neovascularization with MRI for Identification of Aggressive Breast Cancer.Cancers (Basel). 2020 Jul 24;12(8):2024. doi: 10.3390/cancers12082024. Cancers (Basel). 2020. PMID: 32721996 Free PMC article.
-
Vascular architecture mapping for early detection of glioblastoma recurrence.Neurosurg Focus. 2019 Dec 1;47(6):E14. doi: 10.3171/2019.9.FOCUS19613. Neurosurg Focus. 2019. PMID: 31786560
-
Intratumoral heterogeneity of oxygen metabolism and neovascularization uncovers 2 survival-relevant subgroups of IDH1 wild-type glioblastoma.Neuro Oncol. 2018 Oct 9;20(11):1536-1546. doi: 10.1093/neuonc/noy066. Neuro Oncol. 2018. PMID: 29718366 Free PMC article.
-
Assessment of Hypoxia in Breast Cancer: Emerging Functional MR Imaging and Spectroscopy Techniques and Clinical Applications.J Magn Reson Imaging. 2025 Jan;61(1):83-96. doi: 10.1002/jmri.29424. Epub 2024 May 4. J Magn Reson Imaging. 2025. PMID: 38703143 Review.
-
Imaging hypoxia in tumours with advanced MRI.Q J Nucl Med Mol Imaging. 2013 Sep;57(3):257-70. Q J Nucl Med Mol Imaging. 2013. PMID: 24045622 Review.
Cited by
-
[Multiparametric magnetic resonance imaging of the breast : What can we expect from the future?].Radiologie (Heidelb). 2025 Mar;65(3):162-169. doi: 10.1007/s00117-024-01390-1. Epub 2024 Nov 29. Radiologie (Heidelb). 2025. PMID: 39611894 Free PMC article. German.
-
Hypoxia in Breast Cancer-Scientific Translation to Therapeutic and Diagnostic Clinical Applications.Front Oncol. 2021 Mar 11;11:652266. doi: 10.3389/fonc.2021.652266. eCollection 2021. Front Oncol. 2021. PMID: 33777815 Free PMC article. Review.
-
PET/MRI of hypoxia and vascular function in ER-positive breast cancer: correlations with immunohistochemistry.Eur Radiol. 2023 Sep;33(9):6168-6178. doi: 10.1007/s00330-023-09572-6. Epub 2023 May 11. Eur Radiol. 2023. PMID: 37166494 Free PMC article.
-
Restricted Water Diffusion in Diffusion-Weighted Magnetic Resonance Imaging in Pancreatic Cancer is Associated with Tumor Hypoxia.Cancers (Basel). 2020 Dec 30;13(1):89. doi: 10.3390/cancers13010089. Cancers (Basel). 2020. PMID: 33396818 Free PMC article.
-
[Artificial intelligence in the diagnosis of breast cancer : Yesterday, today and tomorrow].Radiologe. 2020 Jan;60(1):56-63. doi: 10.1007/s00117-019-00615-y. Radiologe. 2020. PMID: 31811325 Review. German.
References
-
- Zardavas D, Irrthum A, Swanton C, Piccart M (2015) Clinical management of breast cancer heterogeneity. Nat Rev Clin Oncol 12:381–394. - PubMed
-
- Lam SW, Jimenez CR, Boven E (2014) Breast cancer classification by proteomic technologies: current state of knowledge. Cancer treatment reviews 40:129–138. - PubMed
-
- Huber KE, Carey LA, Wazer DE (2009) Breast cancer molecular subtypes in patients with locally advanced disease: impact on prognosis, patterns of recurrence, and response to therapy. Semin Radiat Oncol 19:204–210. - PubMed
Publication types
MeSH terms
Substances
Grants and funding
LinkOut - more resources
Full Text Sources
Medical
