. 2019 Jul;10(7):496-509.
doi: 10.1007/s13238-018-0596-6. Epub 2018 Nov 26.

Tongue coating microbiome as a potential biomarker for gastritis including precancerous cascade

Affiliations

Tongue coating microbiome as a potential biomarker for gastritis including precancerous cascade

Jiaxing Cui et al. Protein Cell. 2019 Jul.

Abstract

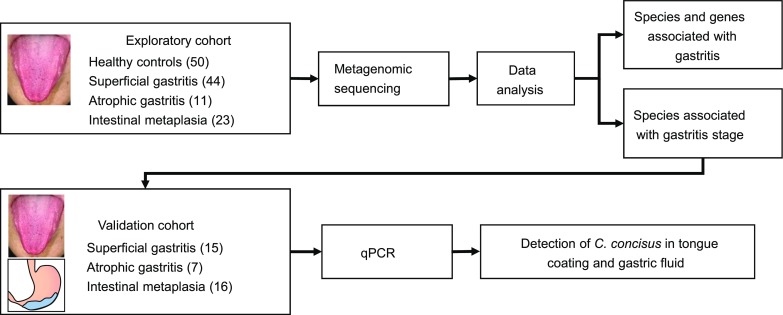
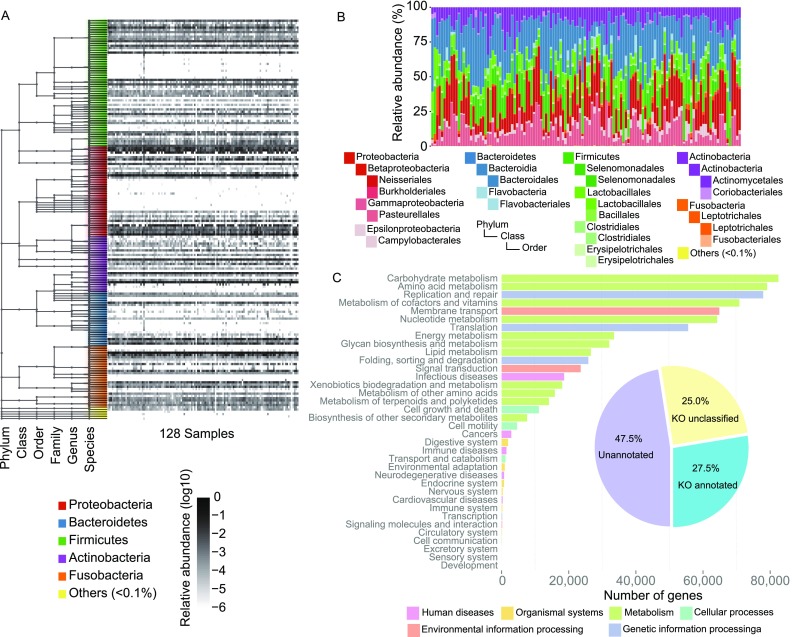
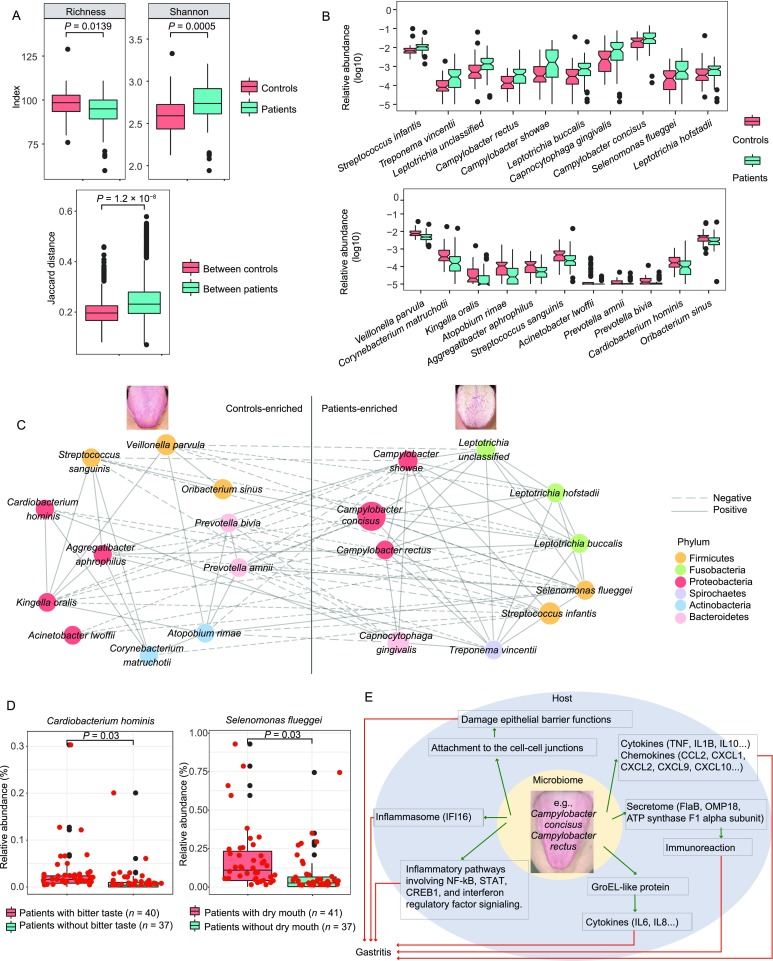
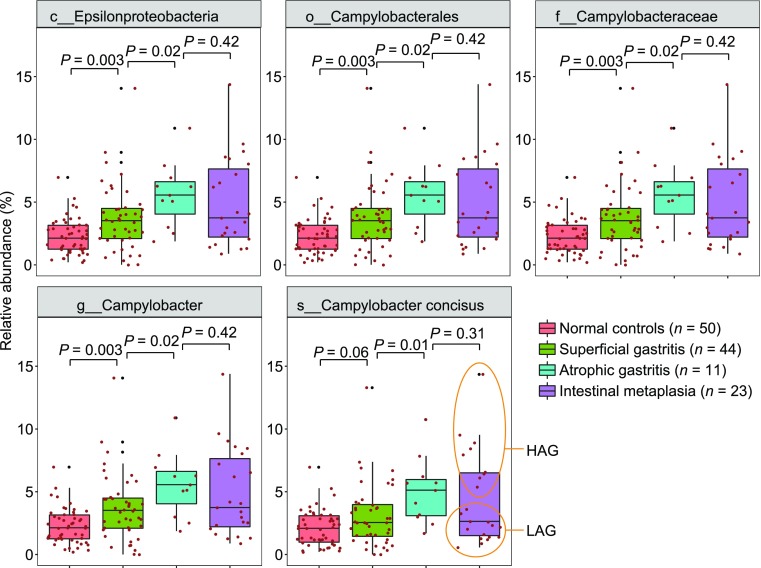
The development of gastritis is associated with an increased risk of gastric cancer. Current invasive gastritis diagnostic methods are not suitable for monitoring progress. In this work based on 78 gastritis patients and 50 healthy individuals, we observed that the variation of tongue-coating microbiota was associated with the occurrence and development of gastritis. Twenty-one microbial species were identified for differentiating tongue-coating microbiomes of gastritis and healthy individuals. Pathways such as microbial metabolism in diverse environments, biosynthesis of antibiotics and bacterial chemotaxis were up-regulated in gastritis patients. The abundance of Campylobacter concisus was found associated with the gastric precancerous cascade. Furthermore, Campylobacter concisus could be detected in tongue coating and gastric fluid in a validation cohort containing 38 gastritis patients. These observations provided biological evidence of tongue diagnosis in traditional Chinese medicine, and indicated that tongue-coating microbiome could be a potential non-invasive biomarker, which might be suitable for long-term monitoring of gastritis.

Keywords: Campylobacter concisus; gastritis; metagenomics; non-invasive biomarker; tongue coating.


Figures

Figure 1
Figure 1
Graphic summary of the study design
Figure 2
Figure 2
Taxonomy and gene profiles of the tongue-coating samples. (A) The relative abundance of species identified in tongue-coating samples, ordered by the taxonomy tree. (B) Relative abundance of major phyla across tongue-coating samples. (C) Gene counts annotated to different KO functions
Figure 3
Figure 3
Species with significantly different abundance in tongue coating of gastritis patients and normal controls. (A) Top, richness and Shannon index in normal controls and gastritis patients. Down, Jaccard distances between normal controls and between gastritis patients. (B) Top, significantly decreased abundance of species in gastritis patients. Down, significantly increased abundance of species in gastritis patients. Boxes describe the interquartile range (IQR). Red and green boxes represent the abundance of the species in normal controls and gastritis patients, respectively. The y-axis represents the log of the abundance of the corresponding species in all samples. Species from the left to the right were arranged in ascending order of P value. (C) A correlation network of species associated with gastritis. All nodes represented species that are potential biomarkers associated with gastritis. They were classified into two groups including controls-enriched species and patients-enriched species. The size of the nodes indicates the mean abundance of the species among all samples. The color of the nodes represents the taxonomy assignment, with nodes of the same color belonging to the same phylum. Edges between nodes represent the correlation between the abundance of two species. Two nodes are linked if the Spearman correlation test shows a P-value < 0.05. Solid lines represent a positive correlation, while dashed lines represent a negative correlation. The width of the edges is proportional to the correlation strength, and wide line indicates strong correlation. (D) Species whose abundance is associated with particular symptoms. Statistical comparison by Wilcoxon rank-sum test followed by false discovery rate correction. (E) A schematic diagram showing the potential functions of some species enriched in patients that have a predicted gastritis association
Figure 4
Figure 4
Up-regulated tongue-coating microbial genes and enriched pathways. Blue nodes represent KEGG KOs, and yellow nodes represent KEGG pathways. The edge between two nodes indicates that the gene was in the pathway. The size of the yellow node is proportional to the connection degree, i.e., pathways with a higher number of up-regulated genes exhibit larger nodes
Figure 5
Figure 5
The abundance of Campylobacter concisus during the precancerous cascade. Boxes describe the interquartile range (IQR). The y-axis represents the relative abundance of the corresponding species in all samples. Statistical comparison by Wilcoxon rank-sum test

References

    1. Allos BM. Campylobacter jejuni Infections: update on emerging issues and trends. Clin Infect Dis. 2001;32:1201–1206. doi: 10.1086/319760. - DOI - PubMed
    1. Altschul SF, Gish W, Miller W, Myers EW, Lipman DJ. Basic local alignment search tool. J Mol Biol. 1990;215:403–410. doi: 10.1016/S0022-2836(05)80360-2. - DOI - PubMed
    1. Aviles-Jimenez F, Vazquez-Jimenez F, Medrano-Guzman R, Mantilla A, Torres J. Stomach microbiota composition varies between patients with non-atrophic gastritis and patients with intestinal type of gastric cancer. Sci Rep. 2014;4:4202. doi: 10.1038/srep04202. - DOI - PMC - PubMed
    1. Carl Nathan AD. Nonresolving inflammation. Cell. 2010;19:871–882. doi: 10.1016/j.cell.2010.02.029. - DOI - PubMed
    1. Coker OO, Dai Z, Nie Y, Zhao G, Cao L, Nakatsu G, Wu WK, Wong SH, Chen Z, Sung JJY, et al. Mucosal microbiome dysbiosis in gastric carcinogenesis. 2017;Gut:2017–314281. - PMC - PubMed

Publication types