. 2018 Nov 27;9(1):5006.
doi: 10.1038/s41467-018-07344-1.

PTEN expression by an oncolytic herpesvirus directs T-cell mediated tumor clearance

Affiliations

PTEN expression by an oncolytic herpesvirus directs T-cell mediated tumor clearance

Luke Russell et al. Nat Commun. .

Abstract

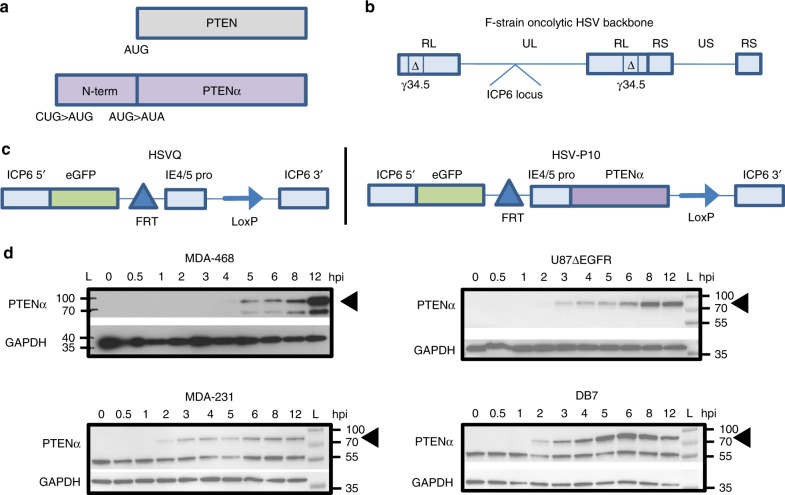
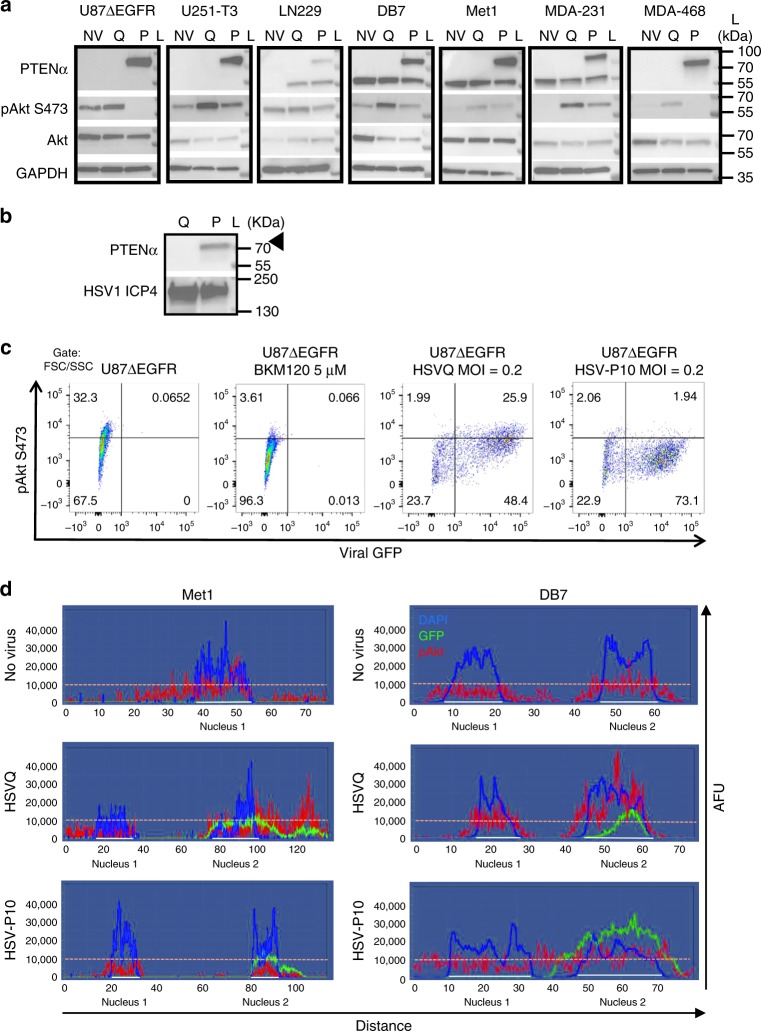
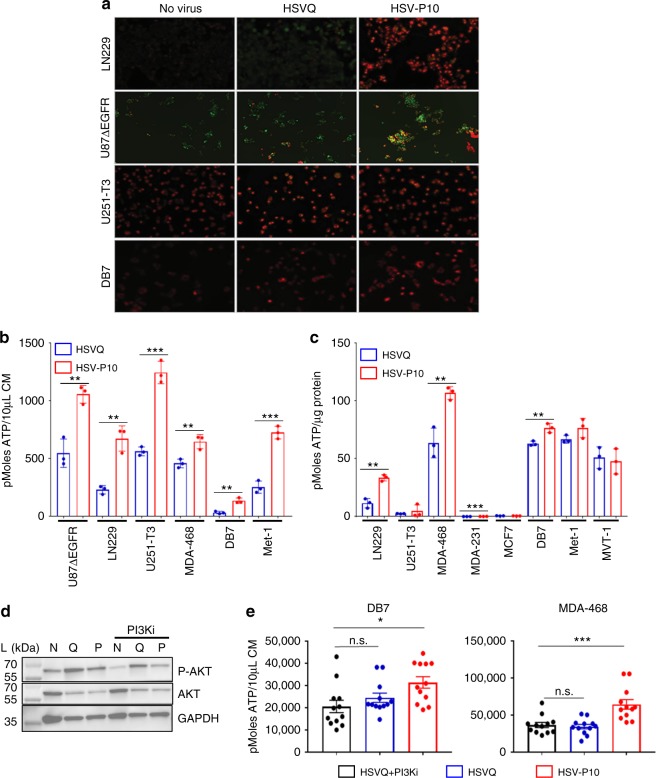
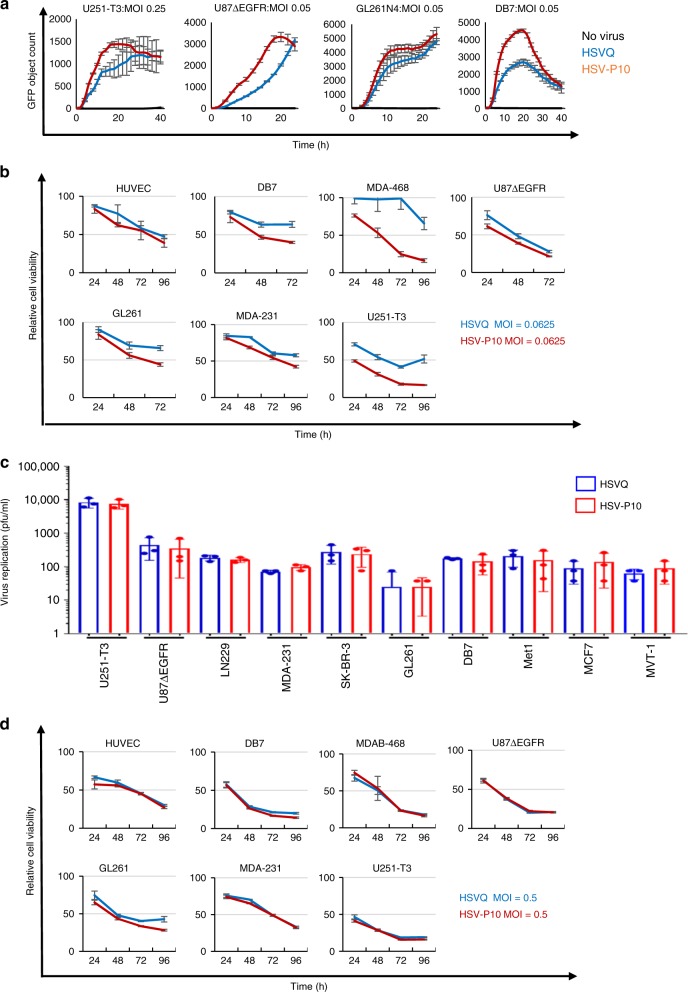
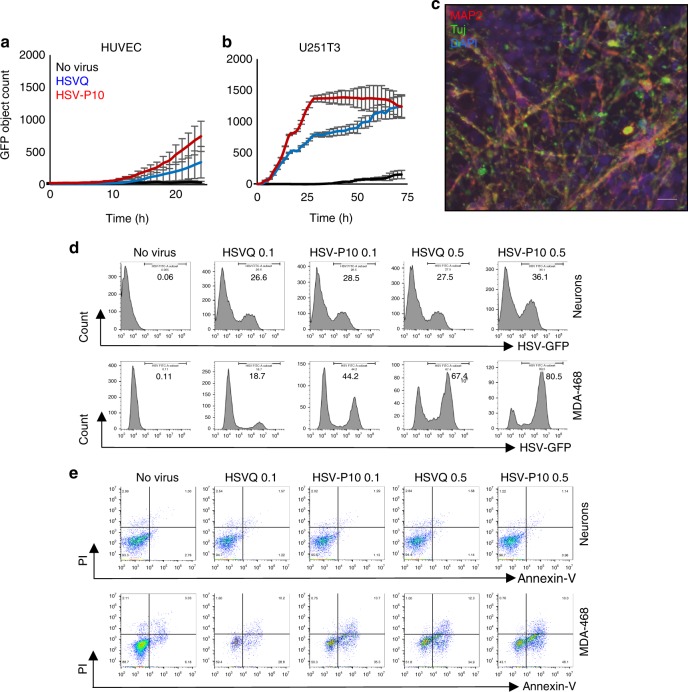
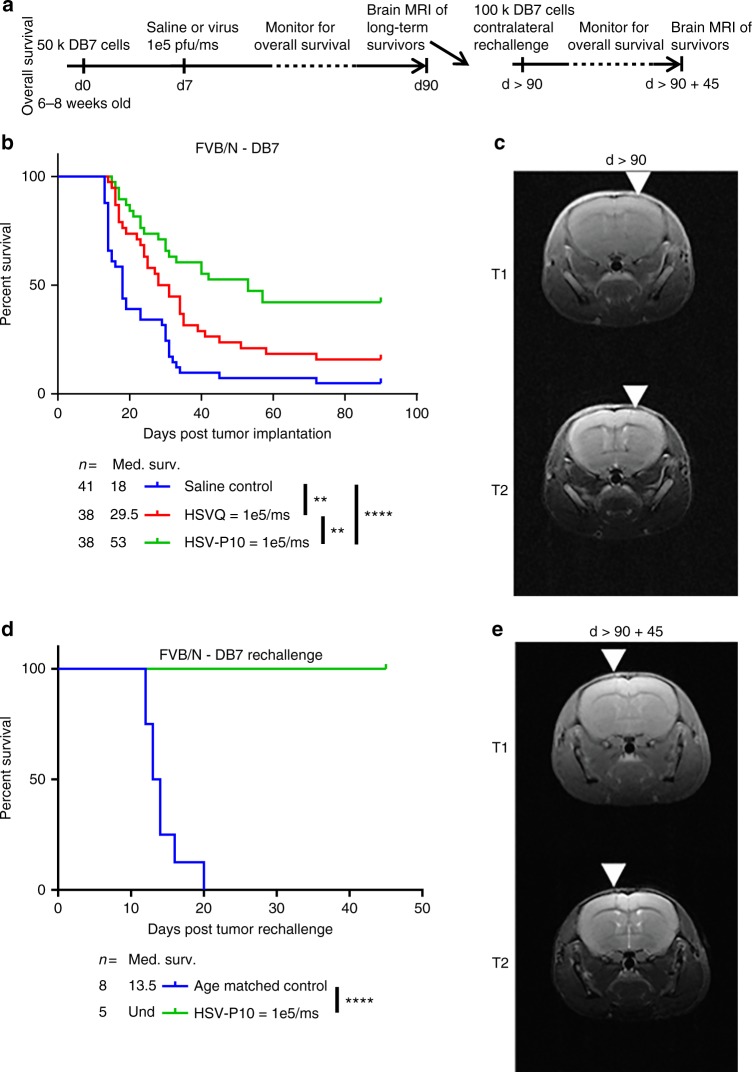
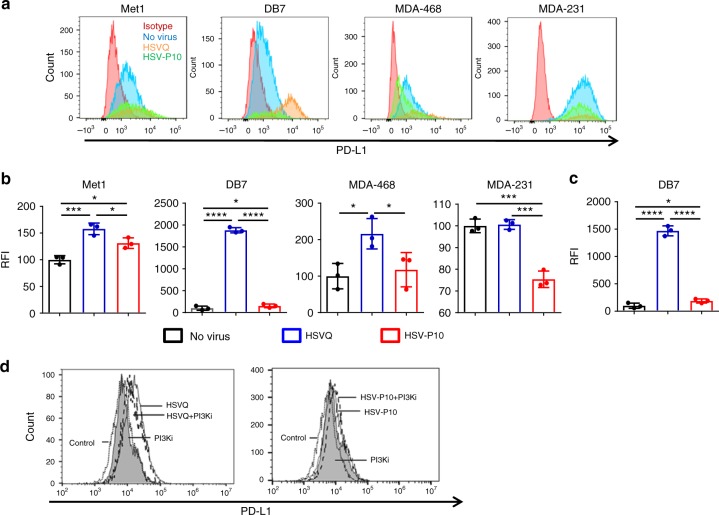
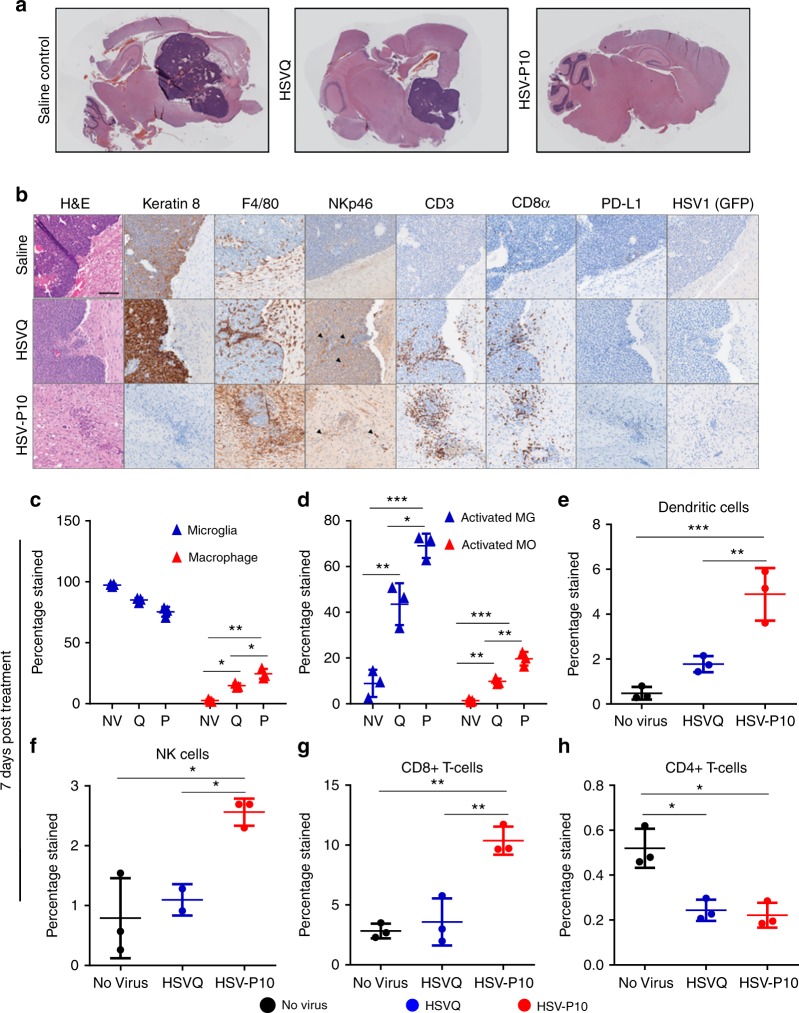
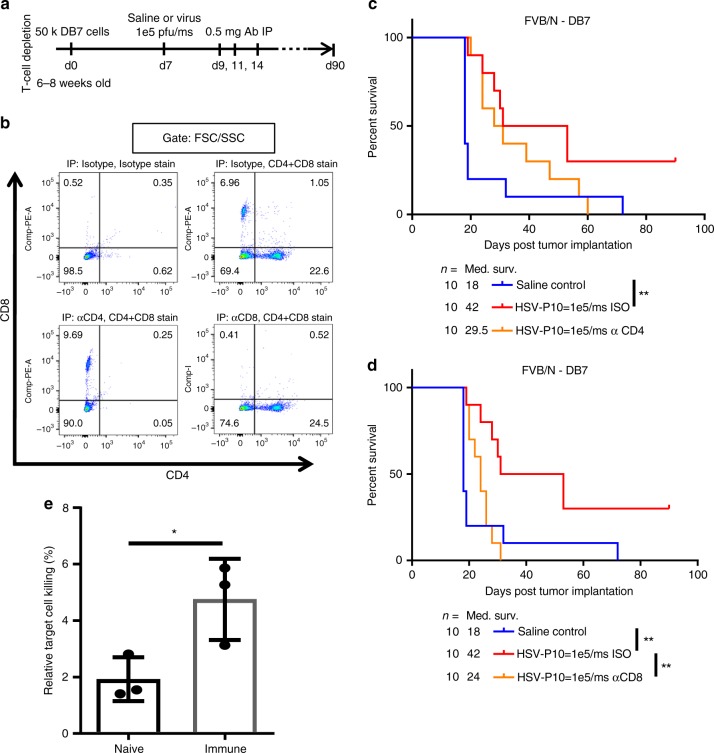
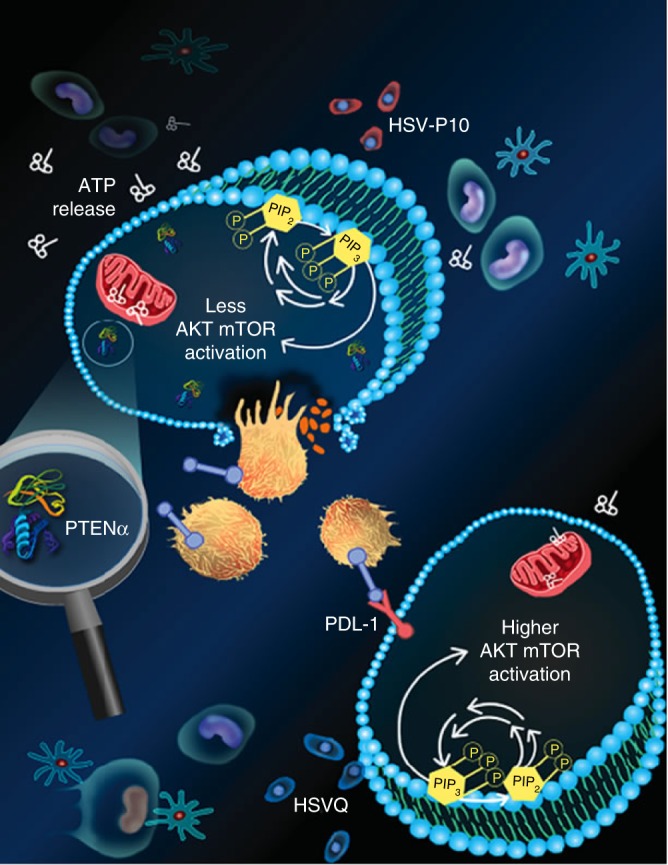
Engineered oncolytic viruses are used clinically to destroy cancer cells and have the ability to boost anticancer immunity. Phosphatase and tensin homolog deleted on chromosome 10 loss is common across a broad range of malignancies, and is implicated in immune escape. The N-terminally extended isoform, phosphatase and tensin homolog deleted on chromosome 10 alpha (PTENα), regulates cellular functions including protein kinase B signaling and mitochondrial adenosine triphosphate production. Here we constructed HSV-P10, a replicating, PTENα expressing oncolytic herpesvirus, and demonstrate that it inhibits PI3K/AKT signaling, increases cellular adenosine triphosphate secretion, and reduces programmed death-ligand 1 expression in infected tumor cells, thus priming an adaptive immune response and overcoming tumor immune escape. A single dose of HSV-P10 resulted in long term survivors in mice bearing intracranial tumors, priming anticancer T-cell immunity leading to tumor rejection. This implicates HSV-P10 as an oncolytic and immune stimulating therapeutic for anticancer therapy.


Conflict of interest statement

B.K. is an inventor of patent application: WO2018023114A1, which described HSV-P10.

Figures

Fig. 1
Fig. 1
HSV-P10 construction and characterization. a Graphical representation of PTEN and PTENα coding sequences showing the mutations engineered in PTENα start codons to enhance translation of full-length PTENα. bc Graphical representation of the DNA structure of wild-type F-strain HSV1 backbone showing doubly deleted γ34.5 genes, and gene-disrupting insertional ICP6 locus containing an enhanced green fluorescent protein (eGFP) gene with PTENα insertion (HSV-P10) or without PTENα (HSVQ). d PTENα production in infected tumor cell lysates over time. The indicated tumor cells were infected with HSV-P10 at MOI = 0.5 and harvested 0–12 hpi and probed for PTEN by western blot
Fig. 2
Fig. 2
HSV-P10 AKT inhibition. a Western blots of lysates from the indicated cells infected with HSVQ (Q) or HSV-P10 (P) or left untreated (NV). Infected cells (MOI = 1) were lysed 24 hpi and probed for expression of PTENα, pAKT (S473), Akt, and GAPDH. L indicates the moleculcar weight ladder. b Western blot for secreted PTEN expression in conditioned medium. Culture media was concentrated 20X from U87∆EGFR cells infected 24 h with either HSVQ (Q) or HSV-P10 (P10) and probed for secreted PTENα. L indicates the molecular weight ladder. c Flow cytometric analysis of pAkt-S473 and virus encoded GFP in infected U87∆EGFR cells 15 hpi. d Spectral analysis of fluorescent intensity along a random line drawn across the view field of one or two cells visualizing pAKT (red), DAPI (blue) and GFP (green) of the indicated cells. y-axis represents arbitrary fluorescence units (AFU). Note the higher intensity of pAKT in HSVQ-infected (GFP positive) cells relative to adjacent uninfected (GFP negative) cell (middle panel). Note the lack of increased pAKT intensity in HSV-P10 infected (GFP positive) cells relative to adjacent uninfected (GFP negative) cells (bottom panel)
Fig. 3
Fig. 3
Effects of PTENα on HSV-P10 infected cells. a Increased mitochondrial membrane potential in HSV-P10 infected cells 6 hpi. Seeded cells were infected with either HSVQ or HSV-P10 at MOI = 0.5 for 6 h, and mitochondrial membrane potential indicated by JC-1 red fluorescence was imaged using fluorescence microscopy. Scale bar = 100 µm. b ATP release from infected cells 24 hpi. Data shown are mean ATP concentration in conditioned media from infected cells 24 hpi ± S.D. Statistical analysis performed with a 2-tailed Student’s T-test. (n = 3/group, **p < 0.01, ***p < 0.001). c ATP measured in cell lysates of infected cells 24 hpi. Data shown are mean ATP concentration 24 hpi ± S.D. Statistical analysis performed with a 2-tailed Student’s T-test. (n = 3/group, **p < 0.01, ***p < 0.001). d Western blot of DB7 cells 24 hpi with HSVQ (Q), HSV-P10 (P), or left untreated (NV) ± PI3Ki (LY294002). L indicates the molecular weight ladder. e ATP release from DB7 or MDA-468 cells 12 hpi with HSVQ or HSV-P10. HSVQ and PI3Ki treated samples were also evaluated for ATP release. Data shown are mean ATP concentrations in conditioned media from infected cells ± SEM. Statistical analysis performed with a 2-tailed Student’s T-test (n = 6/group, *p < 0.05, ***p < 0.001, n.s. = not significant)
Fig. 4
Fig. 4
Kinetics of HSV-P10. a Comparison of HSVQ and HSV-P10 virus replication in the indicated cells. Seeded tumor cells were infected at the designated MOIs and GFP expression was monitored for 24–48 h utilizing the Cytation 5 Cell Imaging Multi-Mode Reader in conjunction with a BioSpa 8 Automated Incubator (BioTek Instruments, INC.). GFP object count was quantified and graphed as an average of 4 wells per treatment group ± SEM. Black line: no virus, blue line: HSVQ, red line: HSV-P10. b Cytolytic activity of HSVQ (blue line) vs. HSV-P10 (red line) at a low MOI. Cell viability of HSVQ or HSV-P10 infected tumor cell lines at MOI = 0.0625 for all cells at the indicated time points after infection as measured by MTT. Data shown are percentage of viable cells relative to uninfected controls ± S.D. (n = 6). c Comparison of HSVQ and HSV-P10 viral yield (burst size). Data shown are median titers from cultures ± S.D. (n = 3/group). d Cytolytic activity of HSVQ (blue line) vs. HSV-P10 (red line) at high MOI. Cell viability of HSVQ or HSV-P10 infected tumor cell lines at MOI = 0.5 for all cells at the indicated time points after infection as measured by MTT. Data shown are percentage of viable cells relative to uninfected controls ± S.D. (n = 6)
Fig. 5
Fig. 5
Safety of HSV-P10. Viral spread of HSVQ (blue line) and HSV-P10 (red line) in cultures of HUVEC (a) and U251T3 tumor cells (b) was assessed using the Cytation 5 live imaging system, where GFP expression was monitored over time. GFP object count was quantified and graphed as an average of 4 wells per treatment group ± SEM. c Immunofluorescent staining of differentiated neurons showing MAP2 and Tuj1 staining. Scale bar = 50 µm. d Infection (GFP) of neurons and MDA468 cells followed by GFP visualization. Data shown are histograms of the indicated cells infected with HSVQ or HSV-P10. e Cytolytic activity (PI/Annexin-V) in neurons was assessed by flow cytometry 24 hpi. Dot blots of annexin and PI staining of infected (GFP positive) neurons and MDA-468 cells
Fig. 6
Fig. 6
HSV-P10 enhances overall survival of mice bearing breast cancer brain metastases. a Schematic representation of animal studies. b Survival curve of DB7 brain tumor-bearing FVB/N mice treated intratumorally with saline control (blue line: n = 41), HSVQ (red line: n = 38), or HSV-P10 (green line: n = 38) 7 days post tumor cell implantation. Significance in survival was assessed by Logrank (Mantel–Cox) test comparing only two survival curves per test (**p < 0.01, ****p < 0.0001). c Brain magnetic resonance imaging (MRI) of one representative long-term survivor mouse treated with HSV-P10 from Fig. 5b > 90 days post tumor cell implantation. White arrows indicate the needle track of the initial injection site. d Survival curve of HSV-P10 treated long-term survivor mice (green line: n = 5) from Fig. 5b contralaterally inoculated with 100,000 DB7 tumor cells vs. naive age-matched control mice (blue line: n = 8). Significance in survival was assessed by Logrank (Mantel–Cox) test (***p < 0.001). e Brain MRI of one representative long-term survivor mouse from Fig. 5d 45 days post tumor rechallenge. White arrows indicate the needle track of the rechallenge injection site
Fig. 7
Fig. 7
HSV-P10 reduces cell-surface PD-L1 expression. a Histograms of PD-L1 expression as measured by flow cytometry 16 hpi in a panel of human and mouse cancer cell lines. Gates were placed on live cells, and then for GFP positive cells. Relative fluoresence intensity was calculated based upon PD-L1 stain. Red histogram: isotype control, blue histogram: no virus, orange histogram: HSVQ, green histogram: HSV-P10. b Quantification of relative median fluorescence intensity (RFI) of the indicated cells treated with no virus, HSVQ or HSV-P10 and stained with PDL-1 antibody where statistical significance was assessed by one-way ANOVA (n = 3/group, *p < 0.05, ***p < 0.001, ****p < 0.0001). c Changes in PD-L1 expression ( ± s.d.) on uninfected (GFP negative) DB7 cells following low-MOI infection with either HSVQ or HSV-P10 where statistical significance was assessed by one-way ANOVA (n = 3, *p < 0.05, ****p < 0.0001). Gates were placed on live cells, and then for GFP negative cells. Relative fluoresence intensity was calculated based upon PD-L1 stain. d Changes in PD-L1 expression measured by flow cytometry 12 hpi in infected DB7 cells treated with HSVQ ± PI3Ki or HSV-P10 (LY294002). Gating schematics are outlined in supplementary figure 5
Fig. 8
Fig. 8
HSV-P10 induces enhanced immune cell influx towards infected tumors. Tumor-bearing FVB/N mice were treated with 1e5 pfu of HSVQ, HSV-P10, or saline control 8 days post tumor implantation. a Stitched 4X bright field images of H&E stained sagittal sections of mouse brains 3 days post virus injection. b Representative 20X bright field images of H&E, Keratin 8, F4/80, NKp46, CD3, CD8α, PD-L1, and HSV1 (GFP) from sagittal sections of mouse brains 3 days post virus injection. Scale = 0.1 mm. c Ratio of macrophages (CD11b + F4/80 + CD45bright) to microglia (CD11b + F4/80 + CD45dim). d Percentage of cells in c positive for MHC-II. e Dendritic cell (CD11c + CD80 + MHC-II + ) infiltration. f NK cell (CD49b + NKp46 + ) infiltration. g CD8 + T-cell (CD3 + CD4 + ) infiltration. h CD4 + T-cell (CD3 + CD8 + ) infiltration. Data shown are averages ± s.d (n = 3/group) Statistical significance was assessed by one-way ANAOVA (n = 3, *p < 0.05, ***p < 0.001, ****p < 0.0001). Gating strategies for (ch) are decribed in supplementary figure 6
Fig. 9
Fig. 9
Role for T-cell immunity in virus-mediated tumor clearance. a Schematic representation of T-cell depletion study. b Confirmation of T-cell depletion by IP anti-CD4, anti-CD8, or isotype treatment 24 h prior to harvesting. Splenocytes were isolated 24 h after IP administration of anti-T-cell depletion antibodies in naïve FVB/N mice, and probed for CD3 + , CD4 + , and CD8 + T-cells as measured by flow cytometry. Live spenocytes were gated using forward and side scatter, and then gated on CD4-FITC and CD8-PE. Single-color positive quadrants (Q1 for CD8 + and Q3 for CD4 + ) were interrogated to determine depletion. c Survival of DB7 tumor-bearing FVB/N mice treated with saline control or HSV-P10 7 days post tumor cell implantation, and isotype or anti-CD4 antibodies 2, 4, and 7 days post virus injection. Significance in survival was assessed by Logrank (Mantel–Cox) test (n = 10, **p < 0.01). d Survival of DB7 tumor-bearing FVB/N mice treated with saline control or HSV-P10 7 days post tumor cell implantation, and isotype or anti-CD8 antibodies 2, 4, and 7 days post virus injection as indicated. Significance in survival was assessed by Logrank (Mantel–Cox) test (n = 10, **p < 0.01). e 51Cr release from uninfected DB7 tumor cells co-cultured with CD3 + splenocytes from untreated naive or immune mice from Fig. 5d. Data shown are averages ± s.d. Statistical significance was assessed by one-tailed Student’s T-test (n = 3, *p < 0.05)
Fig. 10
Fig. 10
Schematic representation of HSV-P10 antitumor activity: HSVQ (blue) infection (bottom cell) activates AKT/mTOR signaling, initiating the induction of cell surface PDL-1 that provides an immunosuppressive signal to immune cells in the tumor microenvironment. Upon infection with HSV-P10 (red), PTENα expression in infected cells reduces the ratio of Phosphatidyl inositol triphosphate to Phosphatidyl inositol bi phosphate (PIP3/PIP2), and thus consequently negatively regulates AKT/mTOR pathway. PTENα also homes to the mitochondria resulting in increased ATP release from the tumor cells infected with HSV-P10, which activates a robust antitumor immune response. The increased infiltration of activated macrophages, neutrophils, and CD8 + T-cells results in a more efficient tumor cell lysis, and translates to a better therapeutic efficacy

References

    1. Willett A, Wilkinson JBen, Shah C, Mehta MP. Management of solitary and multiple brain metastases from breast cancer. Indian J. Med. Paediatr. Oncol. 2015;36:87–93. doi: 10.4103/0971-5851.158835. - DOI - PMC - PubMed
    1. De Robles P, et al. The worldwide incidence and prevalence of primary brain tumors: a systematic review and meta-analysis. Neuro. Oncol. 2015;17:776–783. doi: 10.1093/neuonc/nou283. - DOI - PMC - PubMed
    1. Nayak L, Lee EQ, Wen PY. Epidemiology of brain metastases. Curr. Oncol. Rep. 2012;14:48–54. doi: 10.1007/s11912-011-0203-y. - DOI - PubMed
    1. Stupp R, et al. Radiotherapy plus concomitant and adjuvant temozolomide for glioblastoma. N. Engl. J. Med. 2005;352:987–996. doi: 10.1056/NEJMoa043330. - DOI - PubMed
    1. Rusthoven CG, et al. Combined-modality therapy with radiation and chemotherapy for elderly patients with glioblastoma in the temozolomide era: A national cancer database analysis. JAMA Neurol. 2016;73:821–828. doi: 10.1001/jamaneurol.2016.0839. - DOI - PubMed

Publication types