. 2018 Nov 27;9(1):5009.
doi: 10.1038/s41467-018-07308-5.

Vasculogenic mimicry formation in EBV-associated epithelial malignancies

Affiliations

Vasculogenic mimicry formation in EBV-associated epithelial malignancies

Tong Xiang et al. Nat Commun. .

Retraction in

Abstract

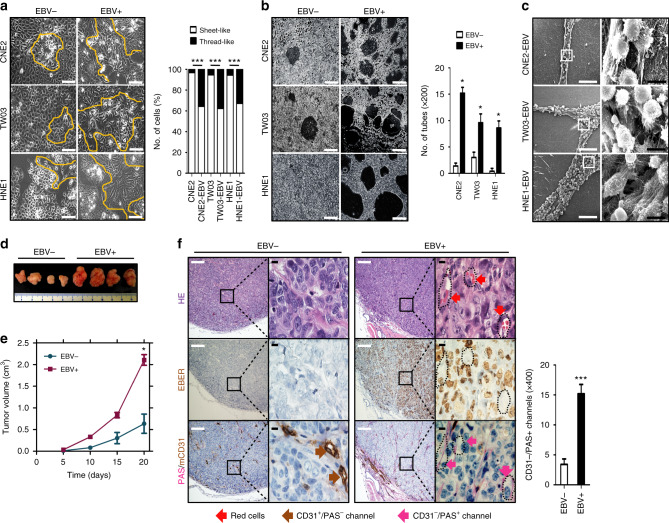
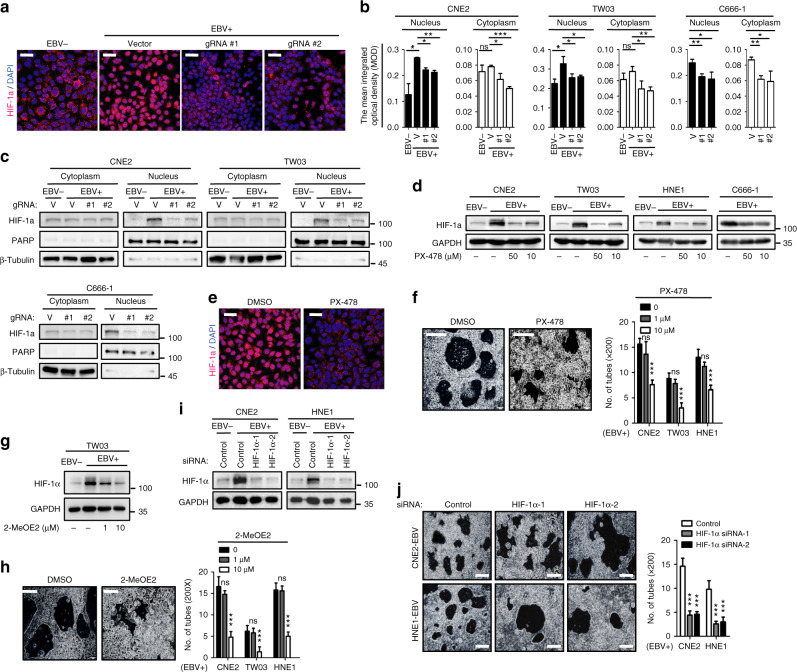
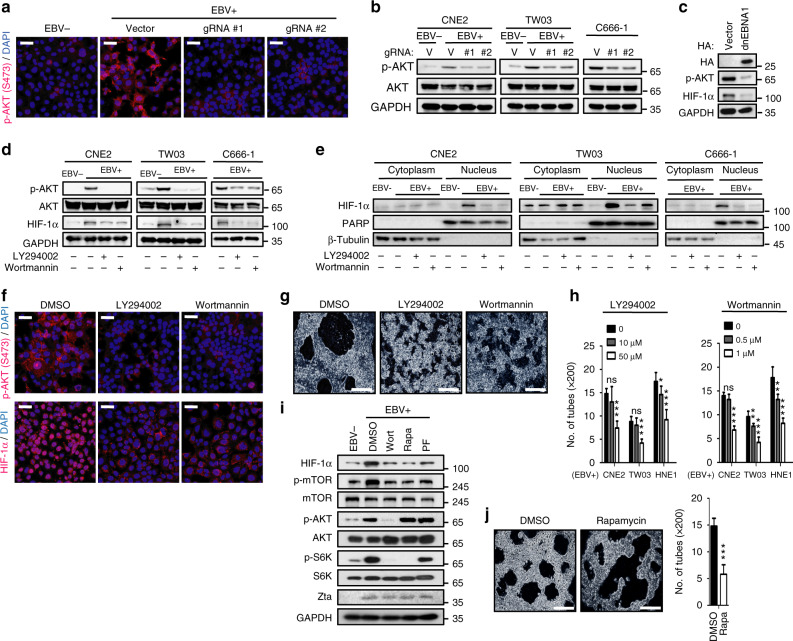
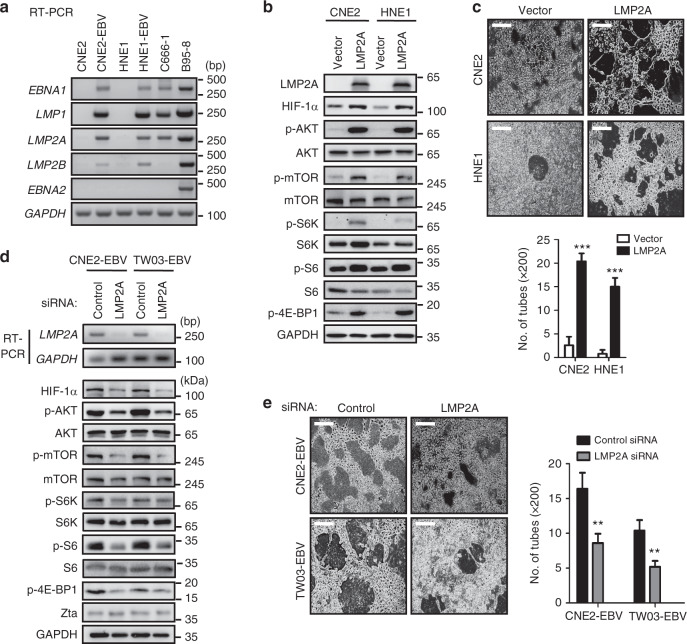
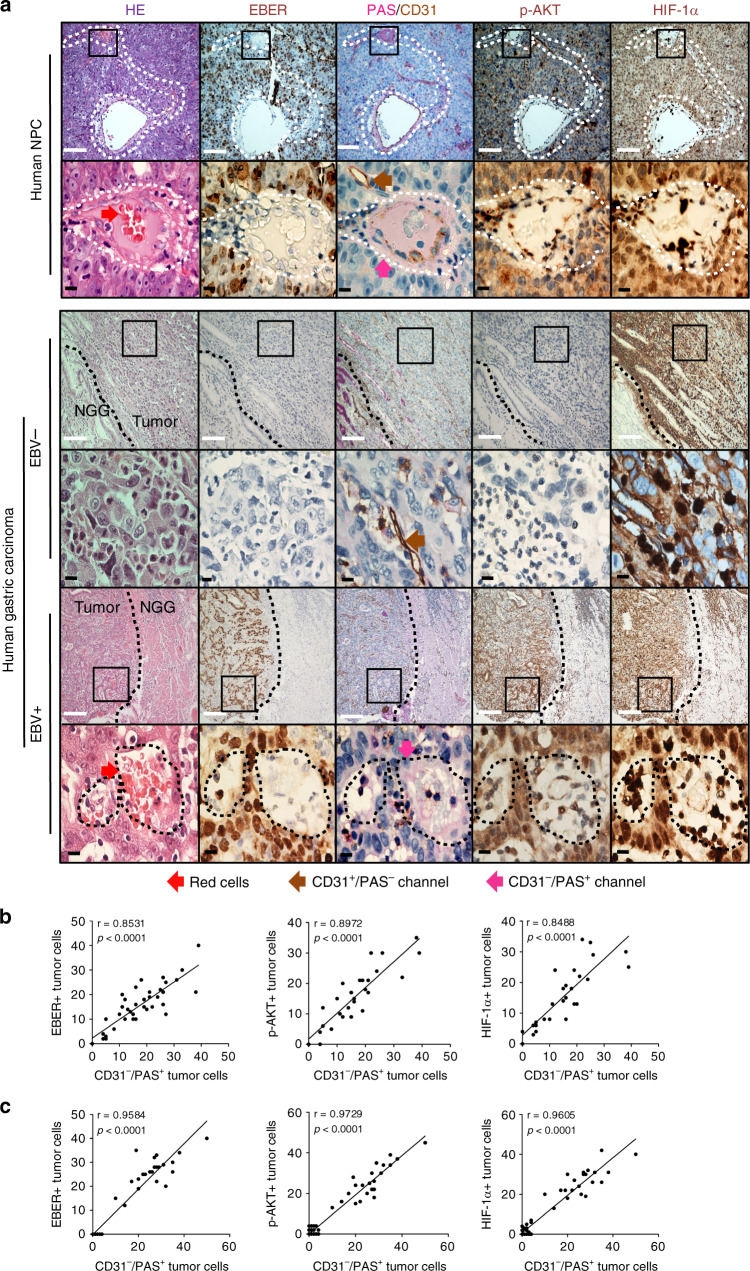
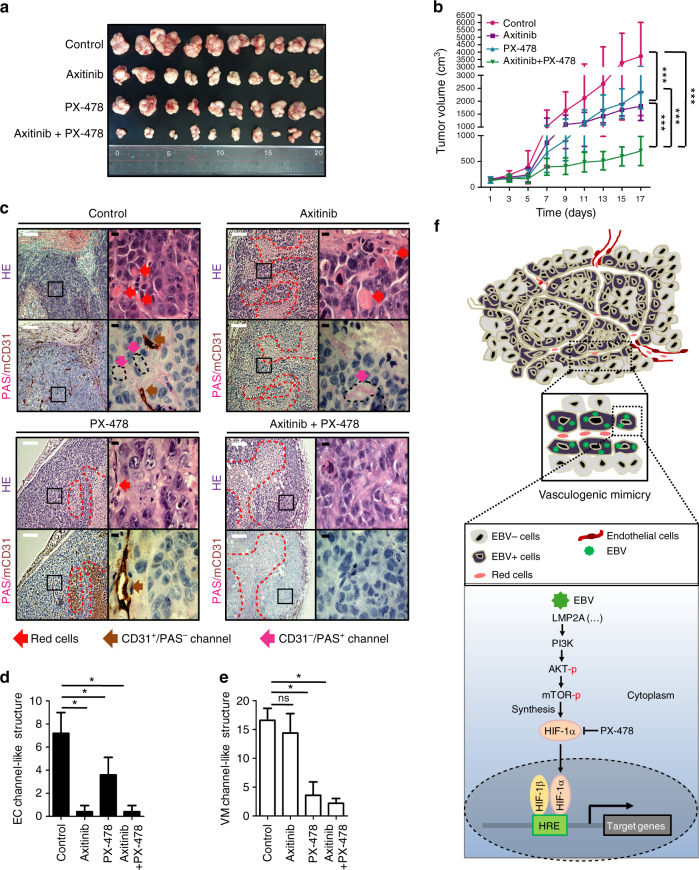
Epstein-Barr virus (EBV)-associated epithelial cancers, including nasopharyngeal carcinoma (NPC) and approximately 10% of gastric cancers, termed EBVaGC, represent 80% of all EBV-related malignancies. However, the exact role of EBV in epithelial cancers remains elusive. Here, we report that EBV functions in vasculogenic mimicry (VM). Epithelial cancer cells infected with EBV develop tumor vascular networks that correlate with tumor growth, which is different from endothelial-derived angiogenic vessels and is VEGF-independent. Mechanistically, activation of the PI3K/AKT/mTOR/HIF-1α signaling cascade, which is partly mediated by LMP2A, is responsible for EBV-induced VM formation. Both xenografts and clinical samples of NPC and EBVaGC exhibit VM histologically, which are correlated with AKT and HIF-1α activation. Furthermore, although anti-VEGF monotherapy shows limited effects, potent synergistic antitumor activities are achieved by combination therapy with VEGF and HIF-1α-targeted agents. Our findings suggest that EBV creates plasticity in epithelial cells to express endothelial phenotype and provides a novel EBV-targeted antitumor strategy.


Conflict of interest statement

The authors declare no competing interests.

Figures

Fig. 1
Fig. 1
EBV infection promotes VM formation in vitro and in vivo. a (Left) Morphologies of EBV-infected NPC cells and their parental cells grown in conventional 2D culture plates. Cells are mixed with the sheet-like and thread-like cell types, and the latter were outlined with yellow lines. Scale bars = 100 μm. (Right) Quantification of the sheet-like and thread-like cell types in EBV-infected NPC cells and their parental cells. More than 100 cells were counted in randomly chosen fields. Mean ± SD, n = 5, ***p < 0.001 (two-tailed unpaired t-test). b Images (left) and quantification (right) of tube formation in EBV-infected NPC cells and their parental cells. Images were taken 12 h after seeding on Matrigel. Scale bars = 100 μm. Tubes were counted under a microscope with 200× magnification in randomly chosen fields. Mean ± SD, n = 5, * p < 0.05 (two-tailed Mann–Whitney test). c EBV-infected NPC cells displayed tubular networks and channels in 3D Matrigel, as observed by scanning electron microscopy. Scale bars = 100  μm (left panel), scale bars = 10 μm (right locally enlarged images). d CNE2 and CNE2-EBV cells were subcutaneously injected into nude mice, and images were taken 20 days post-implantation. e Growth curves of xenograft tumors formed by CNE2 and CNE2-EBV cells. Mean ± SD, n= 4, two-tailed Mann–Whitney test. f The presence of VM in CNE2-EBV xenografts but not in control CNE2 xenografts. Pink arrows indicate VM channels (PAS+/mCD31), which are formed by tumor cells (as stained by EBER) and containing red blood cells (stained by H&E; red arrows); brown arrows indicate typical blood vessels with brown mCD31+ staining. White scale bars = 100 μm, black scale bars = 10 μm. (Left) Quantification of PAS+/mCD31 channels determined by microscopy with 400× magnification in randomly chosen fields. Mean ± SD, n = 5, ***p = 0.0002 (two-tailed unpaired t-test)
Fig. 2
Fig. 2
Clearance of EBV genomes reduces VM formation. a Schematic representation of the EBNA1 gene and its gRNA target sites. Primers for T7E1 assay are shown (see Supplementary Fig. 2a). b Western blot analysis of EBNA1 in NPC-EBV cells transduced with control lentivirus or lentivirus expressing two EBNA1 gRNAs. c CNE2-EBV cells carrying recombinant EBV-GFP virions were subjected to CRISPR/Cas9-mediated EBV targeting as in b, and the GFP expression was determined by flow cytometry. Mean ± SD, n = 2. d Relative EBV copy numbers in NPC-EBV cells infected with control lentivirus or lentivirus carrying EBNA1 gRNAs, as determined by real-time PCR using primers directed to BALF5 and EBNA1. Data are represented as the mean ± SD, n = 3, two-tailed paired t-test. e (left) Images of TW03-EBV cells transduced with control lentivirus or lentivirus expressing EBNA1 gRNAs grown in conventional 2D culture plates. Scale bars = 100 μm. (right) Proportions of sheet-like and thread-like cell types were determined by microscopy with 200× magnification in randomly chosen fields. Mean ± SD, n = 5, two-tailed unpaired t-test with Welch’s correction. f (top) Images of the cells as in e, grown on 3D Matrigel. Scale bars = 50 μm. (bottom) Quantification of the tube numbers. Tubes were counted under a microscope with 200× magnification. Mean ± SD, n = 5, two-tailed Mann–Whitney test. g Tube formation of CNE2-EBV cells transfected with empty vector or HA-tagged dominant-negative EBNA1 mutant (dnEBNA1). Mean ± SD, n = 5, two-tailed paired t-test. h (top) Images of xenografts formed by CNE2-EBV cells transduced with lentiviral vector or lentivirus expressing EBNA1 gRNA #1 or #2 at day 20 post-implantation. (bottom) Growth curves of xenografts formed by parental CNE2-EBV cells and CNE2-EBV cells subjected to EBNA1 deletion by gRNA #1 and #2. Mean ± SD, n= 4, two-tailed Mann–Whitney test. *p < 0.05, **p < 0.01 and ***p < 0.001
Fig. 3
Fig. 3
Enrichment of VM-related genes by EBV infection. a Venn diagram illustrating the overlap of differentially expressed genes (DEGs) in paired EBV-negative and EBV-positive NPC cells (CNE2 vs. CNE2-EBV and TW03 vs. TW03-EBV) by RNA-seq. b Bar plot ranking of the top enrichment score (p-value) values for the significant enrichment pathways according to KEGG analysis of DEGs between EBV− and EBV+ NPC cells. Only pathways with p < 0.05 are shown. c GO tree obtained from BiNGO showing the hierarchy of biological processes related to endothelial cell development, endothelial cell migration and angiogenesis between the EBV-positive and EBV-negative NPC cell pairs (padj < 0.05; see the color bar). The white nodes (padj > 0.05) were added to show the relationships among their downstream nodes. d Heatmap depicting FPKM values for vascular development and tube morphogenesis-related genes in EBV− and EBV+ NPC cell pairs and EBV+ cells with EBNA1 deletion by gRNAs. padj < 0.05. Of note, 36 out of 39 of these genes contain HRE motif in their promoter region (Supplementary Fig. 3) with the exception of three genes colored in green. e The average FPKM values of the DEGs in d. ns: not significant (one-tailed Wilcoxon matched pairs test). f (left) Serial sections of EBV-negative and EBV-positive NPC tissues were stained with H&E, EBER and antibodies targeting F3, CYR61, EphA2 and TNFRSF12A. Scale bars = 500 μm. (right) IHC scores of the indicated genes in 10 EBV-positive and 7 EBV-negative NPC biopsies. Means ± SD, **p < 0.01, two-tailed Mann–Whitney test
Fig. 4
Fig. 4
EBV-induced VM formation is HIF-1α-dependent. a Immunofluorescence of HIF-1α in TW03 and TW03-EBV cells with or without targeting of EBV by CRISPR/Cas9. Scale bars = 50 μm. b The mean integrated optical density (MOD) values of HIF-1α levels in the cytoplasm and nucleus of NPC cells with or without EBV. More than 100 cells were counted in randomly chosen fields. Mean ± SD, n = 3, two-tailed unpaired t-test. c Subcellular fractionation of EBV- cells, EBV+ cells and EBV+ cells subjected to EBV targeting by transfecting EBNA1 gRNAs. Each extract was analyzed by immunoblotting of HIF-1α, β-Tubulin, and PARP1. β-Tubulin represents cytoplasmic proteins, and PARP1 is used as a nuclear protein marker. d EBV− and EBV+ NPC cells were treated with 10 or 50 μM PX-478 for 24 h, followed by WB analysis of HIF-1α. e Immunofluorescence staining of HIF-1α in TW03-EBV cells that were treated with 10 μM PX-478 for 24 h or left untreated. Scale bars = 50 μm. f (left) Light microscopy of the tube formation of TW03-EBV cells that were pre-treated with 10 μM PX-478 for 24 h prior to plating on Matrigel for additional 12 h. Scale bars = 100 μm. (right) Quantification of the tube numbers formed by NPC-EBV cells after PX-478 treatment at different concentrations, as indicated. Mean ± SD, n = 5, two-tailed unpaired t-test. g EBV- and EBV+ TW03 cells were treated with 1 or 10 μM 2-MeOE2 for 12 h, followed by WB analysis of HIF-1α. h (left) In vitro tube formation of TW03-EBV cells that were treated with DMSO or 10 μM 2-MeOE2 for 12 h on Matrigel. Scale bars = 100 μm. (right) Quantification of tube numbers formed by NPC-EBV cells after 2-MeOE2 treatment. Mean ± SD, n = 5, two-tailed Mann–Whitney test. i Immunoblotting of NPC cells transfected with control or HIF-1α-specific siRNAs. j (left) Images and (right) quantification of tube formation of control and HIF-1α-depleted cells. Scale bars = 100 μm. Mean ± SD, n = 5, two-tailed Mann–Whitney test. ns: not significant, *p < 0.05, **p < 0.01 and *** p < 0.001
Fig. 5
Fig. 5
EBV promotes VM formation via the PI3K/AKT/mTOR/HIF-1α axis. a Immunofluorescence of phospho-AKT (S473) in TW03 cells and TW03-EBV cells with or without targeting EBV by CRISPR/Cas9. Scale bars = 50 μm. b Immunoblots comparing AKT phosphorylation in EBV- and EBV+ NPC cell lines. c CNE2-EBV cells were transfected with empty vector or a dominant-negative mutant of EBNA1 (dnEBNA1), followed by WB analysis using antibodies as indicated. d Immunoblots of AKT phosphorylation and HIF-1α expression following LY294002 (50 μM) or Wortmannin (1 μM) treatment for 6 h. e Immunoblots of HIF-1α distribution in cytoplasmic and nuclear fractions of EBV- and EBV+ NPC cells following LY294002 (50 μM), Wortmannin (1 μM) or DMSO treatment for 6 h. f Immunofluorescence of phospho-AKT (S473) and HIF-1α in TW03-EBV cells after 6 h of treatment with DMSO, LY294002 (50 μM) or Wortmannin (1 μM). Scale bars = 50 μm. g Microscopy of tube formation on Matrigel in TW03-EBV cells after 12 h of treatment with LY294002 (50 μM) or Wortmannin (1 μM). Scale bars = 100 μm. h Quantification of tube numbers formed by NPC-EBV cells following LY294002 or Wortmannin treatment. Mean ± SD, n = 5, two-tailed unpaired t-test. i Effects of PI3K/mTOR/S6K kinase inhibitors on EBV-induced HIF-1α expression. CNE2-EBV cells were treated with DMSO, 1 μM Wortmannin (Wort), 0.5 μM rapamycin (Rapa) or 10 μM PF-4708671 (PF) for 6 h under normoxic conditions prior to immunoblotting with antibodies, as indicated. j Effect of rapamycin (0.5 μM) on VM channel formation of CNE2-EBV cells. Mean ± SD, n = 5, two-tailed unpaired t-test. ns: not significant, *p < 0.05, ***p < 0.001
Fig. 6
Fig. 6
LMP2A is involved in VM formation and AKT/HIF-1α activation. a RT-PCR analysis of EBV latent genes in CNE2 and HNE1 cells carrying recombinant EBV (Akata strain) and the native EBV-infected cell line C666-1. GAPDH was used as the internal control. b CNE2 and HNE1 cells were transfected with empty vector or construct encoding LMP2A. Activation of AKT/mTOR/HIF-1α signaling pathway was determined by immunoblotting. c Representative images (top) and quantification (bottom) of tube formation on Matrigel of control and LMP2A-overexpressing NPC cells. Scale bars = 100 μm. Tube numbers were counted under a microscope with 200× magnification in randomly chosen fields. Mean ± SD, n = 5, two-tailed Mann–Whitney test. d CNE2-EBV and TW03-EBV cells were transfected with control or LMP2A-specific siRNAs. The knockdown efficiency was determined by RT-PCR, and HIF-1α level and AKT/mTOR/S6K signaling activity were determined by immunoblotting. e Representative images (left) and quantification (right) of tube formation of NPC-EBV cells transfected with control or LMP2A-specific siRNA. Scale bars = 100 μm. Mean ± SD, n = 5, two-tailed Mann–Whitney test. **p < 0.01 and ***p < 0.001
Fig. 7
Fig. 7
Correlation of VM with EBV infection in NPC and EBVaGC. a (top) NPC and (bottom) EBV-negative and EBV-positive gastric carcinoma serial sections were stained with H&E, EBER, PAS, and antibodies targeting human CD31, p-AKT, and HIF-1α. White scale bars = 100 μm, black scale bars = 10 μm. b Pearson correlation of PAS+/CD31 tumor cells of VM with EBER, phosphorylated AKT or nuclear HIF-1α staining in NPC tissue. p < 0.001, r = regression coefficient. c Pearson correlation of PAS+/CD31 tumor cells with the staining as in b in EBV− and EBV+ human gastric carcinoma samples, p < 0.001
Fig. 8
Fig. 8
Synergistic effects of PX-478 and Axitinib in NPC-EBV. a Image of CNE2-EBV xenograft tumors from mice treated with vehicle, Axitinib alone (30 mg kg−1 p.o., twice a day), PX-478 (5 mg kg−1 p.o., every 2 days) alone or Axitinib plus PX-478. b Growth curves of CNE2-EBV xenograft tumors after treatment with vehicle, Axitinib or/and PX-478. Mean ± SD, n = 10, ***p < 0.001 versus the other three treatment groups (two-tailed Mann–Whitney test). c H&E, PAS and mouse CD31 staining of CNE2-EBV xenograft sections. Red lines: necrotic area. White scale bars = 100 μm, black scale bars = 50 μm. d Numbers of endothelial cell (EC) channel-like structures in CNE2-EBV xenograft tumors from mice treated with vehicle, Axitinib or/and PX-478. Channels were determined under a microscope with 400× magnification in randomly chosen fields. Mean ± SD, n = 5, two-tailed Mann–Whitney test. e Number of VM channel-like structures in CNE2-EBV xenografts counted as in d. f Working model illustrating the mechanism by which EBV promotes VM and the aggressiveness of carcinomas such as NPC and EBVaGC. ns: not significant, *p < 0.05, ***p < 0.001

References

    1. Young, L. S., Yap, L. F. & Murray, P. G. Epstein-Barr virus: more than 50 years old and still providing surprises. Nat. Rev. Cancer16, 789–802 (2016). - PubMed
    1. Chang, E. T. & Adami, H. O. The enigmatic epidemiology of nasopharyngeal carcinoma. Cancer Epidemiol. Biomark. Prev.15, 1765–1777 (2006). - PubMed
    1. Tsao, S. W., Tsang, C. M., To, K. F. & Lo, K. W. The role of Epstein-Barr virus in epithelial malignancies. J. Pathol.235, 323–333 (2015). - PMC - PubMed
    1. Sugiura, M. et al. Transcriptional analysis of Epstein-Barr virus gene expression in EBV-positive gastric carcinoma: unique viral latency in the tumour cells. Br. J. Cancer74, 625–631 (1996). - PMC - PubMed
    1. Luo, B. et al. Expression of Epstein-Barr virus genes in EBV-associated gastric carcinomas. World J. Gastroenterol.11, 629–633 (2005). - PMC - PubMed

Publication types

MeSH terms

Substances