. 2018 Nov 27;9(1):5005.
doi: 10.1038/s41467-018-07538-7.

Hysteresis control of epithelial-mesenchymal transition dynamics conveys a distinct program with enhanced metastatic ability

Affiliations

Hysteresis control of epithelial-mesenchymal transition dynamics conveys a distinct program with enhanced metastatic ability

Toni Celià-Terrassa et al. Nat Commun. .

Erratum in

Abstract

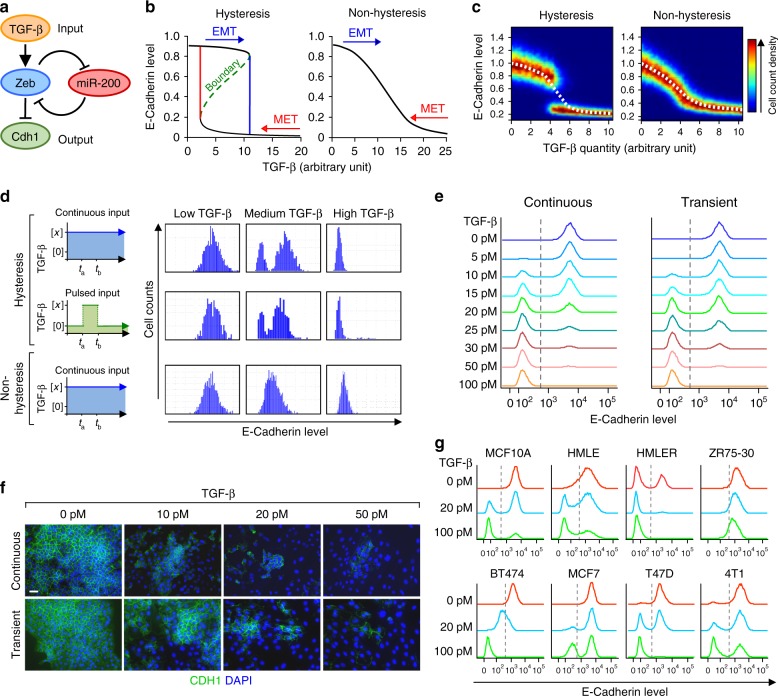
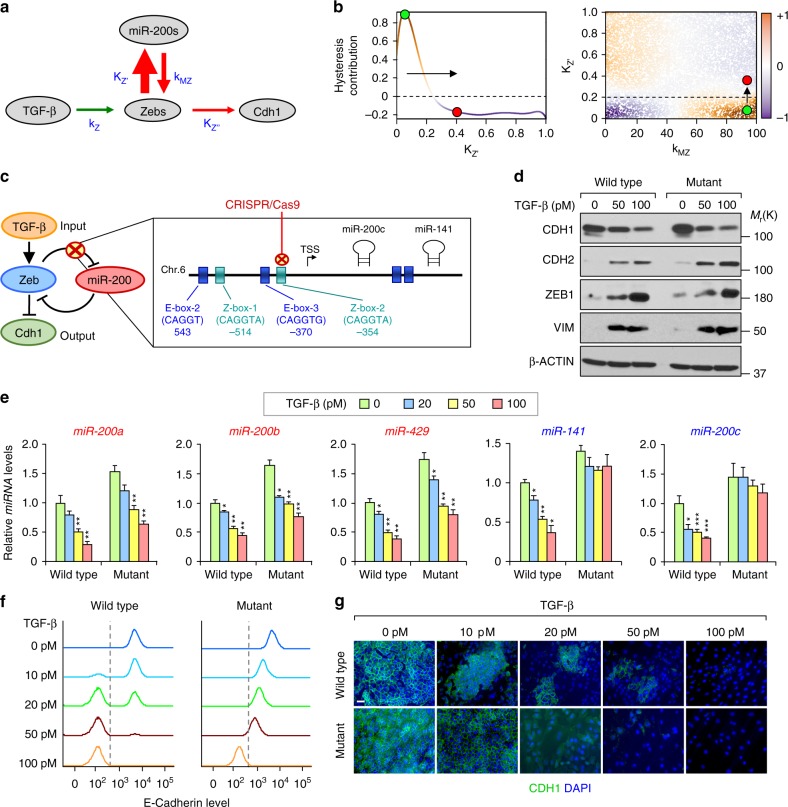
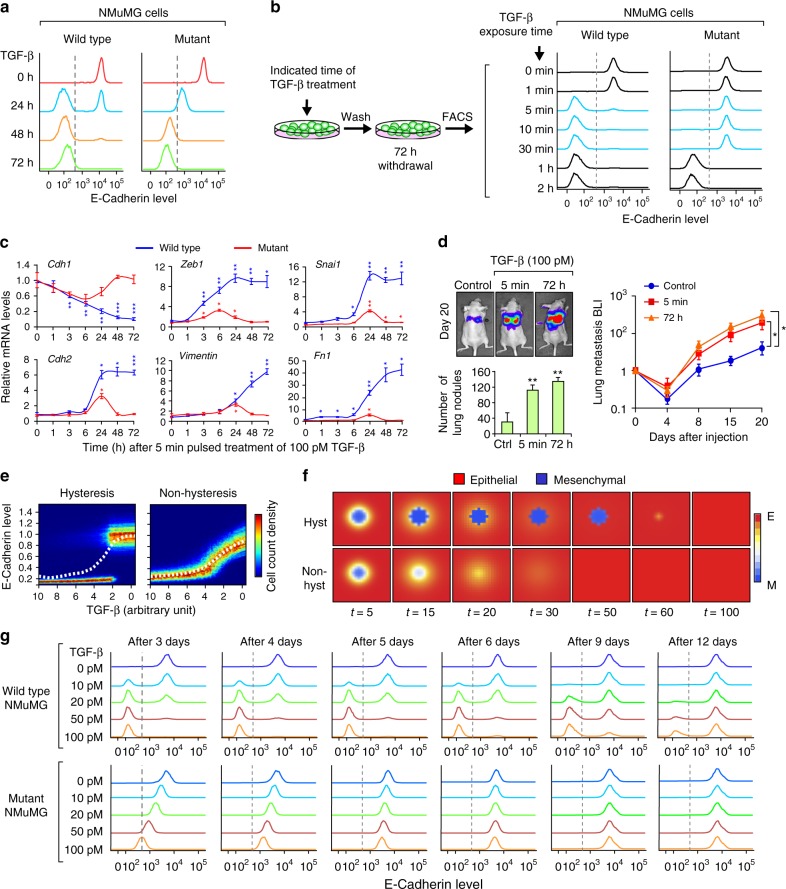
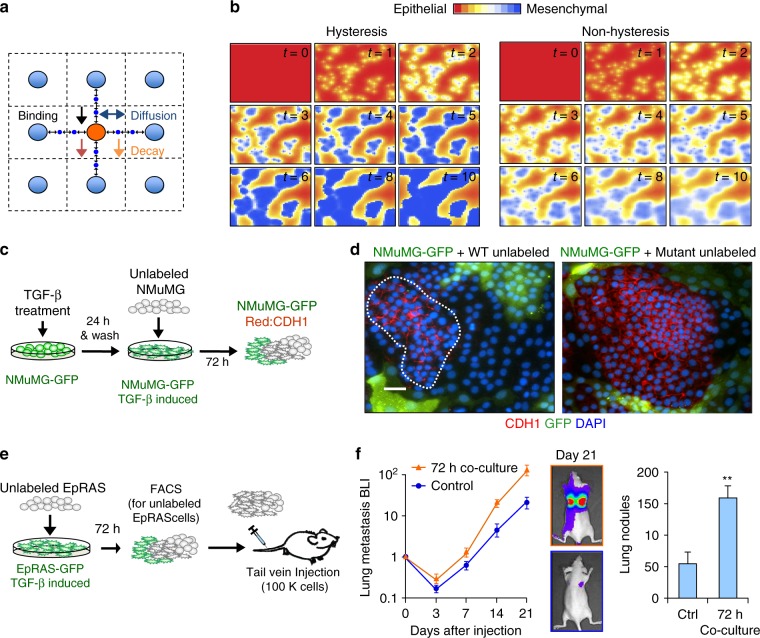
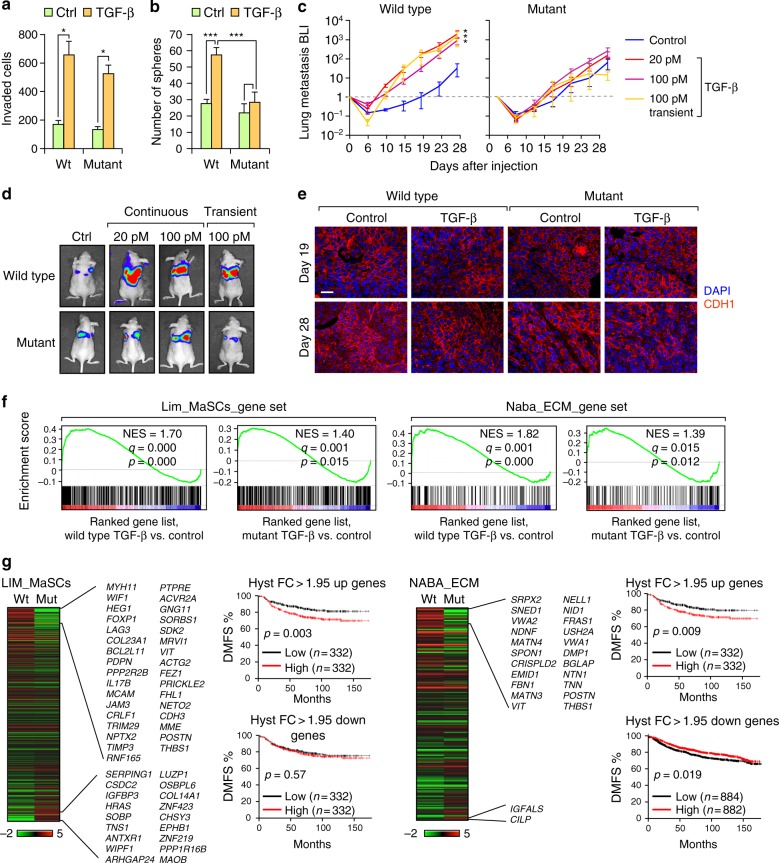
Epithelial-mesenchymal transition (EMT) have been extensively characterized in development and cancer, and its dynamics have been modeled as a non-linear process. However, less is known about how such dynamics may affect its biological impact. Here, we use mathematical modeling and experimental analysis of the TGF-β-induced EMT to reveal a non-linear hysteretic response of E-cadherin repression tightly controlled by the strength of the miR-200s/ZEBs negative feedback loop. Hysteretic EMT conveys memory state, ensures rapid and robust cellular response and enables EMT to persist long after withdrawal of stimuli. Importantly, while both hysteretic and non-hysteretic EMT confer similar morphological changes and invasive potential of cancer cells, only hysteretic EMT enhances lung metastatic colonization efficiency. Cells that undergo hysteretic EMT differentially express subsets of stem cell and extracellular matrix related genes with significant clinical prognosis value. These findings illustrate distinct biological impact of EMT depending on the dynamics of the transition.


Conflict of interest statement

The authors declare no competing interests.

Figures

Fig. 1
Fig. 1
Mathematical modeling and experimental validation of mammary epithelial cells undergoing EMT. a Diagram of the simplified model of TGF-β induced EMT and the central role of the miR-200-Zeb double negative feedback loop. b Hysteresis within EMT and MET as indicated by CDH1 expression level (left panel) and altered model (non-hysteresis, right panel), based on ODE single cell deterministic model. Within a certain range of TGF-β (2.5-12 arbitrary unit), the steady-state CDH1 level is bistable and is either high or low, depending on the previous state of the cells (i.e. whether it is undergoing EMT or MET). c Simulated steady-state calculations of CDH1 level in a homogeneous collection of cells in increasing dose of TGF-β. Heatmap graphs depict CDH1 expression at single cell level (color indicates cell count for a given CDH1 expression level) and the dashed line represents CDH1 expression as the average of the population. Note the bistable shift in the hysteresis model (left) versus the gradual shift in the non-hysteresis model (right). d Computational simulation of CDH1 expression after different regimes of TGF-β treatment in a cell population. e Flow cytometry analysis and f Immunofluorescence of the endogenous CDH1 expression in parental NMuMG cells after treatment with indicated concentrations of TGF-β for 72 h (histograms, left), or for just 1 h of transient treatment, followed by measurement of CDH1 expression 72 h later (histograms, right). g Flow cytometry analysis of CDH1 expression in multiple normal and cancerous mammary epithelial cell lines after 100 pM TGF-β treatment for 9 days. Scale bar: 20 μm in f
Fig. 2
Fig. 2
ZEB1 repression of miR-200s tightly controls hysteresis during EMT. a Schematic illustration of the strength of interaction constants and reaction coefficients: kZ, KZ′, KZ′′ and kMZ. The thickness of the arrows represents the magnitude of the interaction strength (sensitivity index). b High dimensional model representation (HDMR) component functions of hysteresis contribution in KZ′ (left panel; first-order) and KZ′ vs kMZ (right panel; second-order). The green dot denotes a region with hysteresis (orange background) and red dot a region without hysteresis (blue background). The arrow represents a minimal modification of the KZ′ that eliminates hysteresis. c Representation of the Z-box-2 deleted using CRISPR-Cas9 in NMuMG and EpRAS cells generating the corresponding mutant cells. d Western-blot analysis of EMT markers in wild type and mutant NMuMG clonal cells at the indicated concentration of TGF-β for 72 h. e qRT-PCR analysis of the expression levels of, cluster-1 (red) and cluster-2 (blue) miR-200s family members in wild type and mutant NMuMG cells (n = 3 biological replicates) treated with the indicated concentrations of TGF-β for 72 h. f Flow cytometry analysis and g immunofluorescence analysis of CDH1 expression in NMuMG clones after treatment with indicated concentrations of TGF-β for 72 h. Scale bar: 20 μm
Fig. 3
Fig. 3
Dynamic analysis of the hysteretic and non-hysteretic EMT in NMuMG and EpRAS cells. a Analysis of the dynamic of EMT induction (100 pM TGF-β) in wild type and mutant NMuMG cells by flow cytometry analysis of CDH1. The time represents the duration of treatment at the moment of measurement. b Minimum exposure time of 100 pM TGF-β required to induce EMT in wild type and mutant NMuMG cells by flow cytometry analysis of CDH1. The time represents the duration of the transient treatment, with the measurement done 72 h post-induction for all conditions. c qRT-PCR analysis of EMT marker genes at the indicated times after a 5 min pulse treatment of 100 pM TGF-β. n = 3 technical replicates. d Quantification of lung metastatic nodules and bioluminescence imaging (BLI) quantification of the metastatic growth of wild type EpRAS cells in the lungs after tail vein (T.V.) injection of 20,000 cells in Ncr-nu/nu mice (n = 6 mice). Cells were untreated (control) or treated with 100 pM TGF-β for the indicated time. e Steady-state simulation of CDH1 expression in mesenchymal-like cells after withdrawal of TGF-β. Heatmap graphs depict CDH1 expression at single cell level (color indicates cell count for a given CDH1 expression level) and dashed line represents CDH1 expression as the average of the population. f Simulation of EMT reversion in mesenchymal-like cell populations by modeling CDH1 expression with or without hysteresis. Red represents the epithelial cells (CDH1-high) and blue the mesenchymal cells (CDH1-low). g Flow cytometry analysis of the CDH1 expression showing the reversion kinetics in wild type versus mutant NMuMG cells. Cells were treated with indicated concentration of TGF-β for 72 h, after which TGF-β was withdrawn and cells allowed to revert for indicated duration. Data represent mean±SEM in c and d. *P < 0.05, **P < 0.01, ***P < 0.005 by two-tailed Student’s t-test in c and d
Fig. 4
Fig. 4
Hysteresis fosters the EMT neighborhood spreading effect. a Euclidean stencil grid representing the parameters considered for the neighborhood effect computation. b Computational spatial simulation of the EMT spreading paracrine effect with and without hysteresis in a population of cells at different time points. c Schematic representation of the co-culture treatment process. NMuMG-GFP cells were induced with 100 pM TGF-β and for 24 h, after which unlabeled NMuMG cells were added into the culture. Immunofluorescence analysis was performed 72 h later. d Immunofluorescent images showing loss of CDH1 expression (red) in GFP-positive cells that were pre-treated with TGF-β to undergo EMT. Among GFP-negative wild type cells that were not pre-exposed to TGF-β some of the them lost CDH1 expression under the influence of neighboring GFP-positive, mesenchymal-like cells, while the rest (highlighted by dashed line) remained epithelial (left panel). Most of GFP-negative mutant were not able to undergo EMT through the neighborhood effect (right panel). Scale bar: 20 μm. e Schematic representation of co-culture procedure of EpRAS cells (left). EpRAS-GFP cells were induced with 100 pM TGF-β and for 24 h, after which unlabeled EpRAS cells were added into the culture. After 72 h of co-culture, GFP-positive and -negative cells were separated by flow cytometry. 100,000 unlabeled EpRAS cells with or without the co-culture treatment were injected by tail vein injection into Ncr-nu/nu mice (n = 6 mice). f Left: bioluminescence imaging (BLI) quantification and representative images of the metastatic growth of EpRAS cells. Right: quantification of lung metastasis nodules (n = 6 mice). Data represent mean±SEM. ** P < 0.01 by two-tailed Student’s t-test
Fig. 5
Fig. 5
Hysteresis during EMT increases the metastatic colonization ability of EpRAS cells. a Quantification of invading cells in Matrigel transwell invasion assays after 24 h of seeding 100,000 EpRAS cells with or without 100 pM TGF-β treatment. n = 3 biological replicates; data represents mean±SEM. b Quantification of mammosphere formation of 5,000 EpRAS cells with or without 100 pM TGF-β treatment. n = 4 biological replicates; data represents mean±SEM). c, d Bioluminescence imaging (BLI) quantification (c) and representative images (d) of the metastatic growth of the EpRAS wild type and mutant cells in the lungs after tail vein injection of 20,000 cells in Ncr-nu/nu mice (n = 6 mice). EpRAS cells were treated with the indicated concentration of TGF-β for 72 h (continuous) or 5 min followed by 72 h withdrawal (transient) prior to injection. Data represents mean±SEM. e Confocal microscopy imaging of CDH1 staining of lung metastatic tumor tissue. Wild type and mutant EpRAS cells were injected at the indicated conditions. Lung metastasis sample collection was done at the indicate time points after tail vein injection. Scale bar: 25 μm. f GSEA demonstrating the enrichment of the gene sets from the MSigDB related to mammary stem cells (Lim_MaSC_M2573)) and ECM (Naba_ECM-GLYCOPROTEINS_M3008) in the ranked gene list of TGF-β treated vs. control conditions in wild type or mutant EpRAS cells. NES, normalized enrichment score. g Heatmap of differentially expressed genes in Lim_MaSC (left) and Naba_ECM-GLYCOPROTEINS datasets (right); color legend represents Log2 fold change (FC). Genes highlighted are genes with a >1.95 fold change (FC) during EMT in wild type but are not significantly changed in during EMT in mutant EpRAS cells. Kaplan–Meier distant metastasis free survival (DMSF) curves of breast cancer patients in the composite KM plotter breast cancer clinical database with higher or lower than median expression levels of the indicated gene sets were shown in the right side of the heatmap. *P < 0.05, **P < 0.01, ***P < 0.005 by two-tailed Student’s t-test in ac. P-value by log-rank tests in f

References

    1. Nieto, M. A., Huang, R. Y., Jackson, R. A. & Thiery, J. P. Emt: 2016. Cell166, 21–45 (2016). - PubMed
    1. Yang J, Weinberg RA. Epithelial-mesenchymal transition: at the crossroads of development and tumor metastasis. Dev. Cell. 2008;14:818–829. doi: 10.1016/j.devcel.2008.05.009. - DOI - PubMed
    1. Nieto MA. Epithelial plasticity: a common theme in embryonic and cancer cells. Science. 2013;342:1234850. doi: 10.1126/science.1234850. - DOI - PubMed
    1. Tsai JH, Yang J. Epithelial-mesenchymal plasticity in carcinoma metastasis. Genes Dev. 2013;27:2192–2206. doi: 10.1101/gad.225334.113. - DOI - PMC - PubMed
    1. Ocana OH, et al. Metastatic colonization requires the repression of the epithelial-mesenchymal transition inducer Prrx1. Cancer Cell. 2012;22:709–724. doi: 10.1016/j.ccr.2012.10.012. - DOI - PubMed

Publication types

MeSH terms