. 2018 Nov 27;9(1):5024.
doi: 10.1038/s41467-018-07540-z.

Single cell RNA-sequencing identifies a metabolic aspect of apoptosis in Rbf mutant

Affiliations

Single cell RNA-sequencing identifies a metabolic aspect of apoptosis in Rbf mutant

Majd M Ariss et al. Nat Commun. .

Abstract

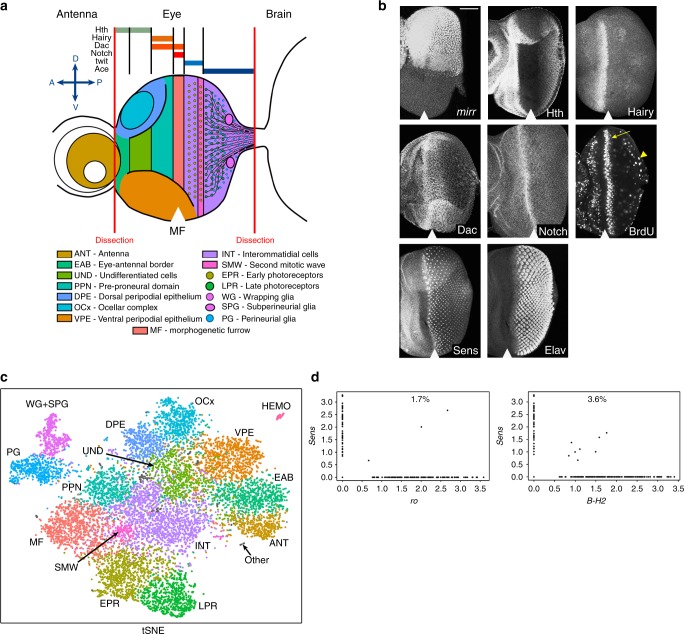
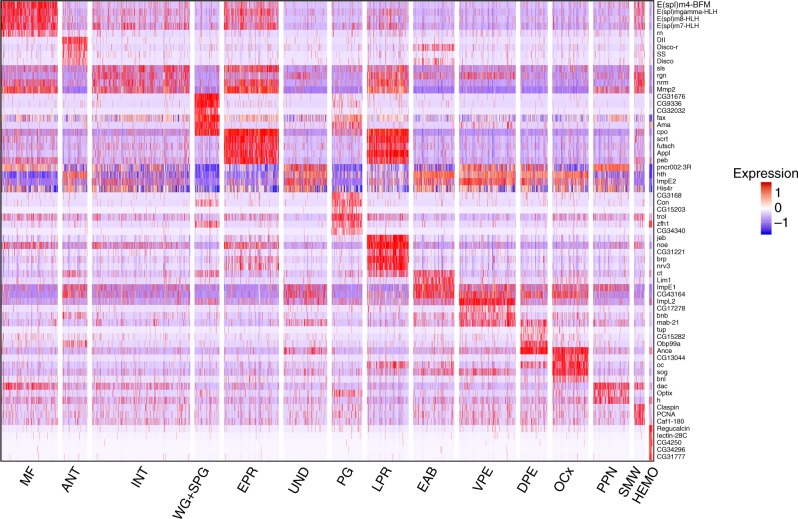
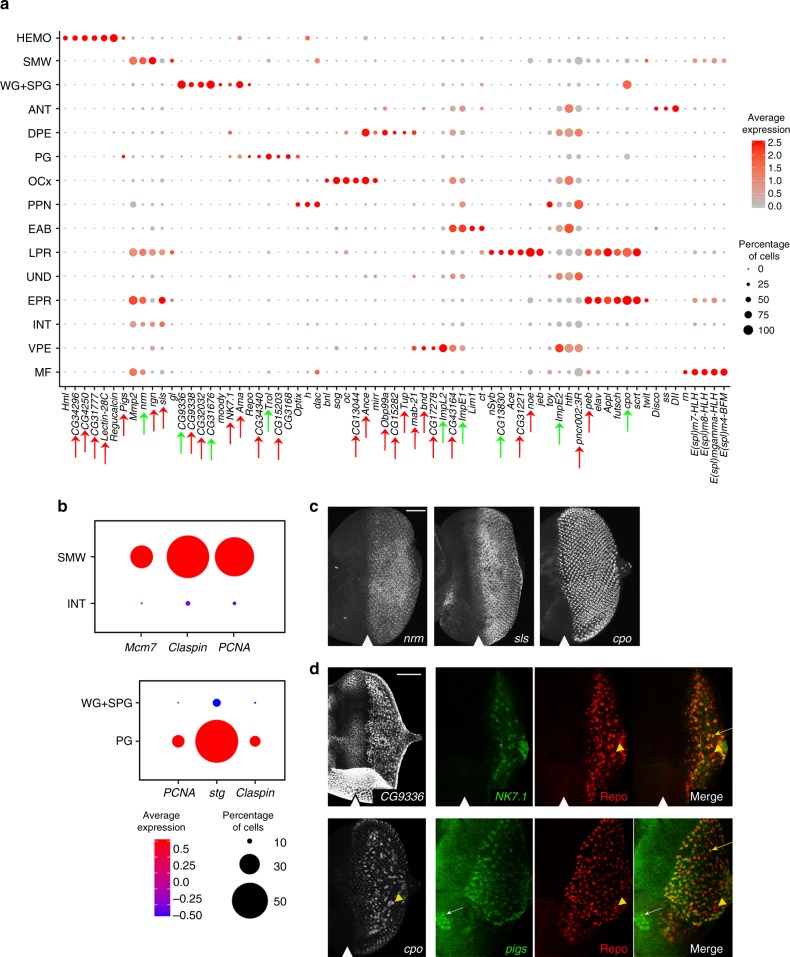
The function of Retinoblastoma tumor suppressor (pRB) is greatly influenced by the cellular context, therefore the consequences of pRB inactivation are cell-type-specific. Here we employ single cell RNA-sequencing (scRNA-seq) to profile the impact of an Rbf mutation during Drosophila eye development. First, we build a catalogue of 11,500 wild type eye disc cells containing major known cell types. We find a transcriptional switch occurring in differentiating photoreceptors at the time of axonogenesis. Next, we map a cell landscape of Rbf mutant and identify a mutant-specific cell population that shows intracellular acidification due to increase in glycolytic activity. Genetic experiments demonstrate that such metabolic changes, restricted to this unique Rbf mutant population, sensitize cells to apoptosis and define the pattern of cell death in Rbf mutant eye disc. Thus, these results illustrate how scRNA-seq can be applied to dissect mutant phenotypes.


Conflict of interest statement

The authors declare no competing interests.

Figures

Fig. 1
Fig. 1
A cell atlas of the wild-type third-instar larval eye disc. a A cartoon representation of the eye-antennal disc and known cell types that are color coded. The red vertical lines indicate where the dissections were made. The expression domains of genes above that were used to assign cell clusters. D dorsal, V ventral, P posterior to the MF, A anterior to the MF. b The pattern of the expression of cell-type markers in the eye as revealed by immunofluorescence. BrdU labeling shows the location of SMW (yellow arrow) and PG (yellow arrowhead) cells undergoing cell division. The scale bar is 50 µm. c The tSNE representation of 11,416 wild-type eye disc cells. Each cluster represents a cell type/domain, characterized by a unique gene expression signature. Clusters are color coded as in (a). Other cells are labeled as gray. d Gene/gene plots generated on all photoreceptors for sens (R8) and ro (R2/5), sens and B-H2 (R1/6). The percentage represents doublets, based on the detection of two R cell-specific markers in the same single-cell library. The position of the MF is shown by white arrowhead
Fig. 2
Fig. 2
A heat map showing markers across cell populations. Heat map displaying the expression of 65 top markers across 15 wild-type populations
Fig. 3
Fig. 3
Single-cell RNA-seq identifies cell-specific markers. a Dot plot of top markers for all populations. Red arrows point at previously unreported eye cell-type markers. Green arrows indicate genes previously studied in the eye that were not assigned to a specific cell type. The genes without arrows are known markers used to assign cell populations. b LacZ enhancer traps for posterior candidate markers neuromusculin (nrm), sallimus (sls, also known as kettin) and photoreceptor marker couch potato (cpo). c Dot plots, top panel shows interommatidial populations INT and SMW, showing expression of cell-cycle genes exclusively in SMW subpopulation. Bottom panel shows glial cell populations PG and WG+SPG showing expression of cell-cycle genes exclusively in PG. The scale bar is 50 µm. d Wrapping glia markers CG9336 and NK7.1 of and their expression as revealed by FISH (CG9336) and a GFP reporter for NK7.1 (green). Repo (red) is a glial marker. Merge image marks cells co-expressing NK7.1 and Repo, also shown with yellow arrow. Markers of PG, cpo and pigs are revealed by LacZ enhancer trap and GFP reporter, respectively. SPG are indicated by a yellow arrowhead, overlap of Repo and pigs shown with yellow arrow. The scale bar is 50 µm. The position of the MF is shown by white arrowhead
Fig. 4
Fig. 4
Photoreceptors undergo a transcriptional switch at onset of axonogenesis. a Gene/gene plots showing expression of R type-specific markers sens, ro and B-H2 in relation to elav in EPR (left panel) and LPR (right panel). b Venn diagram of the gene lists for EPR and LPR clusters. c Feature plots on tSNE for twit and Ace show predominant expression of each gene in EPR and LPR cells, respectively. d EPR and LPR marker gene localization. Left panel: FISH for twit mRNA, an EPR-specific gene, shows expression in the MF and posterior until column 4. Right panel: GFP enhancer trap for Ace (green), an LPR top marker, was costained with Sens (red). Ace-GFP was detected after column 4 and in axonal projections (yellow arrow). The scale bar is 50 µm. e Gene enrichment analysis for biological processes in UND, EPR and LPR. f Monocle 2 trajectory using shown clusters. Stages of differentiation are visualized, with the split of INT and photoreceptor populations. LPR arise from the EPR population, clustering consecutively in pseudotime. The position of the MF is shown by white arrowhead
Fig. 5
Fig. 5
Wild-type and Rbf120a scRNA-seq identifies a mutant-specific metabolic cluster. a Seurat analysis using a combined wild-type and Rbf mutant single-cell transcriptomes. Cluster 13, outlined in red, is almost exclusively comprised of Rbf120a mutant cells. Clusters are color coded as in Fig. 1a. b Feature plots on tSNE showing the expression of PCNA, Mcm7 and Ldh in wild-type and Rbf mutant cells. Location of cluster 13 is outlined in red. c Dot plot showing expression of cluster 13 markers Ldh, Ald, HIF1a and hid throughout all clusters. d Expression of Ldh, Ald and HIF1A in the eye disc as revealed by FISH. The scale bar is 50 µm. e Pattern of intracellular acidification as revealed by pHrodo. The scale bar is 50 µm. The position of the MF is shown by white arrowhead
Fig. 6
Fig. 6
Upregulation of Ldh, Ald and HIF1a make Rbf mutant prone to apoptosis. a Cleaved Dcp-1 immunofluorescence displays the distinct wave of apoptosis in Rbf120a that is rescued by downregulation of each Ldh, Ald and HIF1a. The scale bar is 50 µm. b Quantification of cleaved Dcp-1-positive puncta in N (WT) = 20 eyes, N (Rbf120a) = 62 eyes, N (Rbf120a, LdhRNAi) = 54 eyes, N (Rbf120a, AldRNAi) = 58 eyes, and N (Rbf120a, HIF1ARNAi) = 59 eyes. Center box line represents the median. The lower box limit is the first quartile. The upper box limit is the third quartile. The whiskers point at the variabilities outside the first and third quartiles. Values outside the whiskers are outliers. The hollow circles are outliers. One-way analysis of variance (ANOVA) test compares knockdowns versus Rbf120a, ***adjusted p value < 5 × 10-4. c ChIP-qPCR performed on larval chromatin using Rbf, E2f1, E2f2 and Dp antibodies at the promoter regions of Ald and HIF1a relative to the negative site (NS). Data are representative of two experimental replicates and show the mean and error bars represent s.e.m., two-way ANOVA test was used, **p value < 0.001. d Molecular mechanism of the metabolic aspect of apoptosis in Rbf mutant cells. The position of the MF is shown by white arrowhead

References

    1. Dick FA, Goodrich DW, Sage J, Dyson NJ. Non-canonical functions of the RB protein in cancer. Nat. Rev. Cancer. 2018;18:442–451. doi: 10.1038/s41568-018-0008-5. - DOI - PMC - PubMed
    1. Xu XL, et al. Rb suppresses human cone-precursor-derived retinoblastoma tumours. Nature. 2014;514:385–388. doi: 10.1038/nature13813. - DOI - PMC - PubMed
    1. Van Den Heuvel S, Dyson NJ. Conserved functions of the pRB and E2F families. Nat. Rev. Mol. Cell Biol. 2008;9:713–724. doi: 10.1038/nrm2469. - DOI - PubMed
    1. Moon NS, Di Stefano L, Dyson N. A gradient of epidermal growth factor receptor signaling determines the sensitivity of rbf1 mutant cells to E2F-dependent apoptosis. Mol. Cell. Biol. 2006;26:7601–7615. doi: 10.1128/MCB.00836-06. - DOI - PMC - PubMed
    1. Bessa J, Gebelein B, Pichaud F, Casares F, Mann RS. Combinatorial control of Drosophila eye development by eyeless, homothorax and teashirt. Genes Dev. 2002;16:2415–2427. doi: 10.1101/gad.1009002. - DOI - PMC - PubMed

Publication types

LinkOut - more resources