

Enhanced Melanoma-Targeted Therapy by "Fru-Blocked" Phenyboronic Acid-Modified Multiphase Antimetastatic Micellar Nanoparticles
- PMID: 30479911
- PMCID: PMC6247072
- DOI: 10.1002/advs.201800229
Enhanced Melanoma-Targeted Therapy by "Fru-Blocked" Phenyboronic Acid-Modified Multiphase Antimetastatic Micellar Nanoparticles
Abstract
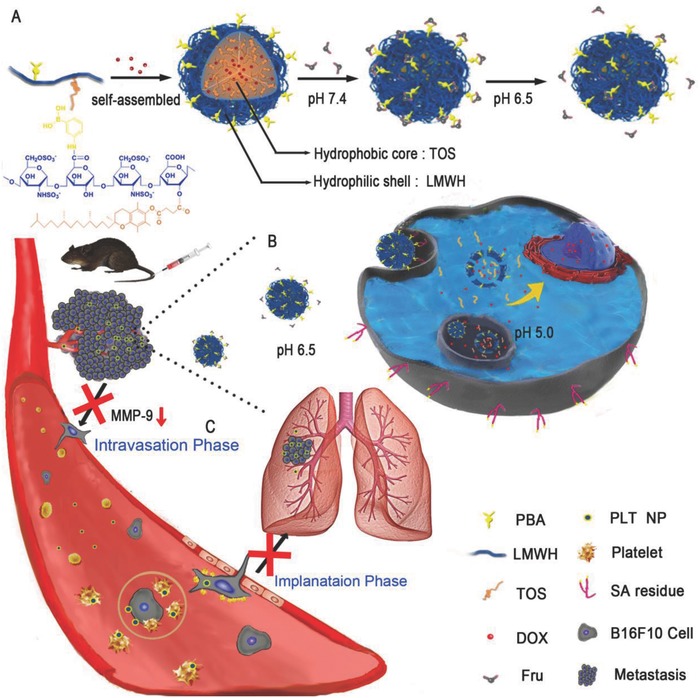
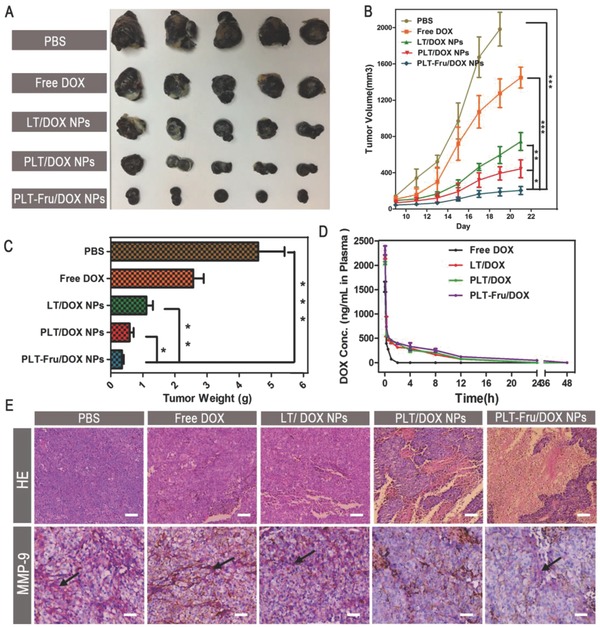
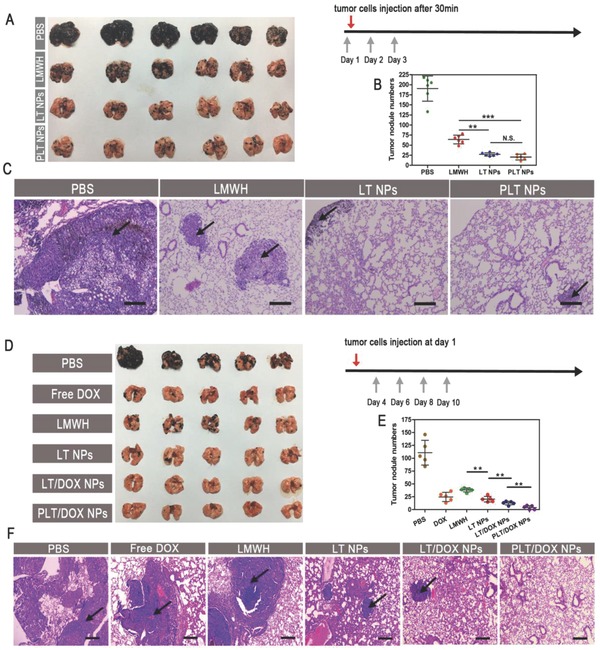
Metastasis remains the main driver of mortality in patients suffering from cancer because of the refractoriness resulting from the multi-phase metastatic cascade. Herein, a multifunctional self-delivering PBA-LMWH-TOS nanoparticle (PLT NP) is established that acts as both nanocarrier and anti-metastatic agent with effects on most hematogenous metastases of cancers. The hydrophilic segment (low molecular weight heparin, LMWH) inhibits the interactions between tumor cells and platelets. The hydrophobic segment (d-α-tocopheryl succinate, TOS) could inhibit the expression of matrix metalloproteinase-9 (MMP-9) in B16F10 cells which is first reported in this article. Surprisingly, even the blank NPs showed excellent anti-metastatic capacity in three mouse models by acting on different phases of the metastatic cascade. Moreover, the overexpression of sialic acid (SA) residues on tumor cells is implicated in the malignant and metastatic phenotypes of cancers. Thus, these 3-aminophenylboronic acid (PBA)-modified doxorubicin (DOX)-loaded NPs offer an efficient approach for the treatment of both solid melanomas and metastases. Furthermore, a simple pH-sensitive "Fructose (Fru)-blocking" coping strategy is established to reduce the NP distribution in normal tissues and distinctly increases the accumulation in melanoma tumors. These micellar NPs consisting of biocompatible materials offer a promising approach for the clinical therapy of highly invasive solid tumors and metastases.
Keywords: Fru‐blocking; LMWH; antimetastatic nanoparticles; d‐α‐tocopheryl succinate (TOS); metastatic cascade; self‐delivering nanoparticles.
Figures

Similar articles
-
Enhanced stability and efficacy of GEM-TOS prodrug by co-assembly with antimetastatic shell LMWH-TOS.Acta Pharm Sin B. 2020 Oct;10(10):1977-1988. doi: 10.1016/j.apsb.2019.06.008. Epub 2019 Jun 26. Acta Pharm Sin B. 2020. PMID: 33163348 Free PMC article.
-
Multifunctional self-delivery micelles targeting the invasion-metastasis cascade for enhanced chemotherapy against melanoma and the lung metastasis.Asian J Pharm Sci. 2021 Nov;16(6):794-805. doi: 10.1016/j.ajps.2021.08.002. Epub 2021 Sep 16. Asian J Pharm Sci. 2021. PMID: 35027954 Free PMC article.
-
Self-Delivery Micellar Nanoparticles Prevent Premetastatic Niche Formation by Interfering with the Early Recruitment and Vascular Destruction of Granulocytic Myeloid-Derived Suppressor Cells.Nano Lett. 2020 Apr 8;20(4):2219-2229. doi: 10.1021/acs.nanolett.9b03883. Epub 2019 Dec 11. Nano Lett. 2020. PMID: 31823615
-
Phenylboronic acid modified nanoparticles simultaneously target pancreatic cancer and its metastasis and alleviate immunosuppression.Eur J Pharm Biopharm. 2021 Aug;165:164-173. doi: 10.1016/j.ejpb.2021.05.014. Epub 2021 May 19. Eur J Pharm Biopharm. 2021. PMID: 34020022
-
The application of nanoparticles in cancer immunotherapy: Targeting tumor microenvironment.Bioact Mater. 2020 Dec 26;6(7):1973-1987. doi: 10.1016/j.bioactmat.2020.12.010. eCollection 2021 Jul. Bioact Mater. 2020. PMID: 33426371 Free PMC article. Review.
Cited by
-
Enhanced stability and efficacy of GEM-TOS prodrug by co-assembly with antimetastatic shell LMWH-TOS.Acta Pharm Sin B. 2020 Oct;10(10):1977-1988. doi: 10.1016/j.apsb.2019.06.008. Epub 2019 Jun 26. Acta Pharm Sin B. 2020. PMID: 33163348 Free PMC article.
-
A pH/ROS dual-responsive system for effective chemoimmunotherapy against melanoma via remodeling tumor immune microenvironment.Acta Pharm Sin B. 2024 May;14(5):2263-2280. doi: 10.1016/j.apsb.2023.12.001. Epub 2023 Dec 16. Acta Pharm Sin B. 2024. PMID: 38799639 Free PMC article.
-
Design of DOX-GNRs-PNIPAM@PEG-PLA Micelle With Temperature and Light Dual-Function for Potent Melanoma Therapy.Front Chem. 2021 Jan 5;8:599740. doi: 10.3389/fchem.2020.599740. eCollection 2020. Front Chem. 2021. PMID: 33469525 Free PMC article.
-
Design of a targeted dual drug delivery system for boosting the efficacy of photoimmunotherapy against melanoma proliferation and metastasis.J Adv Res. 2025 May;71:533-550. doi: 10.1016/j.jare.2024.05.017. Epub 2024 May 19. J Adv Res. 2025. PMID: 38768811 Free PMC article.
-
Nanocarrier-Based Drug Delivery for Melanoma Therapeutics.Int J Mol Sci. 2021 Feb 13;22(4):1873. doi: 10.3390/ijms22041873. Int J Mol Sci. 2021. PMID: 33668591 Free PMC article. Review.
References
-
- Steeg P. S., Nat. Med. 2006, 12, 895. - PubMed
-
- Mohme M., Riethdorf S., Pantel K., Nat. Rev. Clin. Oncol. 2017, 14, 155. - PubMed
-
- Peinado H., Zhang H., Matei I. R., Costa‐Silva B., Hoshino A., Rodrigues G., Psaila B., Kaplan R. N., Bromberg J. F., Kang Y., Bissell M. J., Cox T. R., Giaccia A. J., Erler J. T., Hiratsuka S., Ghajar C. M., Lyden D., Nat. Rev. Cancer 2017, 17, 302. - PubMed
-
- Gray‐Schopfer V., Wellbrock C., Marais R., Nature 2007, 445, 851. - PubMed
LinkOut - more resources
Full Text Sources
Miscellaneous