. 2018 Sep 26;5(11):1372-1384.
doi: 10.1002/acn3.648. eCollection 2018 Nov.

Deep brain stimulation in five patients with severe disorders of consciousness

Affiliations

Deep brain stimulation in five patients with severe disorders of consciousness

Jean-Jacques Lemaire et al. Ann Clin Transl Neurol. .

Abstract

Objective: The efficacy of deep brain stimulation in disorders of consciousness remains inconclusive. We investigated bilateral 30-Hz low-frequency stimulation designed to overdrive neuronal activity by dual pallido-thalamic targeting, using the Coma Recovery Scale Revised (CRS-R) to assess conscious behavior.

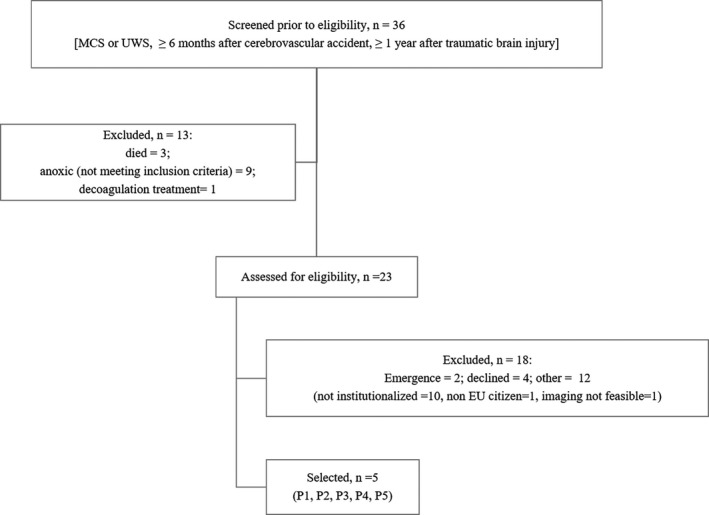
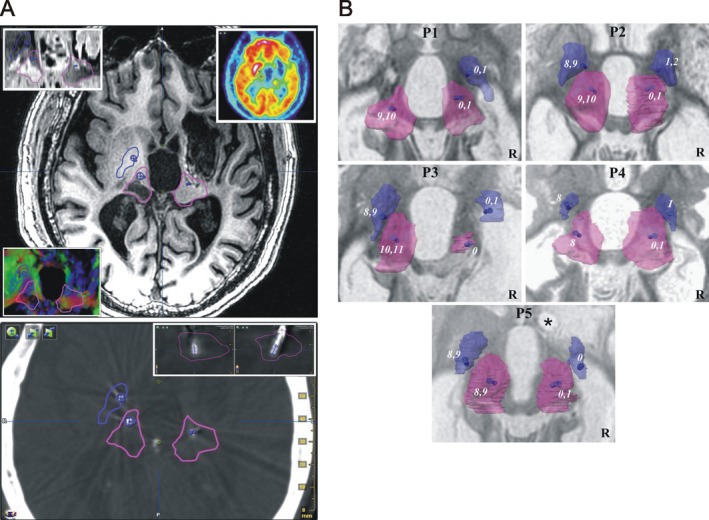
Methods: We conducted a prospective, single center, observational 11-month pilot study comprising four phases: baseline (2 months); surgery and titration (1 month); blind, random, crossover, 1.5-month ON and OFF periods; and unblinded, 5-month stimulation ON. Five adult patients were included: one unresponsive-wakefulness-syndrome male (traumatic brain injury); and four patients in a minimally conscious state, one male (traumatic brain injury) and three females (two hemorrhagic strokes and one traumatic brain injury). Primary outcome measures focused on CRS-R scores. Secondary outcome measures focused notably on baseline brain metabolism and variation in activity (stimulation ON - baseline) using normalized fluorodeoxyglucose positron emission tomography maps. Statistical analysis used random-effect models.

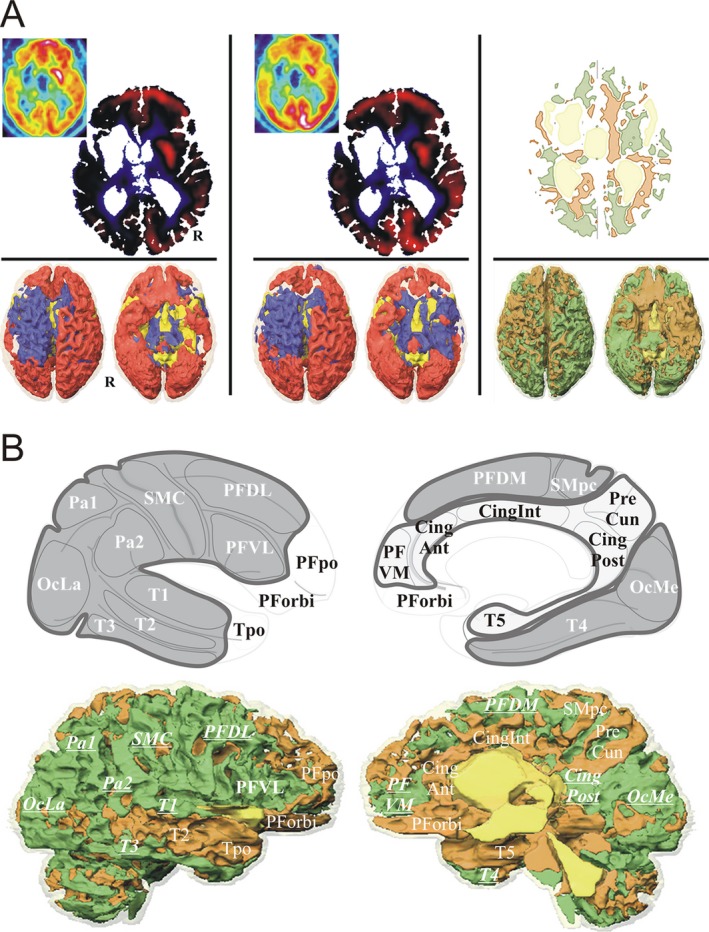
Results: The two male patients (one minimally conscious and one unresponsive wakefulness syndrome) showed improved mean CRS-R scores (stimulation ON vs. baseline), in auditory, visual and oromotor/verbal subscores, and visual subscores respectively. The metabolism of the medial cortices (low at baseline in all five patients) increased specifically in the two responders.

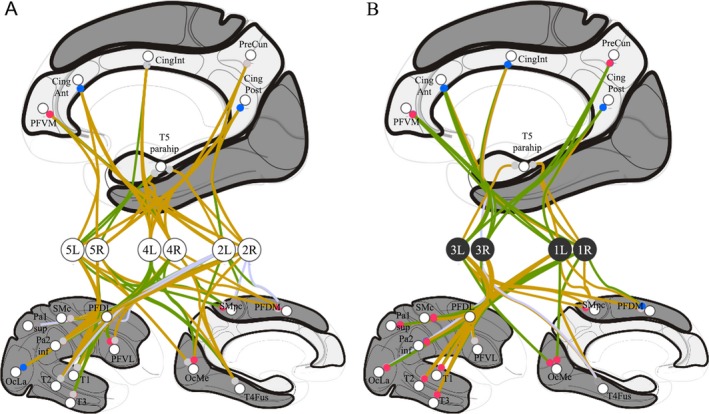
Interpretation: Our findings show there were robust but limited individual clinical benefits, mainly in visual and auditory processes. Overall modifications seem linked to the modulation of thalamo-cortico-basal and tegmental loops activating default mode network cortices. Specifically, in the two responders there was an increase in medial cortex activity related to internal awareness.


Figures

Figure 1
Figure 1
Enrolment of patients. MCS, Minimally Conscious State; UWS, Vegetative State; EU, European Union.
Figure 2
Figure 2
Contacts. (A) Deep brain targets and electrode positioning: Example (P1) of right and left targeted structures, pallidum (blue) and thalamus (pink) and location of effective (used in chronic stimulation; blue segments) contacts: top, T1 axial slice (4 mm above the anterior‐posterior commissure plane; inlays, clockwise from top left, Inversion‐Recovery sequence, FDG, and color‐coded diffusion tensor map); bottom, coregistered (with preoperative imaging) postoperative CT‐Scan, axial slice going through the center of the two effective contacts of the left thalamus, inlays, top‐right, sagittal and coronal slices going through the effective contacts within the thalamus. (B) Contact locations: Contacts (number, from distal to proximal, right from 0 to 3, left from 4 to 11) within the pallidum (blue) and thalamus (pink) of the 5 patients (P): superior view of 3D (semi‐transparent) anatomical structures, the effective contacts (numbers) are displayed as blue segments; background axial T1‐weighted MRI slice (inverted gray scale) going through anterior‐posterior commissure (ACPC) plane; *coil artefact; R, right.
Figure 3
Figure 3
FDG methods. (A) FDG normalization: Baseline (left column) and DBSON (intermediate column) normalized FDG, and DBSON minus Baseline normalized FDG variation (right column), example for P1: top row (4 mm above the anterior‐posterior commissure plane), left and intermediate columns (inlay, raw FDG slices), standardized uptake values of cerebral metabolic rate of glucose normalized by cerebral global mean (CGM) activity (red, above CGM; blue, below CGM), and right column, variation map (green, increase; beige, decrease); bottom row, 3D rendering (superior and inferior views) of normalized data (R, right hemisphere). (B) FDG metabolism by cortical region and area: Top row, cortical areas and regions: internal area (light gray) with prefrontal ventromedial (PFVM), precuneal (PreCun), cingulate anterior (CingAnt), intermediate (CingInt) and posterior (posterior, retrosplenial and isthmus; CingPost) and temporo mesial para hippocampal (T5) cortices; external area (dark gray) with prefrontal dorsolateral (PFDL), ventrolateral (PFVL) and dorsomedial (PFDM), sensorimotor central (SMC) and paracentral (SMpc), parietal superior (Pa1) and inferior (Pa2), occipital lateral (OcLa) and medial (OcMe), temporal T1 (T1), T2 (T2), T3 (T3) and fusiform gyrus (T4) cortices; other area (white) with prefrontal orbital (PForbi) and polar (PFpo), temporopolar (Tpo) and cerebellar (Cerb) cortices. Bottom row, specification of FDG activities by region: example P1, right hemisphere; bold underlined increased activity (upward variation).
Figure 4
Figure 4
FDG results. Individual analysis of right (R) and left (L) hemispheres of the five patients (see Figure 3.B. for abbreviations): A, non‐responders, P2, P4 and P5, (white circles); B, responders, P1 and P3, (black circles); top, medial view showing the internally‐oriented cortices (light gray); bottom, lateral (left) and medial (right) views showing the externally‐oriented cortices (dark gray); FDG metabolism variations are represented by connection lines toward cortices, green when the metabolism increased (DBSON > Baseline) and beige when the metabolism decreased (Baseline > DBSON) (connections with lesioned cortices are in light purple); baseline FDG metabolism is represented by colored circle, red for high relative activity and blue for low relative activity (gray for near cerebral global mean activity); the two responders exhibited significant increased FDG activity in the internally‐oriented area.

References

    1. Katz DI, Polyak M, Coughlan D, et al. Natural history of recovery from brain injury after prolonged disorders of consciousness: outcome of patients admitted to inpatient rehabilitation with 1‐4 year follow‐up. Prog Brain Res 2009;177:73–88. - PubMed
    1. Ventura T, Harrison‐Felix C, Carlson N, et al. Mortality after discharge from acute care hospitalization with traumatic brain injury: a population‐based study. Arch Phys Med Rehabil 2010;91:20–29. - PubMed
    1. Luauté J, Maucort‐Boulch D, Tell L, et al. Long‐term outcomes of chronic minimally conscious and vegetative states. Neurology 2010;75:246–252. - PubMed
    1. Harrison‐Felix C, Pretz C, Hammond FM, et al. Life expectancy after inpatient rehabilitation for traumatic brain injury in the United States. J Neurotrauma 2015;32:1893–1901. - PMC - PubMed
    1. Avesani R, Gambini MG, Albertini G. The vegetative state: a report of two cases with a long‐term follow‐up. Brain Inj 2006;20:333–338. - PubMed

LinkOut - more resources