. 2018 Nov 20:1:200.
doi: 10.1038/s42003-018-0205-5. eCollection 2018.

Neuronal coding of multiscale temporal features in communication sequences within the bat auditory cortex

Affiliations

Neuronal coding of multiscale temporal features in communication sequences within the bat auditory cortex

Francisco García-Rosales et al. Commun Biol. .

Abstract

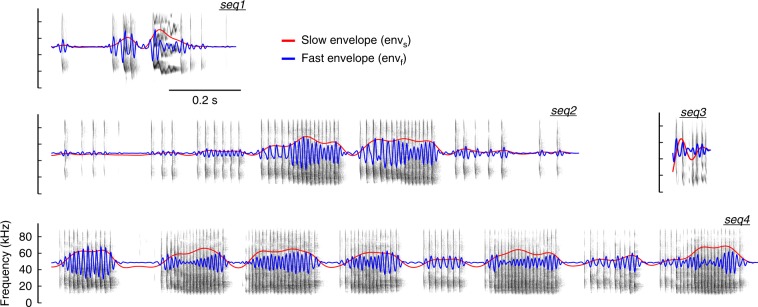
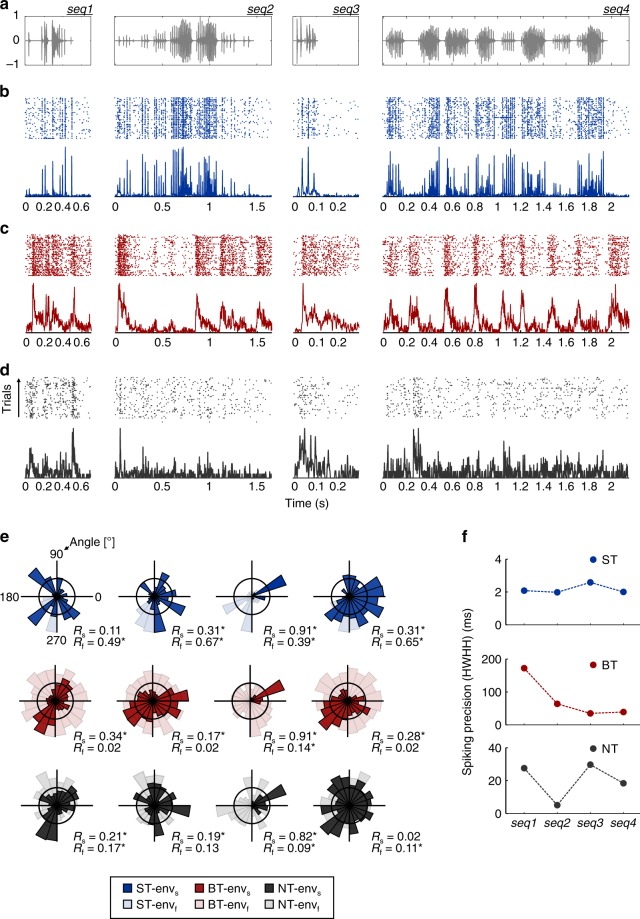
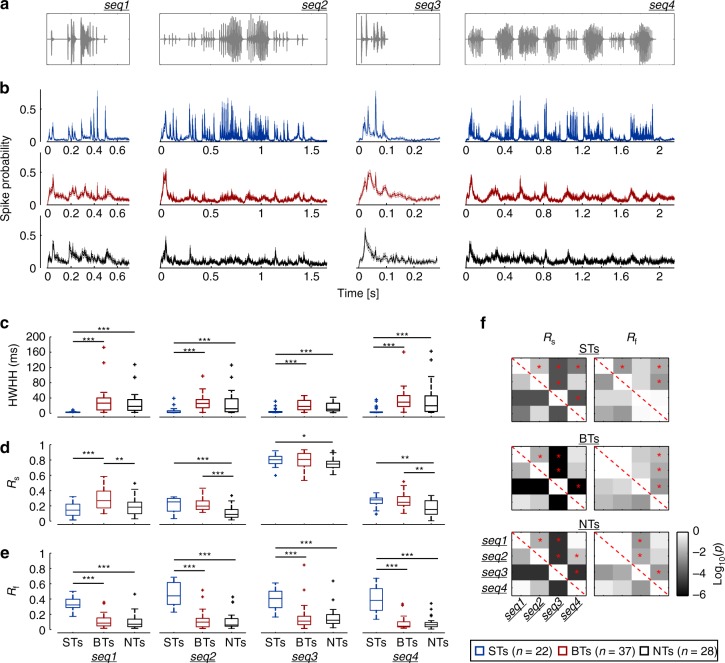
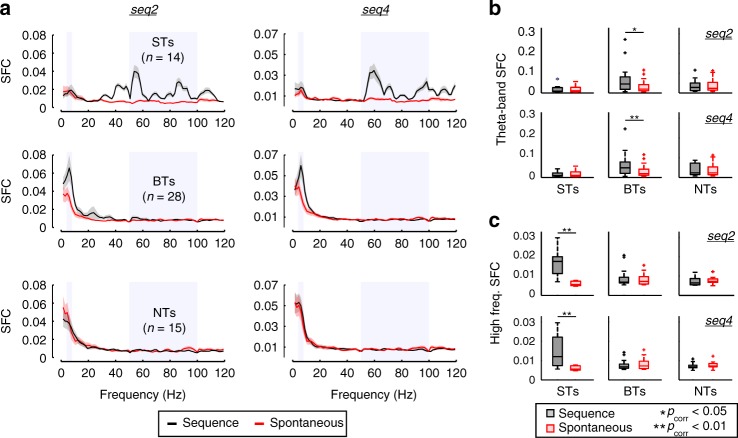
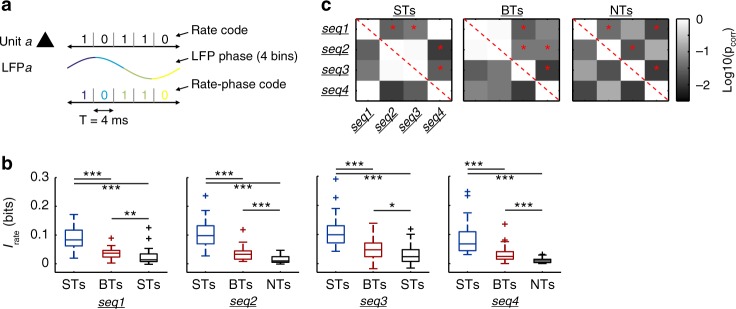
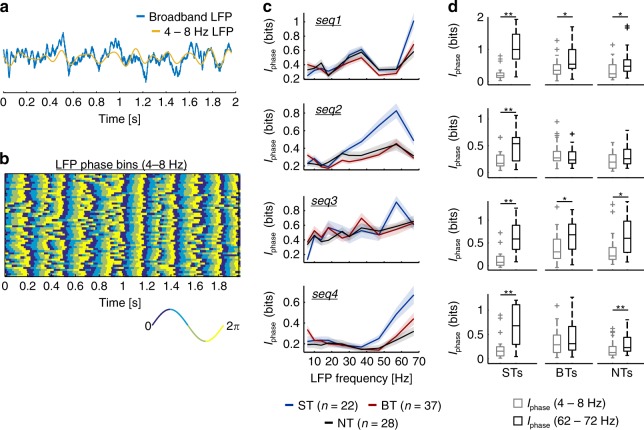
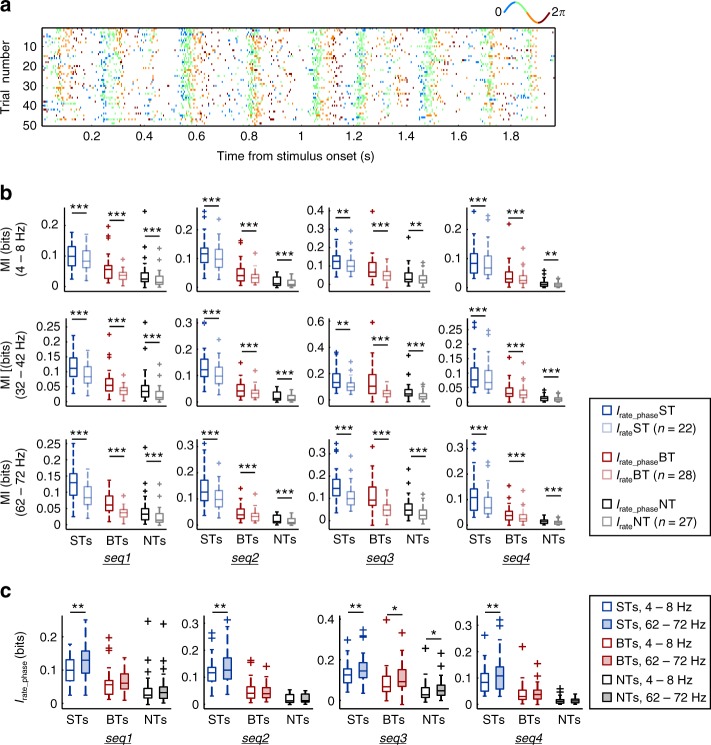
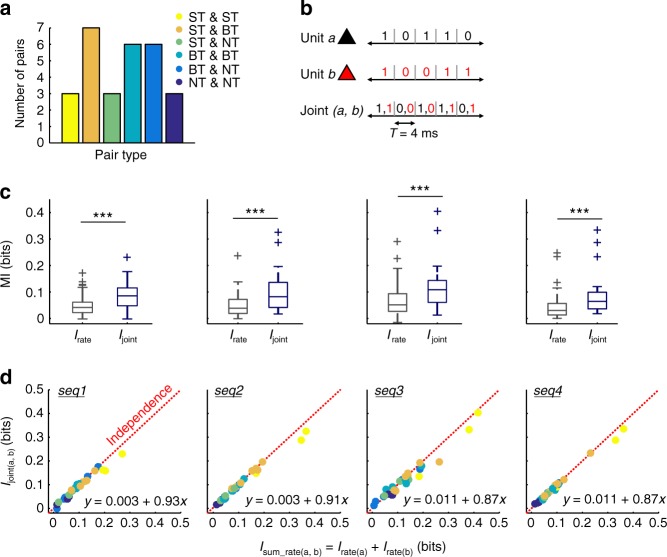
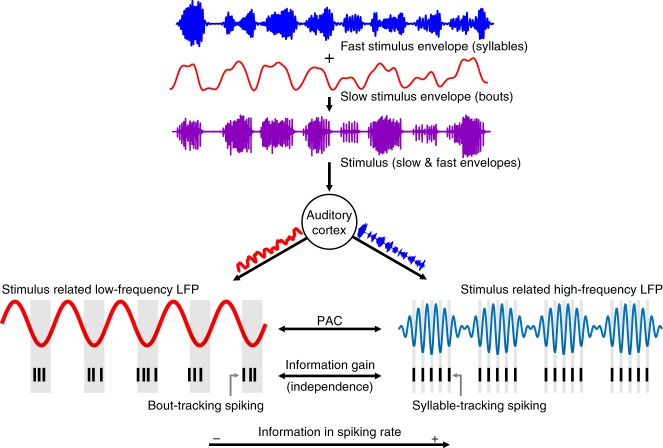
Experimental evidence supports that cortical oscillations represent multiscale temporal modulations existent in natural stimuli, yet little is known about the processing of these multiple timescales at a neuronal level. Here, using extracellular recordings from the auditory cortex (AC) of awake bats (Carollia perspicillata), we show the existence of three neuronal types which represent different levels of the temporal structure of conspecific vocalizations, and therefore constitute direct evidence of multiscale temporal processing of naturalistic stimuli by neurons in the AC. These neuronal subpopulations synchronize differently to local-field potentials, particularly in theta- and high frequency bands, and are informative to a different degree in terms of their spike rate. Interestingly, we also observed that both low and high frequency cortical oscillations can be highly informative about the listened calls. Our results suggest that multiscale neuronal processing allows for the precise and non-redundant representation of natural vocalizations in the AC.


Conflict of interest statement

The authors declare no competing interests.

Figures

Fig. 1
Fig. 1
Natural distress calls used as stimuli. Spectrotemporal representation of the four natural distress sequences used as stimuli in the study. The slow (0.1–15 Hz, envs) and fast (50–100 Hz, envf) amplitude envelopes of each call are shown within the spectrograms in red and blue, respectively
Fig. 2
Fig. 2
Three types of units coexist in the bat auditory cortex. a Oscillogram of the natural distress sequences used as stimuli in this study (see also Fig. 1). b Raster plots (top) and spike probability density function over time (bottom; 1 ms precision) of a representative syllable-tracking (ST) unit, responding to each of the distress calls tested. The response to a specific sequence is aligned with panel a for clarity. c Response of a representative bout-tracking (BT) unit, shown following the same conventions as in b. d Response of a non-tracking (NT) unit, shown following the same conventions as in b and c. e Circular distribution of spike phases (arranged by calls across columns and unit type across rows; note the color coding for identifying each unit type). Spike phases relative to the slow (0.1–15 Hz) stimulus envelope are shown in dark colors, while spike phases relative to the fast (50–100 Hz) envelope are shown in light colors. f Neuronal precision (quantified with the HWHH, see main text) of the three example units, across stimuli. Note the differences in scale of y-axes (envs: slow enlveope; envf: fast envelope; Rs: mean vector, slow envelope; Rf: mean vector, fast envelope)
Fig. 3
Fig. 3
Population response properties across calls. a Oscillogram of the natural distress calls used as stimuli. b Average population responses of ST (blue), BT (red), and NT (black) units in response to the distress sequences (shown as spike probability density function over time, 1 ms precision; thick line depicts the mean, whereas thinner lines represent the SEM). c Neuronal precision (measured as HWHH, see main text) of the three subpopulations in response to the natural stimuli (from seq1 to seq4, left to right). Syllable-tracking units were always significantly more precise than BT and NT units (FDR-corrected Wilcoxon rank-sum tests, pcorr ≤ 0.0013), but no significant differences occurred between BTs and NTs in any of the calls tested (pcorr > 0.08). d Comparison of vector strength from the spike phases relative to the slow (0.1–15 Hz) call envelopes (Rs). Across sequences and according to their Rs value, NT units were significantly less synchronized than BT units (pcorr ≤ 0.02; except in the shortest call, seq3). e Comparison of vector strength from spike phases relative to the fast (50–100 Hz) call envelope (Rf). ST units were always better synchronized to the fast temporal structure of the sequences (pcorr < 2.2 × 10−6), while no differences occurred between BT or NT units (pcorr > 0.45). f Significance matrix of statistical comparisons (Wilcoxon signed-rank test, FDR corrected) between vector strength values (Rs, left column; Rf right column) across calls, for each neuronal type (STs, BTs, or NTs, indicated in the figure). Each cell (i,j) in a matrix shows the corrected p-value obtained by comparing the R value of each group in response to two different sequences, seq(i) and seq(j). For example, the red star in cell (1,2) of the upper left matrix indicates that when considering the Rs of ST units, there were significant differences between responses elicited by seq1 and seq2. Note that these matrixes are symmetrical along the diagonal (red dashed line) (*pcorr < 0.05; **pcorr < 0.01; ***pcorr < 0.001)
Fig. 4
Fig. 4
Spike–LFP coherence patterns are group specific. a Population spike–field coherence (SFC) for ST (top), BT (middle), and NT (bottom) units, in response to calls seq2 (left column) and seq4 (right; i.e. the two longest calls in this study). Vertical shaded areas indicate frequency bands of 4–8 and 50–100 Hz (that is, theta-band and high- frequency band of the LFP, respectively). Black traces indicate coherence calculated with spikes and LFPs recorded during sound stimulation, whereas red traces show coherence during spontaneous activity (solid lines, mean; shaded areas, SEM). b Comparison of average theta-band SFC in response to both sequences (top, seq2; bottom, seq4). Only BTs significantly increased their theta-band spike–LFP synchrony during stimulation as compared to spontaneous coherence (FDR-corrected Wilcoxon signed-rank tests, pcorr ≤ 0.03 in the case of BT units). c Same as in b but considering SFC in high frequencies (50–100 Hz). Only ST units significantly increased their high-frequency spike–LFP coherence during acoustic stimulation, in response to either sequence (pcorr ≤ 0.0024). (*pcorr < 0.05; **pcorr < 0.01)
Fig. 5
Fig. 5
Syllable-tracking units provide the highest information in terms of spiking rate. a Representation of the main neuronal codes used in the study: a rate code (Irate), determined by the neuronal spiking; a phase code (Iphase), determined by binned phases of the LFP; and a rate-phase code (Irate_phase), which combines both of the above. b Information in the rate code of the three neuronal groups (STs, BTs, and NTs; represented in blue, red, and black, respectively). Significance was assessed after FDR-corrected Wilcoxon ranksum tests. Note that ST units were the most informative in terms of firing-rate (pcorr < 2.6 × 10−5). c Significance matrixes showing the results of statistically comparing Irate for each neuronal group, across sequences. Conventions as defined in Fig. 3f. Briefly, cell (i,j) in a matrix represents the p-value of comparing Irate in response to sequences i and j, respectively. For example, in the leftmost matrix the star in cell (1, 2) indicates that Irate in ST units significantly differed in response to seq1 and seq2. Note that the matrixes are symmetrical along the diagonal (red dashed line). (*pcorr < 0.05; **pcorr < 0.01; ***pcorr < 0.001)
Fig. 6
Fig. 6
Information content of LFP phase. a Single trial broadband (blue) and theta-band (4–8 Hz; yellow) LFP traces. Depicted field potentials were recorded in response to seq4 and correspond to the same exemplary BT unit shown in Fig. 2c. b Binned LFP phase across trials of theta-band LFPs, according to the phase discretization used to calculate Iphase. The convention for the bins is shown at the bottom (note that the binning precision was of π/2). c Information content of the LFP phase (Iphase) associated to ST (blue), BT (red), and NT (black) units, in different frequency bands and across all sequences tested. Data is presented as mean (solid lines) ± SEM (shaded areas). d Statistical comparisons (FDR-corrected Wilcoxon signed-rank test) of Iphase in theta-band LFPs (light gray) vs. Iphase in high-frequency LFPs (62–72 Hz; black). Each row depicts comparisons for a particular call, considering ST, BT, or NT units (arranged in columns left to right, respectively). (*pcorr < 0.05; **pcorr < 0.01)
Fig. 7
Fig. 7
Spike rate information content is increased by the phase of low and high frequency LFPs. a Raster plot of the BT unit shown in Fig. 2c (in response to seq4), in which spikes are color-coded according to the phase of 4–8 Hz LFPs. Note the bin color scheme in the panel. b Information content of the phase-of-fire code (Irate_phase) vs. the rate code (Irate), for each neuronal group (ST, BT, and NT), in three different LFP bands: a low frequency band (4–8 Hz, or theta), a middle frequency band (32–42 Hz), and a high frequency band (62–72 Hz). Comparisons are performed for each natural sequence tested, showing that Irate_phase was always significantly higher than Irate (FDR-corrected Wilcoxon signed-rank tests, pcorr ≤ 0.0037), also in the highest frequency band considered, 62–72 Hz. c Comparisons between Irate_phase obtained using low-frequency LFPs (4–8 Hz), vs. Irate_phase using high-frequency oscillations (62–72 Hz), for each neuronal group, in every call tested. Irate_phase calculated with 62–72 Hz LFPs was either significantly higher than Irate_phase computed with 4–8 Hz LFPs (FDR-corrected Wilcoxon signed-rank tests, pcorr ≤ 0.026), or at least not significantly different (pcorr > 0.077). (*pcorr <  0.05; **pcorr < 0.01; ***pcorr < 0.001)
Fig. 8
Fig. 8
Auditory cortical units provide mostly independent information. a Quantification of neuronal pair types according to their composition (based on the unit classification as ST, BT, or NT). b Schematic representation of the joint response of two neurons, a and b, used to quantify Ijoint. c Statistical comparisons of Ijoint (blue) vs. Irate (gray) in each of the natural calls tested. In all cases, Ijoint was significantly higher than Irate (FDR-corrected Wilcoxon rank-sum tests, pcorr < 5.3 × 10−4). d Information carried by a joint response of a pair (Ijoint) plotted vs. the sum of information in the rate code (Irate) of each unit comprising such pair (each dot represents a pair, color coded according to the units that compose it; see also panel a), for each natural sequence tested. The red dashed line represents the regime in which two neuronal responses convey independent information (i.e. Ijoint = Irate(a) + Irate(b), with a slope of 1). Points below the line represent redundant interactions, whereas points above the line represent synergistic interactions between units in a pair. Regression slopes for observed data are indicated in each panel. (***pcorr < 0.01)
Fig. 9
Fig. 9
Neuronal processing of multiscale temporal features in the AC. Conspecific distress vocalizations of C. perspicillata are typically composed of two embedded temporal scales: a fast one (>50 Hz), consistent with the syllabic rate of the sequence, and a slow one (<15 Hz), consistent with its bout rate. In the AC, such rhythms are represented not only via stimulus-related neuronal oscillations, but also through the spiking patterns of two main neuronal subpopulations: syllable-tracking and bout-tracking units. These subgroups phase-lock to cortical LFPs in distinct frequency bands, in accordance to the temporal features of the calls that they represent (i.e. BTs synchronize to theta oscillations, whereas STs synchronize to LFP frequencies of >50 Hz). While ST units were overall more informative than their BT counterparts, neuronal groups in the auditory cortex which represent distinct timescales present in natural stimuli provided independent information, potentially allowing for a precise and non-redundant encoding, at a neuronal level, of the multiple timescales existent in communication signals

Similar articles

Cited by

References

    1. Seyfarth RM, Cheney DL. Production, usage, and comprehension in animal vocalizations. Brain Lang. 2010;115:92–100. doi: 10.1016/j.bandl.2009.10.003. - DOI - PubMed
    1. Kanwal JS, Rauschecker JP. Auditory cortex of bats and primates: managing species-specific calls for social communication. Front. Biosci. 2007;12:4621–4640. doi: 10.2741/2413. - DOI - PMC - PubMed
    1. Hechavarria JC, Beetz MJ, Macias S, Kossl M. Vocal sequences suppress spiking in the bat auditory cortex while evoking concomitant steady-state local field potentials. Sci. Rep. 2016;6:39226. doi: 10.1038/srep39226. - DOI - PMC - PubMed
    1. Hechavarria JC, Beetz MJ, Macias S, Kossl M. Distress vocalization sequences broadcasted by bats carry redundant information. J. Comp. Physiol. A. 2016;202:503–515. doi: 10.1007/s00359-016-1099-7. - DOI - PubMed
    1. Brudzynski SM. Ethotransmission: communication of emotional states through ultrasonic vocalization in rats. Curr. Opin. Neurobiol. 2013;23:310–317. doi: 10.1016/j.conb.2013.01.014. - DOI - PubMed