. 2018 Nov 20:1:201.
doi: 10.1038/s42003-018-0197-1. eCollection 2018.

Slow recovery from a disease epidemic in the spotted hyena, a keystone social carnivore

Affiliations

Slow recovery from a disease epidemic in the spotted hyena, a keystone social carnivore

Sarah Benhaiem et al. Commun Biol. .

Abstract

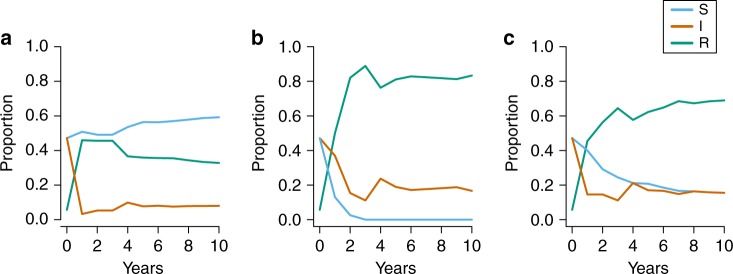
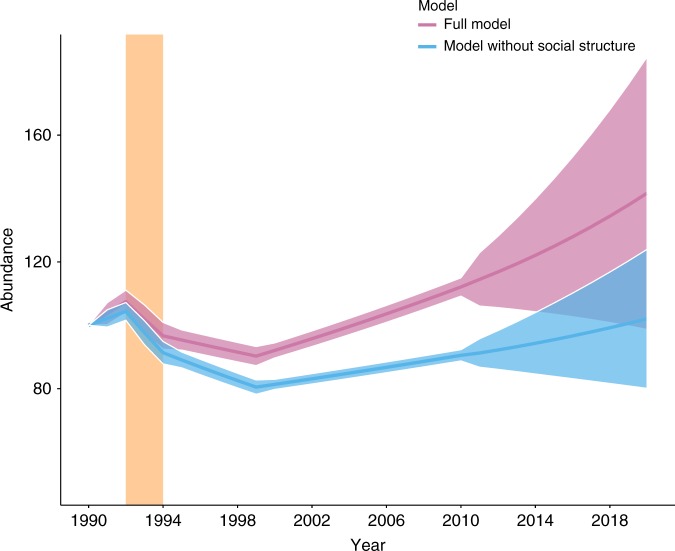
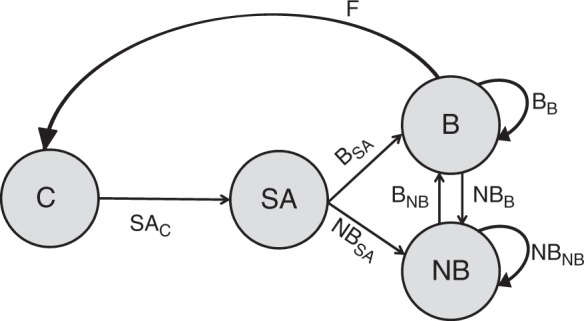
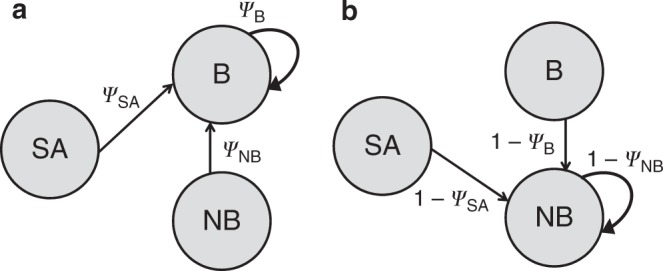
Predicting the impact of disease epidemics on wildlife populations is one of the twenty-first century's main conservation challenges. The long-term demographic responses of wildlife populations to epidemics and the life history and social traits modulating these responses are generally unknown, particularly for K-selected social species. Here we develop a stage-structured matrix population model to provide a long-term projection of demographic responses by a keystone social predator, the spotted hyena, to a virulent epidemic of canine distemper virus (CDV) in the Serengeti ecosystem in 1993/1994 and predict the recovery time for the population following the epidemic. Using two decades of longitudinal data from 625 known hyenas, we demonstrate that although the reduction in population size was moderate, i.e., the population showed high ecological 'resistance' to the novel CDV genotype present, recovery was slow. Interestingly, high-ranking females accelerated the population's recovery, thereby lessening the impact of the epidemic on the population.


Conflict of interest statement

The authors declare no competing interests.

Figures

Fig. 1
Fig. 1
Population growth rate (λ) of female spotted hyenas. Data shown are for female spotted hyenas in the Serengeti National Park during the three epidemic periods (pre-epidem: 1990–1992; epidem: 1993–1994; post-epidem: 1995–1999). Empty circles represent outliers, the boxes encompass the first to the third quartiles, inside the box the thick horizontal line shows the median and the whiskers are located at 1.5 × IQR (interquartile range) below the first quartile and at 1.5 × IQR above the third quartile
Fig. 2
Fig. 2
Sensitivity of the population growth rate (λ) to changes in vital rates in female hyenas during each period. a pre-epidemic, b epidemic and c post-epidemic. We only show the vital rates with effects on λ exceeding 10%, and order them according to their decreasing contribution to the absolute value of change of λ. Empty circles represent outliers, the boxes encompass the first to the third quartiles, inside the box the thick horizontal line shows the median and the whiskers are located at 1.5 × IQR (interquartile range) below the first quartile and at 1.5 × IQR above the third quartile. The pink boxes represent the vital rates for high-ranking females and the yellow boxes those for low-ranking ones. For the notation of parameters, see Table 1. Note that some parameters, such as the survival of high-ranking recovered non-breeder females ϕNBHR,were not present as input parameter values in Table 1. This is because the function used to conduct the sensitivity analysis of λ considered each parameter of the symbolic matrix as unique in itself, even if input values were similar
Fig. 3
Fig. 3
Sensitivity of R0 to changes in vital rates in female hyenas during the epidemic period. R0 is the basic reproduction number for the virulent 1993/1994 CDV strain in hyenas. We only show the vital rates with effects on R0 exceeding 10% and order them according to their decreasing contribution to the change in absolute value of R0. Empty circles represent outliers, the boxes encompass the first to the third quartiles, inside the box the thick horizontal line shows the median and the whiskers are located at 1.5 × IQR (interquartile range) below the first quartile and at 1.5 × IQR above the third quartile. As in Fig. 2, pink boxes represent the vital rates for high-ranking females and yellow boxes those for low-ranking ones. The grey boxes represent vital rates for both high and low-ranking combined or vital rates unrelated to rank. For the notation of parameters, see Table 1. Note that sr here represents sex ratio
Fig. 4
Fig. 4
Dynamic projections of the proportion of different infection states and their convergence to a stable stage distribution. Projections are shown for medium term (first 10 years). We show dynamic projections for susceptible [S] (blue), infected [I] (orange) and recovered [R] (green) females (across all demographic and social states) during a pre-epidem, b epidem, c post-epidem. The starting values in each panel correspond to the (time invariant) initial state vector projection from the MECMR model. This figure illustrates which infection state predominates in each epidemic period, and how quickly each state converges to the stable stage distribution
Fig. 5
Fig. 5
Mean abundance of female hyenas. Mean abundance (±95% confidence intervals) of female hyenas projected throughout the study period (1990–2010) and predicted beyond (2010–2020) based on the full model (pink) and a model without social structure (blue). The vertical bar (light orange) represents the period (1993–1994) during which the CDV epidemic occurred. This figure does not illustrate the actual number of hyenas in the study population; the population growth rate estimates from each period were used to produce it. The starting abundance was indexed as 100
Fig. 6
Fig. 6
Population model. Structure of the overall matrix population model or meta-matrix M in Eq. (1), with its 8 survival-transition submatrices indicated in bold. Arrows represent the survival-transition probabilities of female hyenas, i.e. the transitions between the 4 demographic states (shown as grey circles and with C cub, SA subadult, B breeder, NB non-breeder), conditional on survival and considering potential changes in social and infection states. The matrices were named according to the following demographic state, with the starting demographic state as index. F was the fertility matrix, accounting for cub production by breeders
Fig. 7
Fig. 7
Transitions between demographic states. Transition to a the breeder state and b the non-breeder state, for female hyenas. The grey circles show the 3 demographic states from which the breeder and non-breeder states can be accessed (SA subadult, B breeder, NB non-breeder). Arrows and symbols in italics represent the transition probabilities to a the breeder state from subadults (ψSA), breeders (ψB) and non-breeders (ψNB) and b to the non-breeder state from subadults (1−ψSA), breeders (1−ψB) and non-breeders (1−ψNB). All transition probabilities varied with social status (see Table 1 for parameter notations and estimates) − this is not shown, for simplicity
Fig. 8
Fig. 8
Transitions between social and infection states for female hyenas. a Transitions between social states in subadult, breeder and non-breeder female hyenas corresponded to the submatrix Social (Eq. (17)). The two social states are indicated as grey circles (L: low ranking; H: high-ranking). The arrows show the transition probabilities, with rL and rH the probabilities of staying in a low or high social state, respectively, and with 1−rL and 1−rH the probabilities of becoming high or low-ranking, respectively. b Transitions between infection states in subadult, breeder and non-breeder female hyenas, corresponding to the submatrix Infection (Eq. (20)). The three infection states are indicated as grey circles (S susceptible, I infected, R recovered). The arrows show the transition probability between those states, with β the probability of transition from a susceptible state to an infected state (the infection probability). The infection probability varied with the social state (see Table 1) − this is not shown, for simplicity

Similar articles

Cited by

References

    1. Thorne E, Williams ES. Disease and endangered species: the black‐footed ferret as a recent example. Conserv. Biol. 1988;2:66–74. doi: 10.1111/j.1523-1739.1988.tb00336.x. - DOI
    1. Berger L, et al. Chytridiomycosis causes amphibian mortality associated with population declines in the rain forests of Australia and Central America. Proc. Natl Acad. Sci. USA. 1998;95:9031–9036. doi: 10.1073/pnas.95.15.9031. - DOI - PMC - PubMed
    1. Daszak P, Cunningham AA, Hyatt AD. Emerging infectious diseases of wildlife-threats to biodiversity and human health. Science. 2000;287:443–449. doi: 10.1126/science.287.5452.443. - DOI - PubMed
    1. Blehert DS, et al. Bat white-nose syndrome: an emerging fungal pathogen? Science. 2009;323:227–227. doi: 10.1126/science.1163874. - DOI - PubMed
    1. Engering A, Hogerwerf L, Slingenbergh J. Pathogen–host–environment interplay and disease emergence. Emerg. Microbes Infect. 2013;2:e5. doi: 10.1038/emi.2013.5. - DOI - PMC - PubMed