Interreader Variability of Dynamic Contrast-enhanced MRI of Recurrent Glioblastoma: The Multicenter ACRIN 6677/RTOG 0625 Study
- PMID: 30480488
- PMCID: PMC6358054
- DOI: 10.1148/radiol.2019181296
Interreader Variability of Dynamic Contrast-enhanced MRI of Recurrent Glioblastoma: The Multicenter ACRIN 6677/RTOG 0625 Study
Abstract
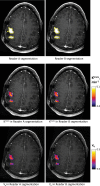
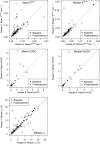
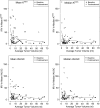
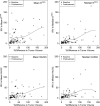
Purpose To evaluate factors contributing to interreader variation (IRV) in parameters measured at dynamic contrast material-enhanced (DCE) MRI in patients with glioblastoma who were participating in a multicenter trial. Materials and Methods A total of 18 patients (mean age, 57 years ± 13 [standard deviation]; 10 men) who volunteered for the advanced imaging arm of ACRIN 6677, a substudy of the RTOG 0625 clinical trial for recurrent glioblastoma treatment, underwent analyzable DCE MRI at one of four centers. The 78 imaging studies were analyzed centrally to derive the volume transfer constant (Ktrans) for gadolinium between blood plasma and tissue extravascular extracellular space, fractional volume of the extracellular extravascular space (ve), and initial area under the gadolinium concentration curve (IAUGC). Two independently trained teams consisting of a neuroradiologist and a technologist segmented the enhancing tumor on three-dimensional spoiled gradient-recalled acquisition in the steady-state images. Mean and median parameter values in the enhancing tumor were extracted after registering segmentations to parameter maps. The effect of imaging time relative to treatment, map quality, imager magnet and sequence, average tumor volume, and reader variability in tumor volume on IRV was studied by using intraclass correlation coefficients (ICCs) and linear mixed models. Results Mean interreader variations (± standard deviation) (difference as a percentage of the mean) for mean and median IAUGC, mean and median Ktrans, and median ve were 18% ± 24, 17% ± 23, 27% ± 34, 16% ± 27, and 27% ± 34, respectively. ICCs for these metrics ranged from 0.90 to 1.0 for baseline and from 0.48 to 0.76 for posttreatment examinations. Variability in reader-derived tumor volume was significantly related to IRV for all parameters. Conclusion Differences in reader tumor segmentations are a significant source of interreader variation for all dynamic contrast-enhanced MRI parameters. © RSNA, 2018 Online supplemental material is available for this article. See also the editorial by Wolf in this issue.
Figures


Comment in
-
MRI of Recurrent Glioblastoma: Reliability and Reality.Radiology. 2019 Feb;290(2):477-478. doi: 10.1148/radiol.2018182530. Epub 2018 Nov 27. Radiology. 2019. PMID: 30480485 No abstract available.
References
-
- Goh V, Schaeffter T, Leach M. Reproducibility of dynamic contrast-enhanced MR imaging: why we should care. Radiology 2013;266(3):698–700. - PubMed
-
- Ng CS, Raunig DL, Jackson EF, et al. Reproducibility of perfusion parameters in dynamic contrast-enhanced MRI of lung and liver tumors: effect on estimates of patient sample size in clinical trials and on individual patient responses. AJR Am J Roentgenol 2010;194(2):W134–W140. - PubMed
-
- Heye T, Davenport MS, Horvath JJ, et al. Reproducibility of dynamic contrast-enhanced MR imaging. I. Perfusion characteristics in the female pelvis by using multiple computer-aided diagnosis perfusion analysis solutions. Radiology 2013;266(3):801–811. - PubMed
-
- Dale BM, Jesberger JA, Lewin JS, Hillenbrand CM, Duerk JL. Determining and optimizing the precision of quantitative measurements of perfusion from dynamic contrast enhanced MRI. J Magn Reson Imaging 2003;18(5):575–584. - PubMed
Publication types
MeSH terms
Grants and funding
LinkOut - more resources
Full Text Sources
Medical

