

The RSNA Pediatric Bone Age Machine Learning Challenge
- PMID: 30480490
- PMCID: PMC6358027
- DOI: 10.1148/radiol.2018180736
The RSNA Pediatric Bone Age Machine Learning Challenge
Abstract
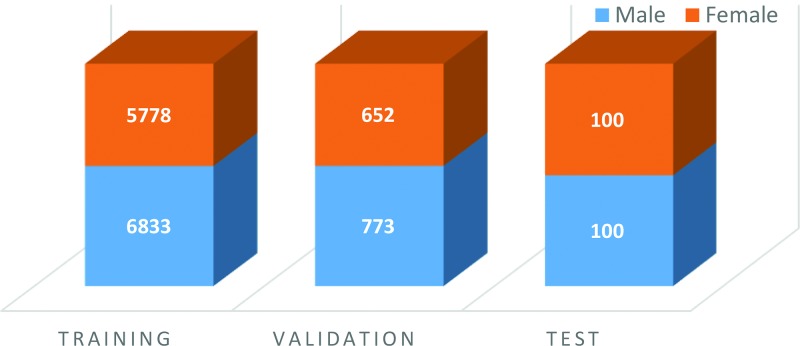
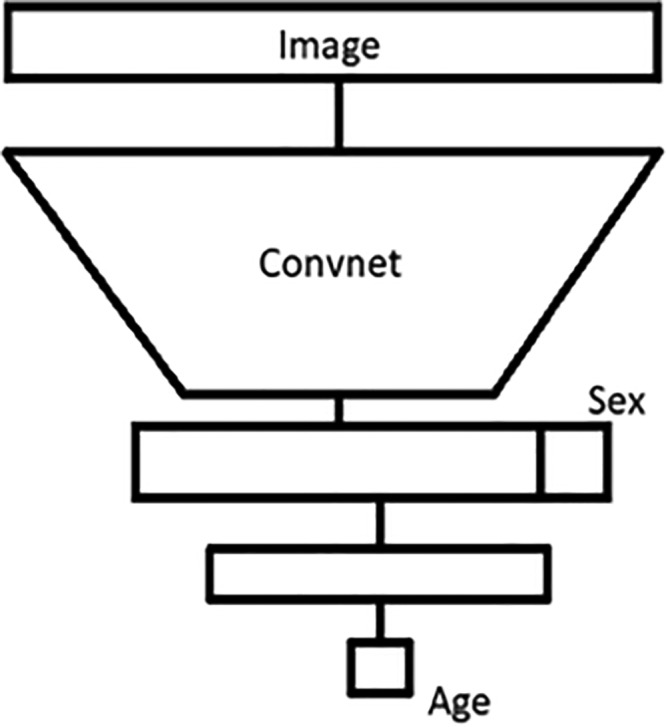
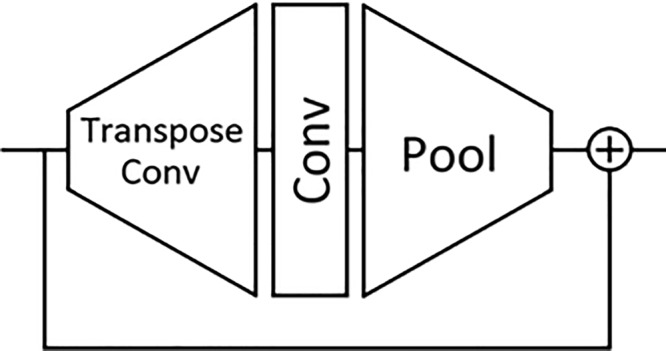
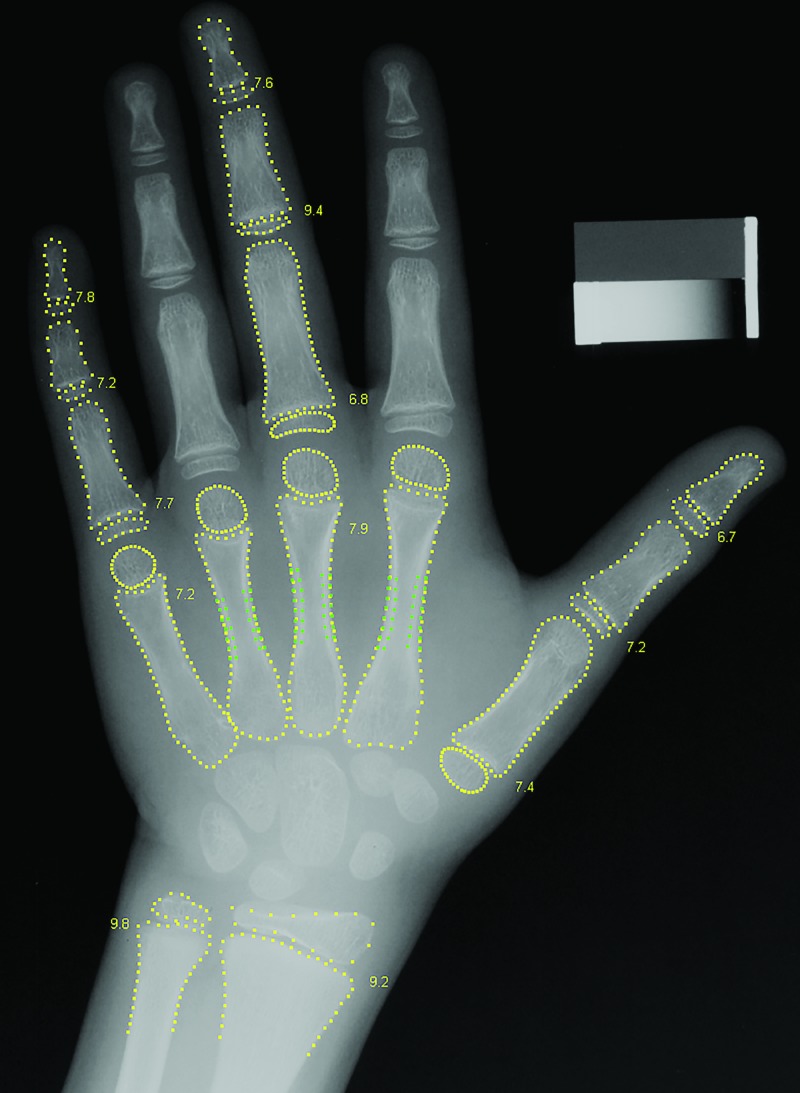
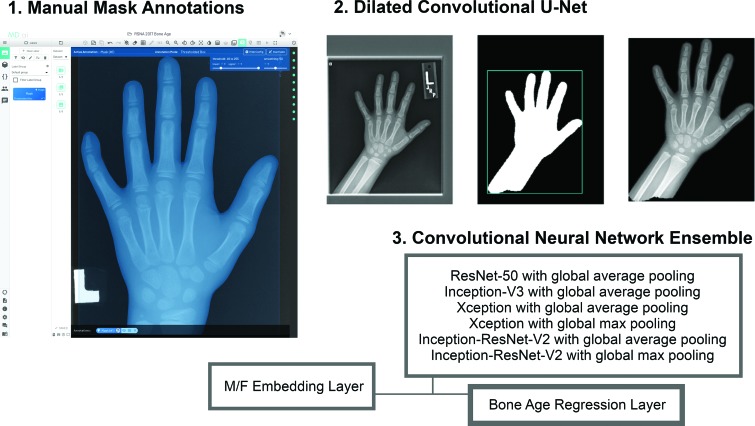
Purpose The Radiological Society of North America (RSNA) Pediatric Bone Age Machine Learning Challenge was created to show an application of machine learning (ML) and artificial intelligence (AI) in medical imaging, promote collaboration to catalyze AI model creation, and identify innovators in medical imaging. Materials and Methods The goal of this challenge was to solicit individuals and teams to create an algorithm or model using ML techniques that would accurately determine skeletal age in a curated data set of pediatric hand radiographs. The primary evaluation measure was the mean absolute distance (MAD) in months, which was calculated as the mean of the absolute values of the difference between the model estimates and those of the reference standard, bone age. Results A data set consisting of 14 236 hand radiographs (12 611 training set, 1425 validation set, 200 test set) was made available to registered challenge participants. A total of 260 individuals or teams registered on the Challenge website. A total of 105 submissions were uploaded from 48 unique users during the training, validation, and test phases. Almost all methods used deep neural network techniques based on one or more convolutional neural networks (CNNs). The best five results based on MAD were 4.2, 4.4, 4.4, 4.5, and 4.5 months, respectively. Conclusion The RSNA Pediatric Bone Age Machine Learning Challenge showed how a coordinated approach to solving a medical imaging problem can be successfully conducted. Future ML challenges will catalyze collaboration and development of ML tools and methods that can potentially improve diagnostic accuracy and patient care. © RSNA, 2018 Online supplemental material is available for this article. See also the editorial by Siegel in this issue.
Figures
Comment in
-
What Can We Learn from the RSNA Pediatric Bone Age Machine Learning Challenge?Radiology. 2019 Feb;290(2):504-505. doi: 10.1148/radiol.2018182657. Epub 2018 Dec 4. Radiology. 2019. PMID: 30615556 No abstract available.
References
-
- Larson DB, Chen MC, Lungren MP, Halabi SS, Stence NV, Langlotz CP. Performance of a deep-learning neural network model in assessing skeletal maturity on pediatric hand radiographs. Radiology 2018;287(1):313–322. - PubMed
-
- Greulich WW, Pyle SI. Radiographic atlas of skeletal development of the hand and wrist. Stanford, Calif: Stanford University Press, 1999.
-
- Kim JR, Shim WH, Yoon HM, et al. Computerized bone age estimation using deep learning based program: evaluation of the accuracy and efficiency. AJR Am J Roentgenol 2017;209(6):1374–1380. - PubMed
Publication types
MeSH terms
Grants and funding
LinkOut - more resources
Full Text Sources
Other Literature Sources
Medical
