. 2018 Nov 27:10.1038/nbt.4317.
doi: 10.1038/nbt.4317. Online ahead of print.

Predicting the mutations generated by repair of Cas9-induced double-strand breaks

Affiliations

Predicting the mutations generated by repair of Cas9-induced double-strand breaks

Felicity Allen et al. Nat Biotechnol. .

Abstract

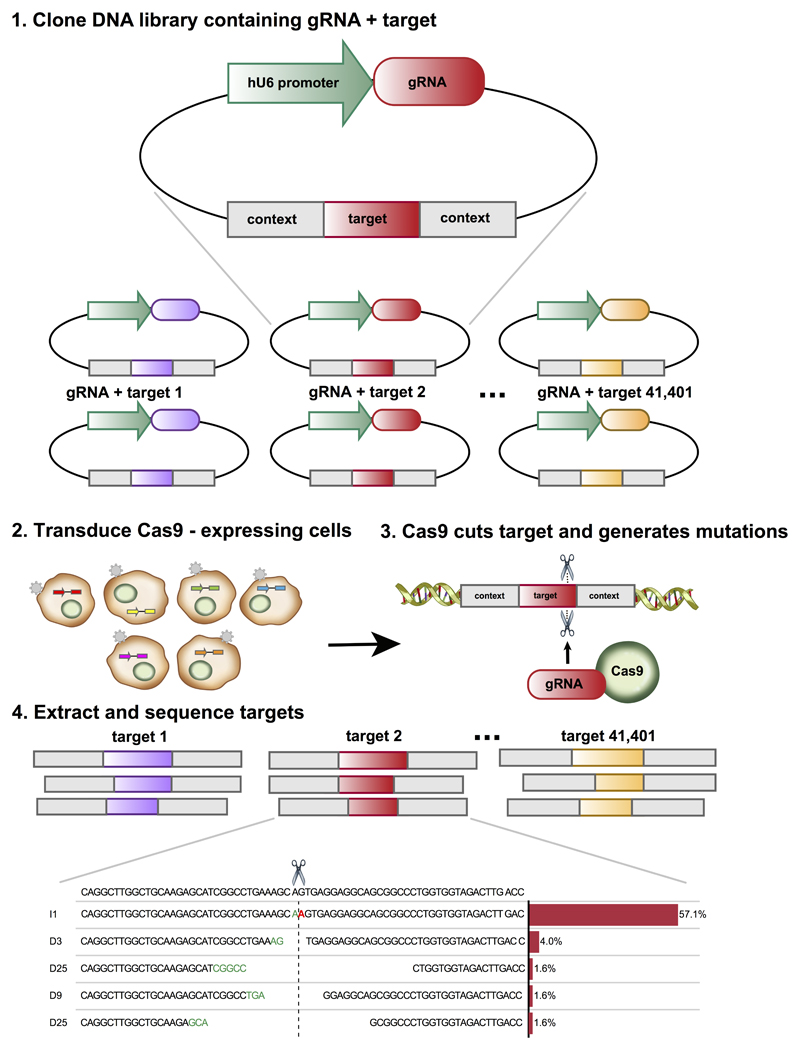
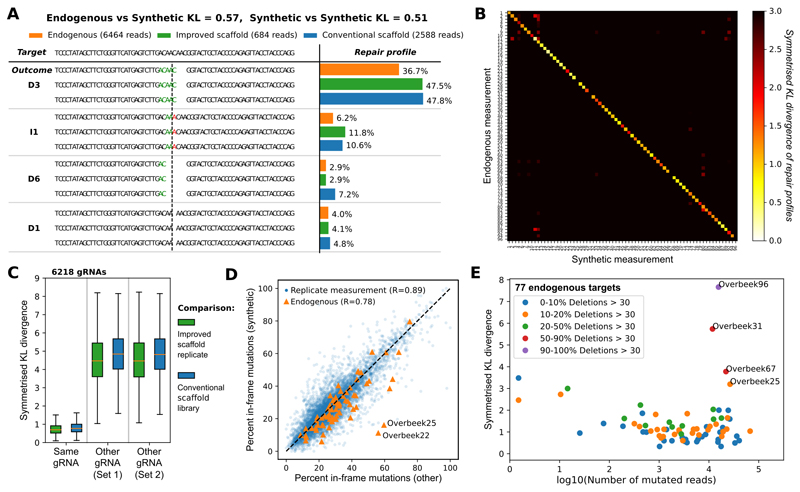
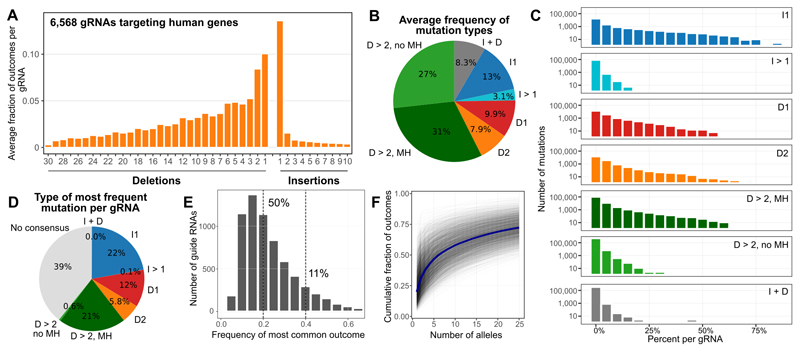
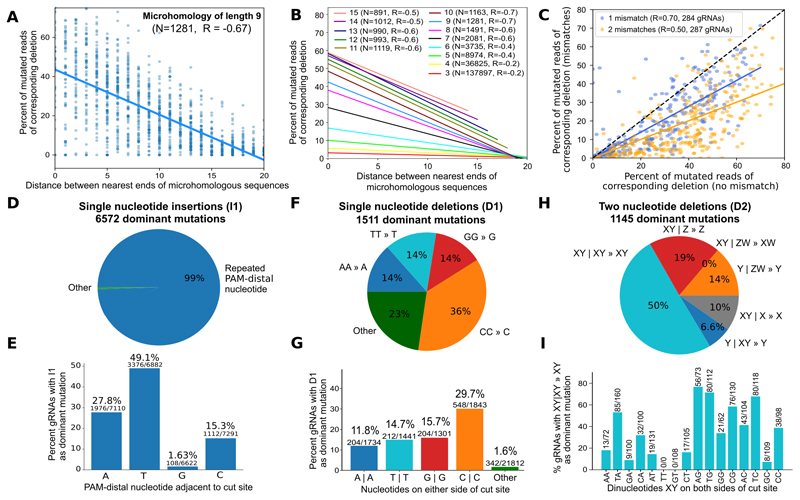
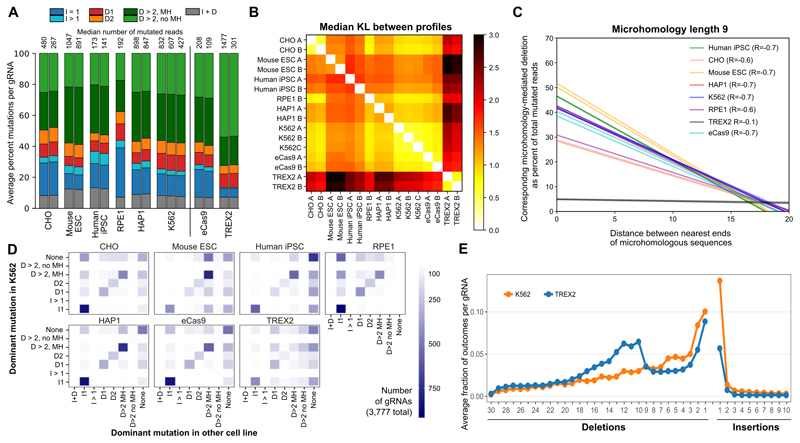
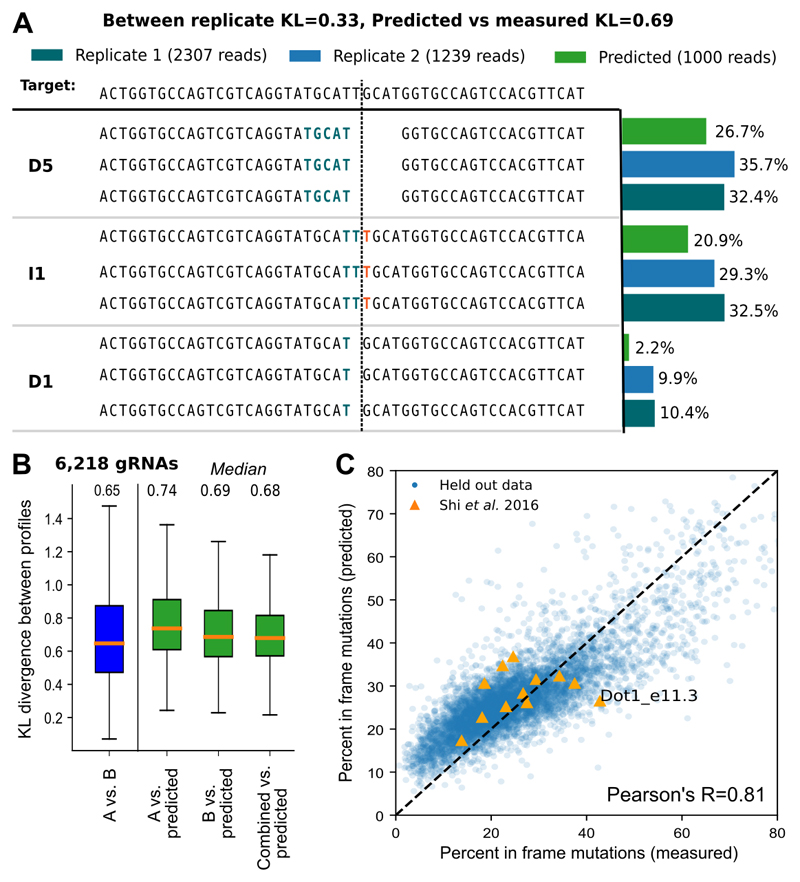
The DNA mutation produced by cellular repair of a CRISPR-Cas9-generated double-strand break determines its phenotypic effect. It is known that the mutational outcomes are not random, but depend on DNA sequence at the targeted location. Here we systematically study the influence of flanking DNA sequence on repair outcome by measuring the edits generated by >40,000 guide RNAs (gRNAs) in synthetic constructs. We performed the experiments in a range of genetic backgrounds and using alternative CRISPR-Cas9 reagents. In total, we gathered data for >109 mutational outcomes. The majority of reproducible mutations are insertions of a single base, short deletions or longer microhomology-mediated deletions. Each gRNA has an individual cell-line-dependent bias toward particular outcomes. We uncover sequence determinants of the mutations produced and use these to derive a predictor of Cas9 editing outcomes. Improved understanding of sequence repair will allow better design of gene editing experiments.


Conflict of interest statement

Competing Financial Interests

The authors declare no competing financial interests.

Figures

Figure 1
Figure 1. Mutational profiles generated by CRISPR/Cas9, and a method for their high-throughput measurement.
High throughput measurement of repair outcomes. Constructs containing both a gRNA and its target sequence (matched colors) in variable context (grey boxes) are cloned en masse into target vectors containing a human U6 promoter (green) (1), packaged into lentiviral particles, and used to infect cells (2), where they generate mutations at the target (3). DNA from the cells is extracted, the target sequence in its context amplified with common primers, and the repair outcomes (location, size, and sequence of mutation) determined by deep short read sequencing (4).
Figure 2
Figure 2. Synthetic mutational profiles are reproducible, specific to individual gRNAs and closely resemble endogenously measured profiles in human K562 cells.
A. Example of measured repair profile reproducibility for one gRNA-target pair. DNA sequence of the target (top) is edited to produce a range of synthetic outcomes that employ the improved gRNA scaffold (green bars) and conventional gRNA scaffold (blue bars), contrasted to endogenous measurements (orange bars). The proportions (x-axis) of the four most frequent mutational outcomes (e.g. “D3” - deletion of three base pairs depicted, “I1” - insertion of a single “A” at cut site, etc.; y-axis) is consistent between the experiments. Stretches of microhomology (green) and inserted sequences (red) are highlighted at the cut site (dashed vertical line). B. Synthetic measurements faithfully capture endogenous outcomes. Symmetrized Kullback-Leibler divergence (white to black color scale) between synthetic repair profile measurements in K562 cells (x-axis) and endogenous repair profiles from van Overbeek et al. (y-axis; at least 100 reads in our synthetic samples). C. Synthetic measurements are reproducible and gRNA-specific, irrespective of gRNA scaffold used. Box plots (orange median line, quartiles for box edges, 95% whiskers) of symmetrised KL divergences between two measurements of the same target (left), or between measurements of randomly selected target pairs from the same set (middle, right). Green boxes: comparison of biological replicates of the same library using the improved scaffold; blue boxes: comparison of matched measurements between libraries employing the conventional scaffold, and the improved scaffold; median mutated read numbers per gRNA in parentheses. The 6,218 gRNAs used are from the “Conventional Scaffold gRNA-Targets” set (Online Methods); improved scaffold is used throughout the rest of the paper. D. Frame information is reproducible between replicates, and well correlated with endogenous outcomes. Blue markers: Percentage of in-frame outcomes in our synthetic measurements (y-axis) contrasted against another biological replicate (x-axis; Pearson’s R=0.89, gRNAs as in C, improved scaffold only). Orange markers: same, but contrasting information from combined synthetic replicates (y-axis) against 68 endogenous measurements (x-axis; Pearson’s R=0.78, gRNAs as in B, excluding four with majority of large deletions not captured in our assay). E. Low coverage and large deletions are the main sources of discrepancy between endogenous and synthetic measurements. Symmetrized KL divergence (y-axis) between endogenous and synthetic measurements of editing outcomes (individual markers; gRNAs as in B) is dependent on the sequencing coverage (log10(number of obtained reads), x-axis), and frequency of very large deletions (colors). Three target sequences that frequently give rise to very large deletions (red, purple) are not well captured by our assay design.
Figure 3
Figure 3. Mutational profiles are diverse and biased in K562 cells, as measured using 6,568 gRNAs with a median 991 sequenced reads with mutations per target.
A. Single base insertions are most common, with a long tail of moderately long deletions. The frequency (y-axis) of deletion or insertion size (x-axis), averaged across sequence targets present in the genome. B. Editing outcome types are diverse. The percent occurrence per gRNA (area of wedge) of 1nt insertions (I1, blue), larger insertions (I > 1, teal), single base deletions (D1, red), dinucleotide deletions (D2, orange), larger deletions likely mediated by microhomology (D > 2, MH; dark green), other larger deletions (D > 2, no MH; light green), and more complex alleles (I + D, grey), measured in K562 cells, and averaged across genomic sequence targets. C. Per-gRNA event frequencies differ across indel classes. Number of individual indels (y-axis, log10-scale) as a percentage of all mutations observed for their gRNA (x-axis) separated by mutation class (rows). Colors as in (B). D. Specific single base insertions and microhomology-mediated deletions are the most frequent reproducible mutation classes. The percent of gRNAs (area of wedge) that have the same specific allele as their most frequent mutation in all three replicates, stratified by indel class (colors). ‘No consensus’: inconsistent most frequent mutation across replicates. E. A single allele can account for a large fraction of editing outcomes for a gRNA. Number of gRNAs (y-axis) with the frequency of its most common outcome (x-axis) in K562 cells. F. A small number of outcomes explains most of the observed data, but many low frequency alleles are present. Cumulative fraction of observed data (y-axis) matching an increasing number of outcomes (x-axis) for each target in K562 cells (grey lines), and their average (blue line).
Figure 4
Figure 4. Local sequence context strongly influences editing outcomes in the explorative set of gRNA-target pairs.
A. Nearby matching sequences are used as substrate for microhomology-mediated repair more frequently than distant ones. Fraction of mutated reads (y-axis) for increasing distance between 1,281 matching sequences of length 9 (x-axis) (blue markers) in K562 cells, and a linear regression fit to the trend (solid line; Pearson's R=-0.67). Reproducibility of measurements is presented in Figure 5C. B. Frequency of microhomology-mediated repair depends on the length of and distance between the matching sequences. Same as (A), but linear regression fits only for microhomologies of lengths 3 (red, bottom) to 15 (pink, top), with the number of pairs of matching sequences considered (N) and Pearson’s correlation (R) noted in the legend. C. Mutations in microhomology sequence reduce repair outcome frequency, but corresponding deletions are still present. The fraction of mutated reads associated with the particular microhomology with mismatches (y-axis) vs without mismatches (x-axis) stratified by the number of mismatches (blue: one mismatch, yellow: two mismatches). Solid lines: linear regression fits; dashed black line: y=x; Pearson's R provided in legend. D. Single nucleotide insertions are only dominant when repeating the PAM-distal nucleotide. Percentage of the 6,572 gRNAs for which insertion of a specific nucleotide is most frequent in all replicates (“dominant allele”; area of wedge) stratified by whether the PAM-distal nucleotide adjacent to the cut site is inserted (blue), vs. all other outcomes (green). E. Insertions of thymine dominate often, while guanines are rarely inserted with reproducibly high frequency. The percentage of gRNAs that have a dominant single nucleotide insertion (y-axis), stratified by their PAM-distal nucleotide at the cut site (x-axis). F. Dominant single nucleotide deletions usually remove one nucleotide from a repeating pair at the cut site. Percentage of the 1,511 gRNAs with a dominant single nucleotide deletion (area of wedge) of a repeating A (blue), repeating T (teal), repeating G (red), repeating C (orange), or a base from a non-repeat (green). G. Dominance of single nucleotide deletions depends on both bases adjacent to the cut site. The percentage of gRNAs that have a dominant single nucleotide deletion (y-axis), stratified by the two bases on either side of the cut site (x-axis). H. Two nucleotide deletions that are dominant favour repeats. Percentage of the 1,145 gRNAs with a dominant size two deletion (area of wedge) that delete a repeat (XY | XY » XY, teal), delete PAM-distal nucleotides (XY | Z » Z, red), delete one PAM-distal and one PAM-proximal nucleotide (XY | ZW » XW, purple), delete PAM-proximal nucleotides (Y | ZW » Y, orange), delete a PAM-distal nucleotide flanked by a repeating base (XY | X » X, grey), or delete a PAM-proximal nucleotide flanked by a repeating base (Y | XY » Y, blue). X, Y, Z, W - any nucleotide; | - cut site. I. PAM-distal guanine at the cut site promotes, while PAM-distal thymine at the cut site demotes the frequency of dominant dinucleotide repeat contraction. The percentage of gRNAs with a dinucleotide repeat that have the corresponding dominant two nucleotide deletion (y-axis), stratified by the two bases in the repeated sequence (x-axis).
Figure 5
Figure 5. Differences between editing outcomes in K562-Cas9 and other cell lines and effector proteins.
A. Genetic background influences editing outcomes. Average per-gRNA frequency of different types of editing outcomes in 3,777 gRNAs (y-axis; colors as 3B) for Chinese hamster ovary cell line (CHO), mouse embryonic stem cells (Mouse ESC), human induced pluripotent stem cells (iPSCs), human retinal pigmented epithelial cells (RPE-1), human near-haploid cell line (HAP1), K562 cell line, and K562 cells with alternative Cas9 proteins: enhanced Cas9 (eCas9), and Cas9-TREX2 fusion (TREX2). Separate vertical bars are measurements from biological replicates; median number of mutated reads per gRNA is given above the bar for each replicate. B. Mutational outcomes are similar across cell lines, with consistent moderate differences in stem cells and the K562 Cas9-TREX2 fusion line. Median symmetric Kullback Leibler divergence between repair profiles (black to white color range, as in Figure 2B) in different tested lines (x and y axis). gRNAs as in A. C. Microhomology-mediated repair fidelity is similar across genetic backgrounds, but differs for Cas9-TREX2 fusion. Regression lines (as in Fig 4A) for fraction of mutated reads (y-axis) for increasing distance between matching sequences of length 9 (x-axis) in K562 cells (blue) and other tested lines (colors) in multiple replicates (individual lines), with overall Pearson’s correlation denoted in the legend. gRNAs as in Figure 4B, restricted to those 822 gRNAs with MH of length 9 and at least 20 mutated reads in all samples. D. The type of the dominant outcome per gRNA is consistent across cell lines overall, but biased towards microhomology-mediated deletions in stem cells, and I1 insertions in RPE-1 and CHO. The number of gRNAs (color) for which the most frequent indel comes from each class (x-axis) in the other cell lines examined (panels) compared to that for the same gRNA in K562 (y-axis). “None” refers to gRNAs without any indel consistently most frequent in all replicates. gRNAs as in A. RPE data is based on one replicate, K562 on three, all other cell lines on two replicates. E. Cas9-TREX2 fusion protein favours larger deletions compared to K562. Deletions of increasing size (x-axis) become more frequent (y-axis) in K562 Cas9-TREX2 cells (blue) compared to standard K562 Cas9 (orange). gRNAs as in A.
Figure 6
Figure 6. Accurate prediction of repair profiles
A. Example of a repair profile prediction with accuracy close to the test set median (KL=0.69). DNA sequence of the target (top) is edited to produce a range of outcomes in two synthetic replicates (dark green, blue bars) and the corresponding predicted outcomes (green bars). The proportions (x-axis) of the three largest mutational outcomes (“D5” - deletion of size 5 with highlighted size 5 microhomology, “I1” - insertion of a guanine at the cut site, “D1” - deletion of PAM-distal cytosine at the cut site; y-axis) is consistent between the biological replicates and the prediction. Stretches of microhomology (green) and inserted sequences (red) are highlighted at the cut site (dashed vertical line). B. Repair profiles can be predicted from sequence alone. Symmetrised Kullback-Leibler divergence (KL, y-axis) between predicted and actual repair profiles (green), as well as between biological replicates A and B (blue; x-axis), with median values denoted above. Box plots: median line with median value marked, quartile box, 95% whiskers. 6,218 gRNAs as in Figure 2C; these were not used in training or hyperparameter selection. C. Frameshift mutations can be predicted with high accuracy. Measured (x-axis) and predicted (y-axis) percent of mutations that do not produce frameshift mutations for 6,218 held-out gRNAs as in B (blue), and 12 gRNAs that were deep sequenced in (Shi et al. 2015) (orange). Dot1_e11.3 has over 90% deletions of size greater than 30 in the Shi et al sequencing data so we do not expect accurate predictions for this gRNA.

References

    1. Doudna JA, Charpentier E. Genome editing. The new frontier of genome engineering with CRISPR-Cas9. Science. 2014;346 1258096. - PubMed
    1. Chiruvella KK, Liang Z, Wilson TE. Repair of Double-Strand Breaks by End Joining. Cold Spring Harb Perspect Biol. 2013;5 a012757–a012757. - PMC - PubMed
    1. Her J, Bunting SF. How cells ensure correct repair of DNA double-strand breaks. J Biol Chem. 2018;293:10502–10511. - PMC - PubMed
    1. Truong LN, et al. Microhomology-mediated End Joining and Homologous Recombination share the initial end resection step to repair DNA double-strand breaks in mammalian cells. Proc Natl Acad Sci U S A. 2013;110:7720–7725. - PMC - PubMed
    1. Shibata A. Regulation of repair pathway choice at two-ended DNA double-strand breaks. Mutat Res. 2017;803–805:51–55. - PubMed