. 2019 Feb 1;129(2):676-693.
doi: 10.1172/JCI120279. Epub 2019 Jan 14.

Splicing factor SRSF1 promotes gliomagenesis via oncogenic splice-switching of MYO1B

Affiliations

Splicing factor SRSF1 promotes gliomagenesis via oncogenic splice-switching of MYO1B

Xuexia Zhou et al. J Clin Invest. .

Abstract

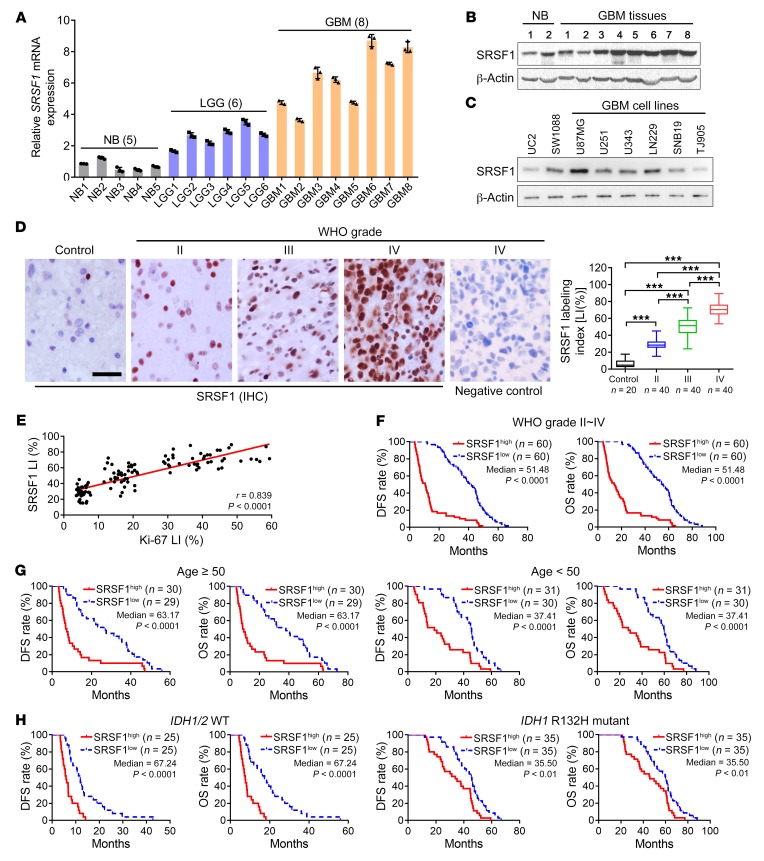
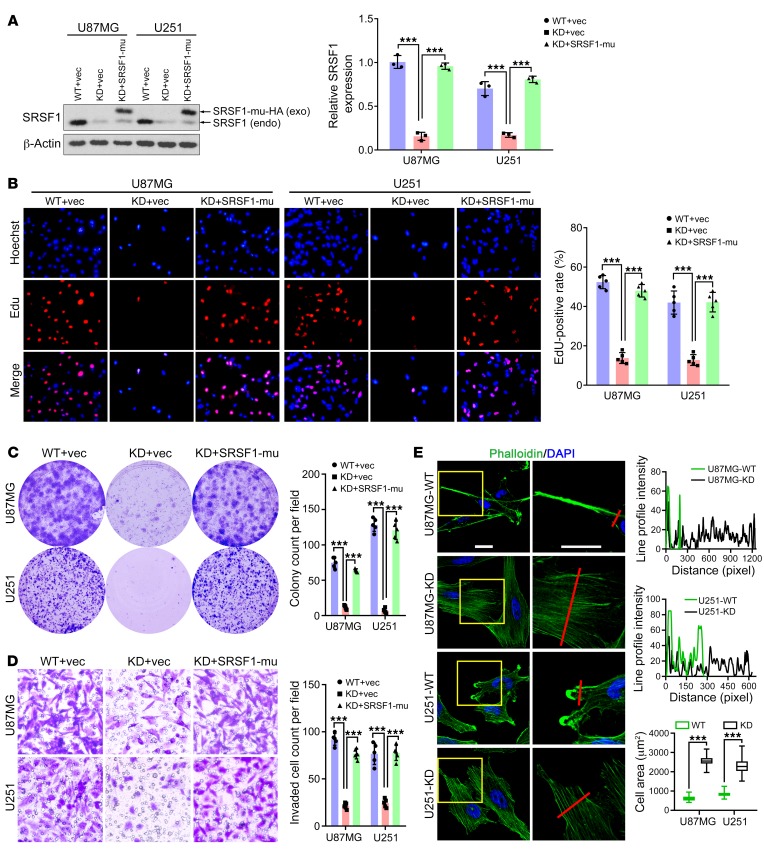
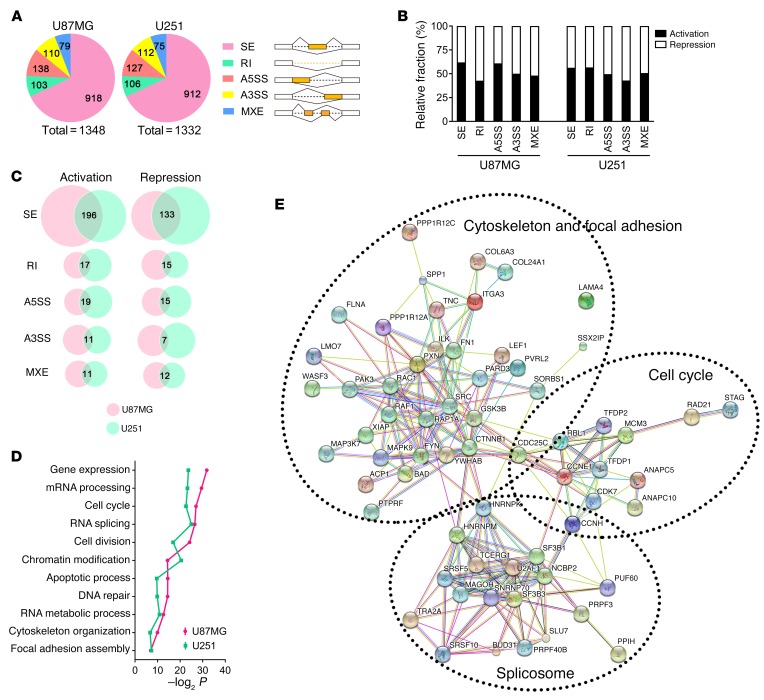
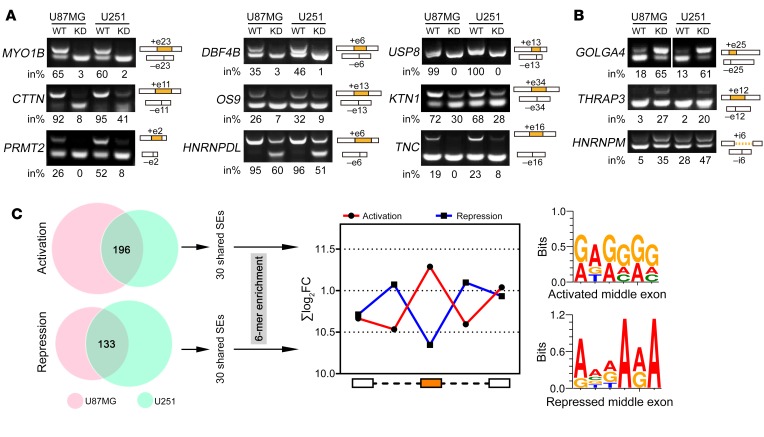
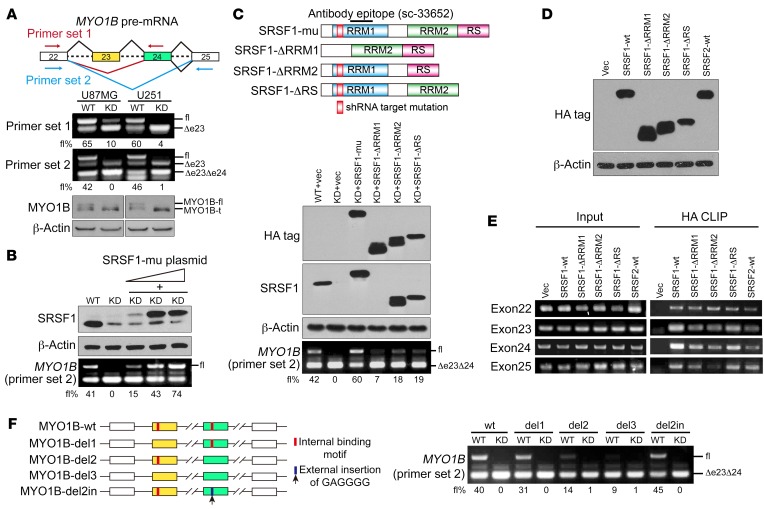
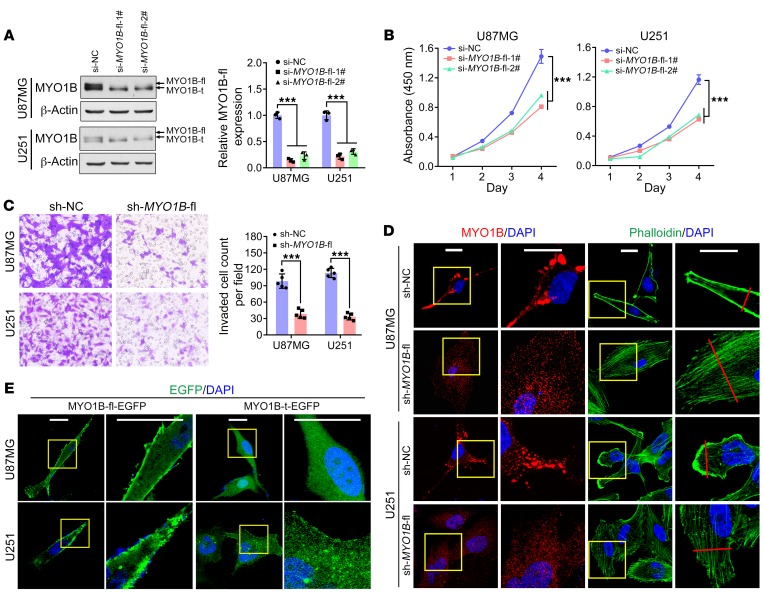
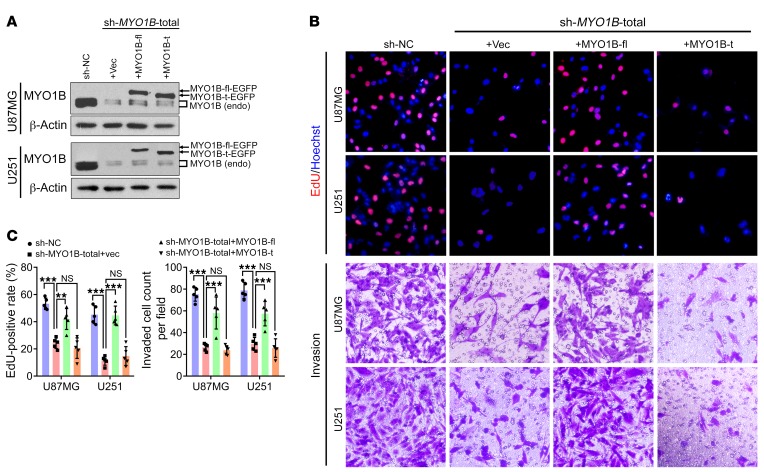
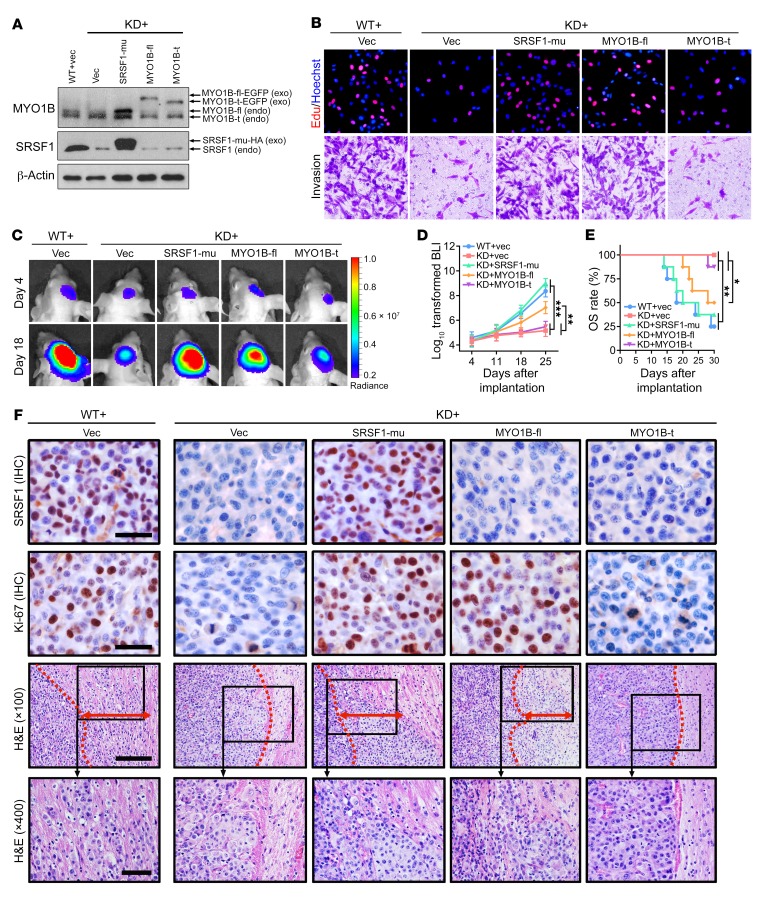
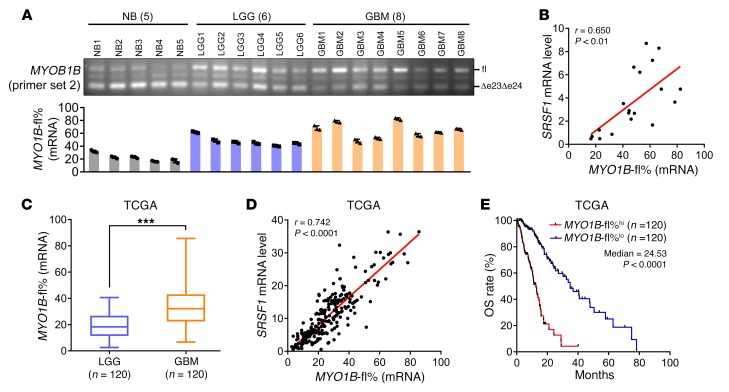
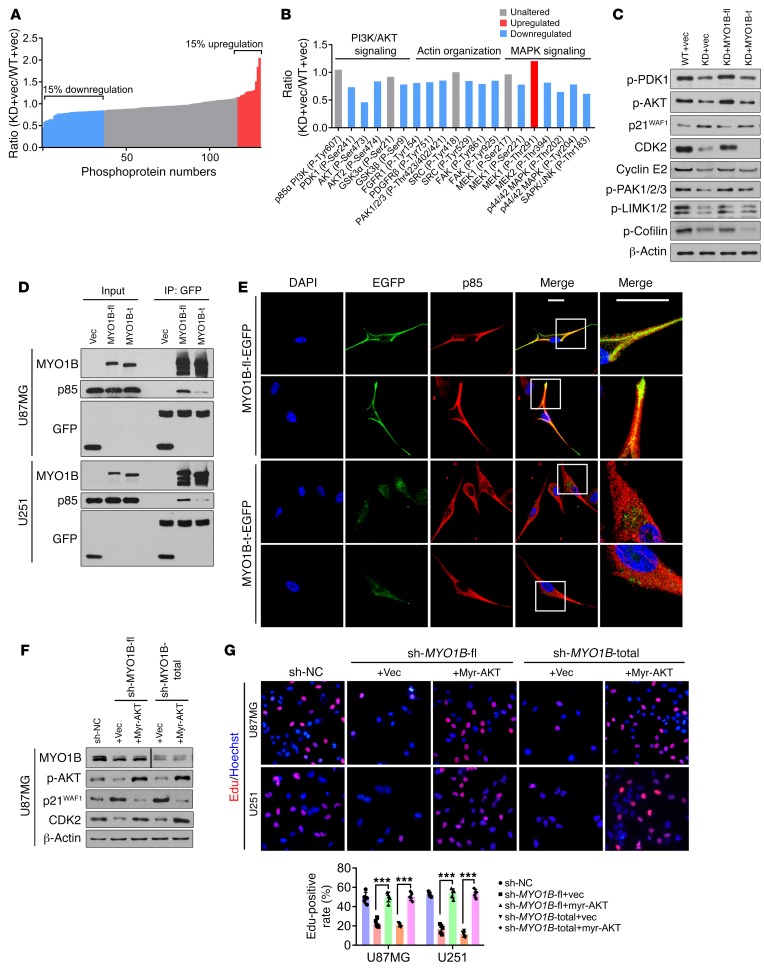
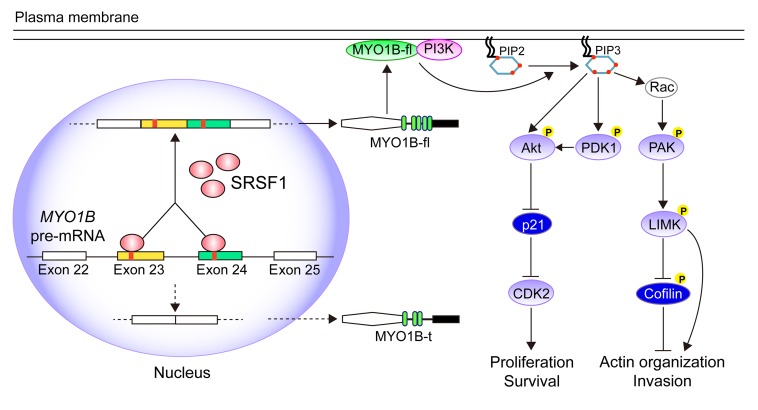
Abnormal alternative splicing (AS) caused by alterations to splicing factors contributes to tumor progression. Serine/arginine splicing factor 1 (SRSF1) has emerged as a key oncodriver in numerous solid tumors, leaving its roles and mechanisms largely obscure in glioma. Here, we demonstrate that SRSF1 is increased in glioma tissues and cell lines. Moreover, its expression was correlated positively with tumor grade and Ki-67 index, but inversely with patient survival. Using RNA-Seq, we comprehensively screened and identified multiple SRSF1-affected AS events. Motif analysis revealed a position-dependent modulation of AS by SRSF1 in glioma. Functionally, we verified that SRSF1 promoted cell proliferation, survival, and invasion by specifically switching the AS of the myosin IB (MYO1B) gene and facilitating the expression of the oncogenic and membrane-localized isoform, MYO1B-fl. Strikingly, MYO1B splicing was dysregulated in parallel with SRSF1 expression in gliomas and predicted the poor prognosis of the patients. Further investigation revealed that SRSF1-guided AS of the MYO1B gene increased the tumorigenic potential of glioma cells through the PDK1/AKT and PAK/LIMK pathways. Taken together, we identify SRSF1 as an important oncodriver that integrates AS control of MYO1B into promotion of gliomagenesis and represents a potential prognostic biomarker and target for glioma therapy.

Keywords: Brain cancer; Cell Biology; Oncology; RNA processing.


Conflict of interest statement

Conflict of interest: The authors have declared that no conflict of interest exists.

Figures

Figure 1
Figure 1. SRSF1 overexpression is correlated with excessive glioma cell proliferation and predicts poor prognoses of glioma patients.
(A) Relative SRSF1 mRNA levels in glioma tissues as detected by qRT-PCR. The mean of the normal brain (NB) group was arbitrarily set to 1.0. Data are presented as mean ± SD, n = 3. (B and C) Western blot of SRSF1. The expression levels of SRSF1 were compared between GBM tissues and NBs (B), as well as among the GBM cell lines, UC2 (an immortal astrocyte cell line) and SW1088 (an anaplastic astrocytoma cell line, WHO grade III) (C). Loading control: β-actin. (D) Left: IHC staining of SRSF1 in control (nontumoral brain tissues) and glioma tissues. The negative control was established by using PBS as a substitute for the primary antibody. Scale bar: 20 μm. Right: Comparison of SRSF1 expression levels among 20 NB tissues and 120 gliomas of various grades. The expression levels are represented by labeling indexes (LIs [%]), which were calculated with Leica Image Pro Plus 5.0 software as the percentage of total cells that were positive cells. Data are presented as box plots. Boxes represent the 25th and 75th percentiles, lines represent the median, and whiskers show the minimum and maximum points. ***P < 0.001 by 1-way ANOVA with Tukey’s post test. (E) Pearson correlation analysis between the LIs of SRSF1 and Ki-67 in the glioma samples (n = 120). Pearson correlation test, r and P values are shown. (FH) Kaplan-Meier analyses of the DFS and OS of all glioma patients (F) and patients of similar age (G) and identical IDH1/2 gene status (H). Patients were stratified into high- and low-expression groups using the medians of the SRSF1 LIs of the corresponding cohorts as cutoffs. The P values of the log-rank (Mantel-Cox) tests are presented.
Figure 2
Figure 2. SRSF1 increases the tumorigenic abilities of GBM cells and induces reorganization of the cytoskeleton.
(A) Western blot of endogenous (endo) SRSF1 and exogenous (exo) SRSF1-mu (HA-tagged product of the SRSF1 synonymous mutant) in the extracts of cells as indicated. Loading control: β-actin. (B) Images of EdU staining (left) and the comparison of EdU-positive rates among the indicated cells (right). (C) Colony formation assay results. (D) Transwell invasion assay results. Original magnification (B and D), ×400. (E) Left: The cytoskeleton was labeled with Phalloidin (green), and cell nuclei were counterstained with DAPI. Scale bar: 20 μm. Right: Green fluorescence (Phalloidin) intensities were profiled along the red lines (upper and middle panels). Cell areas were compared between the WT and the KD sub–cell lines. Data are presented as box plots, n = 300. ***P < 0.001 by 2-tailed Student’s t test (bottom panel). Data in AD are presented as mean ± SD, n = 3 for A and n = 5 for BD. ***P < 0.001 by 1-way ANOVA with Dunnett’s post test. Representative images from biological triplicate experiments are shown for BE.
Figure 3
Figure 3. Global profiles of SRSF1-affected AS in GBM cells.
(A) SRSF1-affected AS events in U87MG (left) and U251 (right) cell lines. The AS events are classified into 5 categories: skipped exon (SE), retained intron (RI), alternative 5′ splice site (A5SS), alternative 3′ splice site (A3SS), and mutually exclusive exon (MXE). (B) Relative fraction of AS events affected positively (activation) or negatively (repression) by SRSF1 in each category. (C) Overlapping AS events in each category of the activation/repression groups between U87MG and U251 cell lines. (D) Gene ontology of the common AS targets shared by U87MG and U251 cell lines. Fisher’s exact P values (–log2 transformed) are plotted for each enriched functional category. (E) Functional association network of the SRSF1-affected AS targets. Genes incorporated in D were analyzed using the STRING database, and the subgroups are marked according to their functions.
Figure 4
Figure 4. Validation and motif discovery of SRSF1-mediated AS in GBM cells.
(A and B) RT-PCR validation of SRSF1-affected AS events. Representative images from 3 independent experiments are presented. The structure of each PCR product is indicated schematically on the right. Alternative exons/introns affected by SRSF1 are painted in orange. The 4 lanes for GOLGA4 (B) are on the same gel but noncontiguous. The percentage of total products that were exon or intron inclusion products (in%) are provided below each gel. (C) Left: Flowchart of SRSF1 motif discovery from the RNA-Seq data. Right: The sum of the log2-transformed fold change (FC) of the GA-rich 6-mers overrepresented within the 5 regions around the regulated cassette exons is compared with that around the control cassette exons. The red line represents SRSF1-mediated cassette exon activation, and the blue line represents SRSF1-mediated cassette exon repression. Potential SRSF1 motifs derived from the 6-mers overrepresented in the activated or repressed cassette exons are also given.
Figure 5
Figure 5. SRSF1 mediates inclusion of exons 23 and 24 in MYO1B pre-mRNA.
(A) Top: Diagram of the splicing variants of MYO1B mRNA and the primers for RT-PCR detection of exon 23 (primer set 1) and exons 23 and 24 (primer set 2) inclusion/exclusion. Bottom: AS of exon 23 (primer set 1) and exons 23 and 24 (primer set 2) and expression of MYO1B isoforms were examined by RT-PCR and Western blot, respectively. (B) Western blot of SRSF1 and the corresponding results of RT-PCR of MYO1B mRNA fragments (primer set 2). (C) Top: Schematic diagram of SRSF1 domains and construction of 3 SRSF1 mutants: ΔRRM1 (deleted RRM1), ΔRRM2 (deleted RRM2), ΔRS (deleted RS). All mutants were HA tagged. Bottom: Western blot of endogenous and exogenous SRSF1 with anti-HA and anti-SRSF1 antibodies. AS of exons 23 and 24 was detected by RT-PCR (primer set 2). (D) Western blot of exogenous SRSF1 and its mutants using anti–HA tag antibody. (E) Direct binding between indicated proteins and endogenous MYO1B RNA fragments was verified by CLIP. (F) Left: Schematic diagram of the MYO1B minigene with the potential SRSF1-binding sites marked in red. MYO1B splicing reporters with the indicated deletion (del1-del3) or insertion (del2in) were generated. Right: Splicing of the MYO1B minigene and the reporters was verified by RT-PCR (primer set 2). The percentages of MYO1B-fl within the total MYO1B transcripts are presented using fl% in AC and F.
Figure 6
Figure 6. MYO1B-fl promotes GBM malignancy, and MYO1B isoforms differ in subcellular localization.
(A) Endogenous MYO1B-fl was efficiently knocked down in U87MG and U251 cells by MYO1B-fl siRNA (si-MYO1B-fl-1#, si-MYO1B-fl-2#) transfection, as verified by Western blot. Loading control: β-actin. (B) Growth curves of U87MG and U251 cells transfected with the siRNAs as indicated. (C) Transwell invasion assay results. Original magnification, ×400. (D) Fluorescence images of the cells as indicated. MYO1B was stained by immunofluorescence (red) and the cytoskeleton was labeled by phalloidin (green). Cell nuclei were counterstained with DAPI (blue). Scale bars: 20 μm. (E) Subcellular distribution of EGFP-fused MYO1B. Cell nuclei were counterstained with DAPI (blue). Scale bars: 20 μm. Data in AC are presented as mean ± SD, n = 3 for A and n = 5 for B and C. ***P < 0.001 by 1-way ANOVA with Dunnett’s post test for A and B, 2-tailed Student’s t test for C. Representative images from triplicate biological experiments are shown for C and D.
Figure 7
Figure 7. MYO1B isoforms differ in their biological functions.
(A) Western blot of endogenous MYO1B and exogenous MYO1B-fl/t expression. MYO1B was knocked down by the specific shRNA (sh-MYO1B-total) in U87MG and U251 cells, and the EGFP-fused full-length and truncated isoforms were overexpressed individually. Loading control: β-actin. (B and C) Images of EdU staining and Transwell invasion assays (B) and the statistical analysis results (C). Representative images from triplicate biological experiments are shown for B. Data in C are presented as mean ± SD, n = 5. **P < 0.01; ***P < 0.001 by 1-way ANOVA with Dunnett’s post test. Original magnification, ×400.
Figure 8
Figure 8. MYO1B-fl partially recapitulates the SRSF1-mediated tumor-promoting phenotypes in GBM cells.
(A) Western blot of endogenous and exogenous MYO1B and SRSF1 in U87MG cells. Loading control: β-actin. (B) EdU staining and Transwell invasion assays of U87MG cells as indicated. Representative images from triplicate biological experiments are shown. Original magnification, ×400. (C) Bioluminescence images of the intracranial glioma xenografts formed by the indicated U87MG cells. Images of representative mice are shown. (D) Bioluminescence quantification results at days 4, 11, 18, and 25 after implantation (n = 8 for each group). Data are presented as mean ± SD. **P < 0.01; ***P < 0.001 by 1-way ANOVA with Dunnett’s post test. (E) Kaplan-Meier analysis of the OS of the glioma-bearing nude mice. **P < 0.01 for the difference of WT+vec vs. KD+vec, KD+SRSF1-mu vs. KD+vec, WT+vec vs. KD+MYO1B-t, and KD+SRSF1-mu vs. KD+MYO1B-t; *P < 0.05 for the difference of KD+MYO1B-fl vs. KD+vec and KD+MYO1B-fl vs. KD+MYO1B-t by the log-rank (Mantel-Cox) test. (F) IHC of SRSF1 and Ki-67 in outgrowing tumor slices and H&E staining images showing the junctions between glioma xenografts and surrounding brain tissues. Red dotted lines outline the boundaries of the tumors, and red double-sided arrows indicate invasion distances. Scale bars for IHC: 20 μm. Scale bars for H&E: 100 μm (×100) and 50 μm (×400). Images of representative tumors are shown.
Figure 9
Figure 9. AS of MYO1B is correlated with SRSF1 levels and predicts poor prognoses.
(A) Splicing pattern of MYO1B in glioma tissues as detected by RT-PCR (primer set 2). MYO1B-fl% is presented as mean ± SD, n = 3. (B) Pearson correlation analysis between SRSF1 mRNA levels and MYO1B-fl% in tissue samples (n = 19) as indicated in (A); r and P values by Pearson correlation test are presented. (C) Comparison of MYO1B-fl% between LGGs (n = 120) and GBMs (n = 120) using TCGA RNA-Seq data. ***P < 0.001 by 2-tailed Student’s t test. (D) Pearson correlation analysis between SRSF1 mRNA levels and MYO1B-fl% using the above TCGA data (n = 240). Pearson correlation test, r and P values are presented. (E) Kaplan-Meier analysis of the OS of the above patients in TCGA database. Patients were stratified into high and low expression subgroups using the median of MYO1B-fl% as the cutoff. P < 0.0001 by log-rank (Mantel-Cox) test.
Figure 10
Figure 10. SRSF1-guided MYO1B splicing determines cell fate through the PDK1/AKT and PAK/LIMK pathways.
(A and B) Phosphoproteome array analysis of the expression changes of phosphoproteins upon SRSF1 knockdown in U87MG cells. The levels of the individual proteins were normalized to total protein levels. Phosphoproteins whose levels increased or decreased by more than 15% were labeled red and blue, respectively. (C) Western blot of the indicated proteins in the extracts of U87MG cells. (D) Co-IP confirmation of the interaction between EGFP-fused MYO1B proteins (MYO1B-fl and MYO1B-t) and endogenous p85 PI3K in U87MG and U251 cells. (E) Subcellular distribution of exogenous MYO1B-fl or MYO1B-t (green) and endogenous p85 PI3K (red) in U87MG cells. Scale bar: 20 μm. Representative images from triplicate biological experiments are shown. (F) Western blot of the indicated proteins in U87MG cells. The lanes for MYO1B were on the same gel but noncontiguous. (G) Representative images of EdU staining from triplicate biological experiments (left) and quantification (right). Original magnification, ×400. Data are presented as mean ± SD, n = 5. ***P < 0.001 by 1-way ANOVA with Tukey’s post test.
Figure 11
Figure 11. Schematic illustration of the molecular pathways by which SRSF1 promotes gliomagenesis by regulating the AS of MYO1B pre-mRNA.

Similar articles

Cited by

References

    1. David CJ, Manley JL. Alternative pre-mRNA splicing regulation in cancer: pathways and programs unhinged. Genes Dev. 2010;24(21):2343–2364. doi: 10.1101/gad.1973010. - DOI - PMC - PubMed
    1. Matlin AJ, Clark F, Smith CW. Understanding alternative splicing: towards a cellular code. Nat Rev Mol Cell Biol. 2005;6(5):386–398. doi: 10.1038/nrm1645. - DOI - PubMed
    1. Wang Z, Burge CB. Splicing regulation: from a parts list of regulatory elements to an integrated splicing code. RNA. 2008;14(5):802–813. doi: 10.1261/rna.876308. - DOI - PMC - PubMed
    1. Oltean S, Bates DO. Hallmarks of alternative splicing in cancer. Oncogene. 2014;33(46):5311–5318. doi: 10.1038/onc.2013.533. - DOI - PubMed
    1. Srebrow A, Kornblihtt AR. The connection between splicing and cancer. J Cell Sci. 2006;119(pt 13):2635–2641. - PubMed

Publication types

MeSH terms