. 2018 Nov 27;14(11):e1006569.
doi: 10.1371/journal.pcbi.1006569. eCollection 2018 Nov.

Modeling craniofacial development reveals spatiotemporal constraints on robust patterning of the mandibular arch

Affiliations

Modeling craniofacial development reveals spatiotemporal constraints on robust patterning of the mandibular arch

Lina Meinecke et al. PLoS Comput Biol. .

Abstract

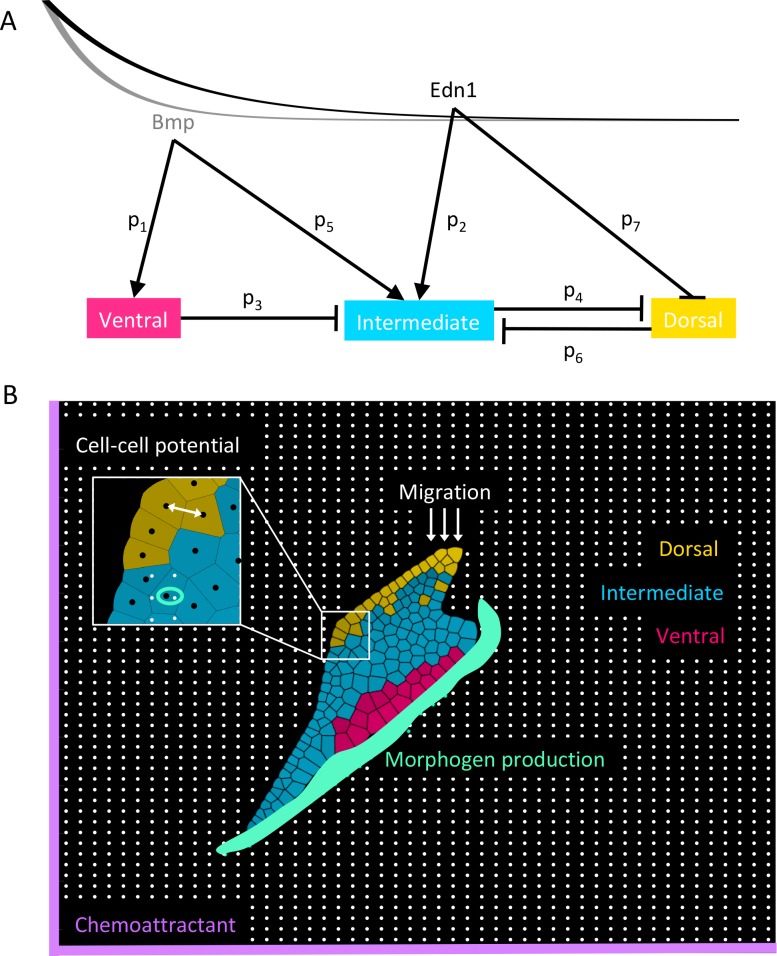
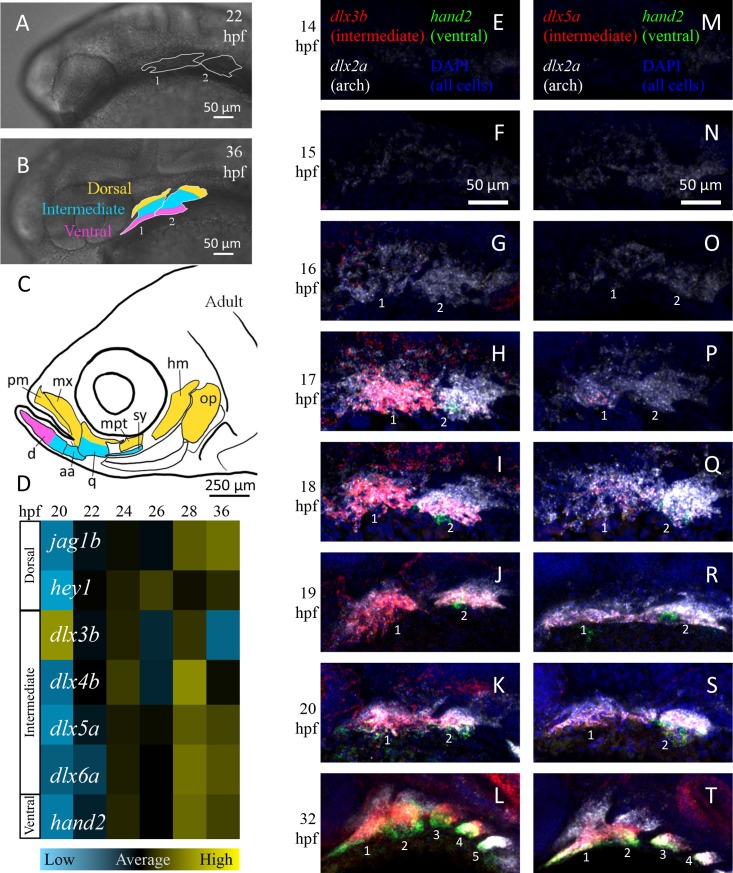
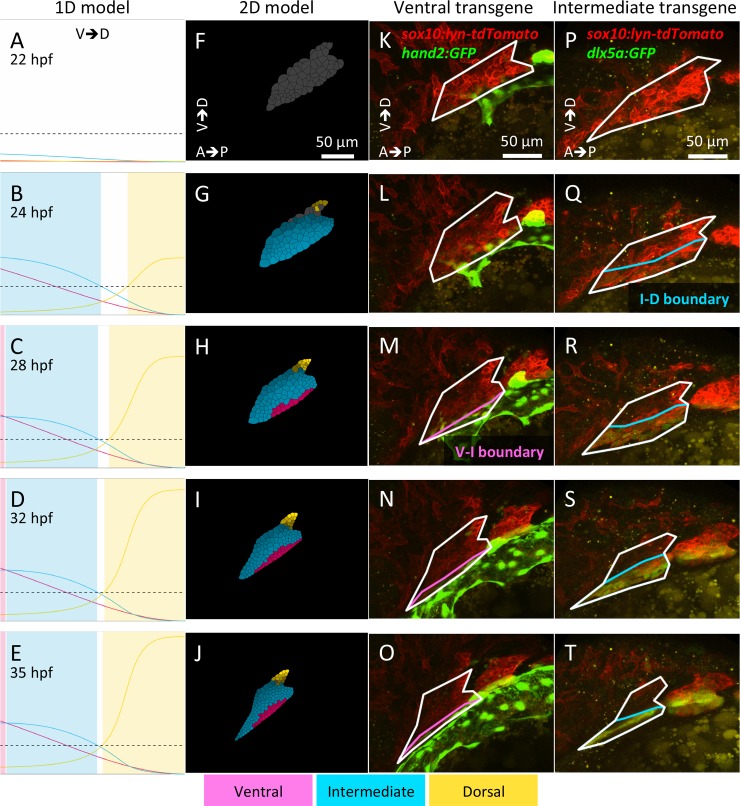
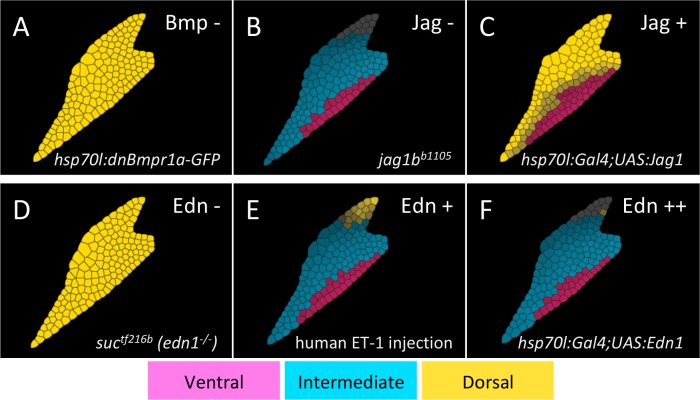
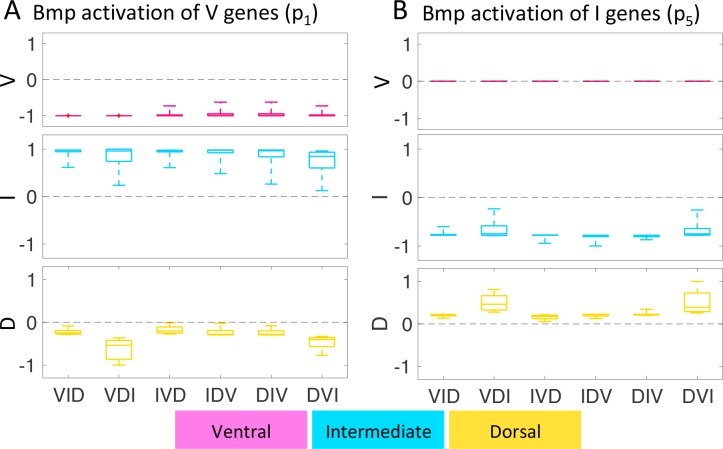
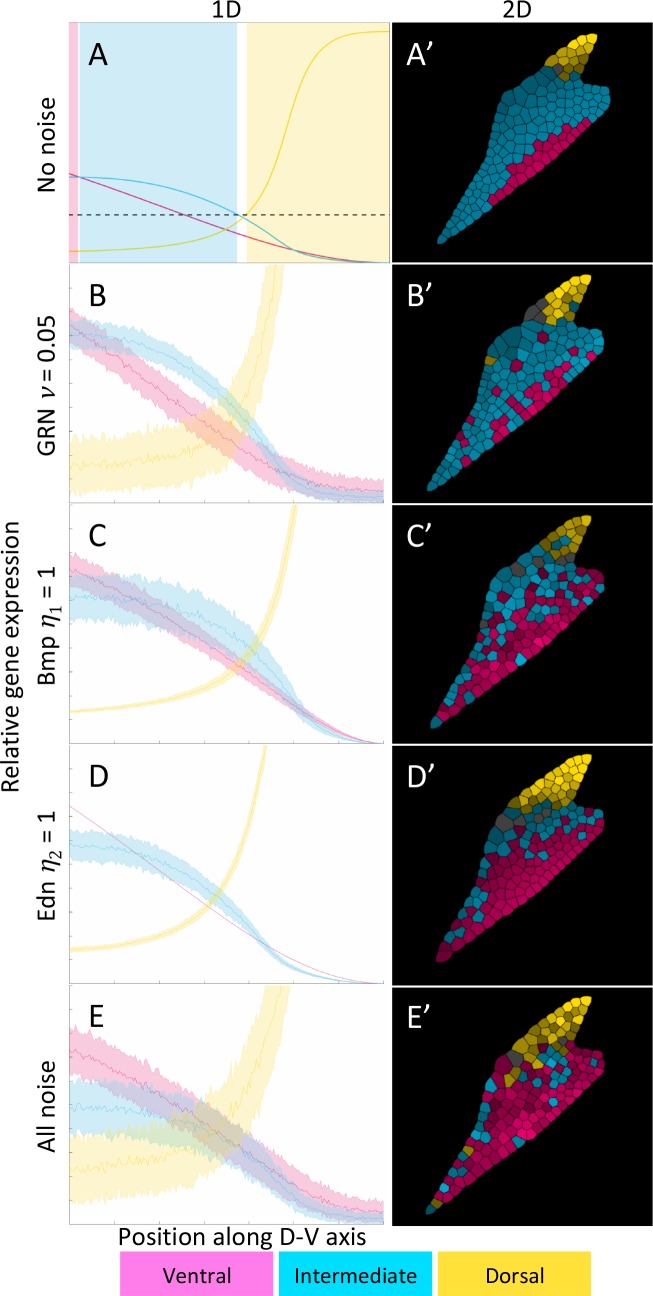
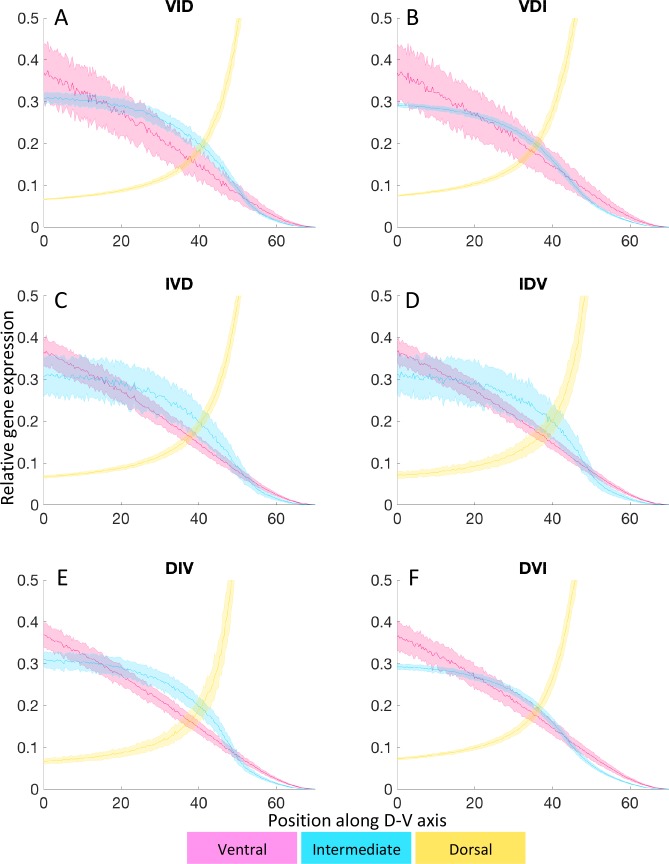
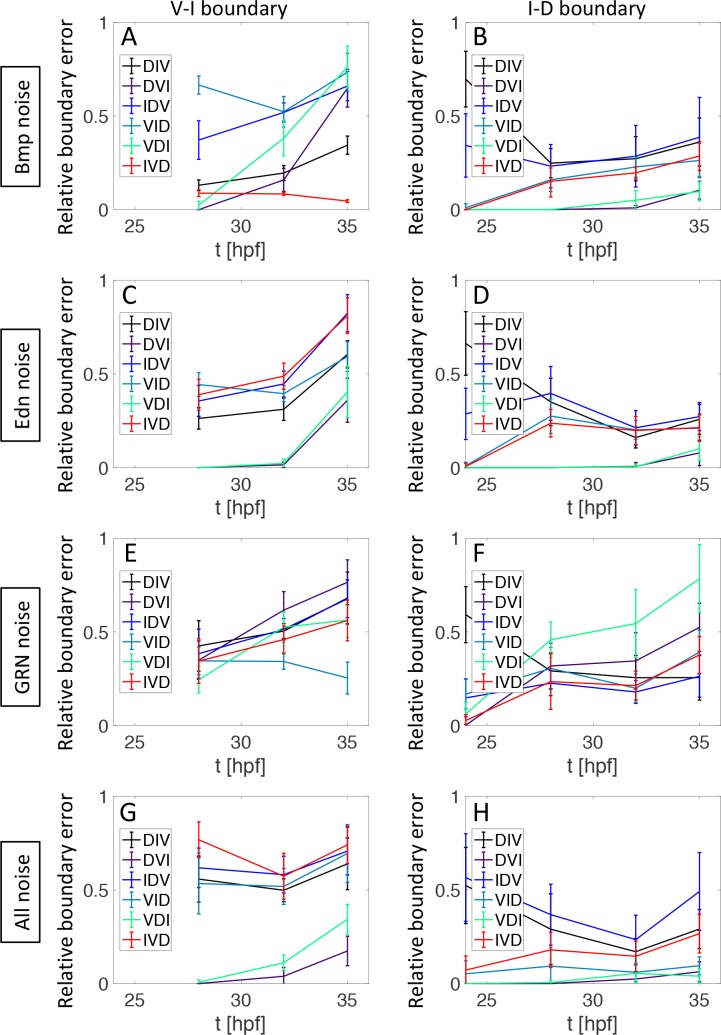
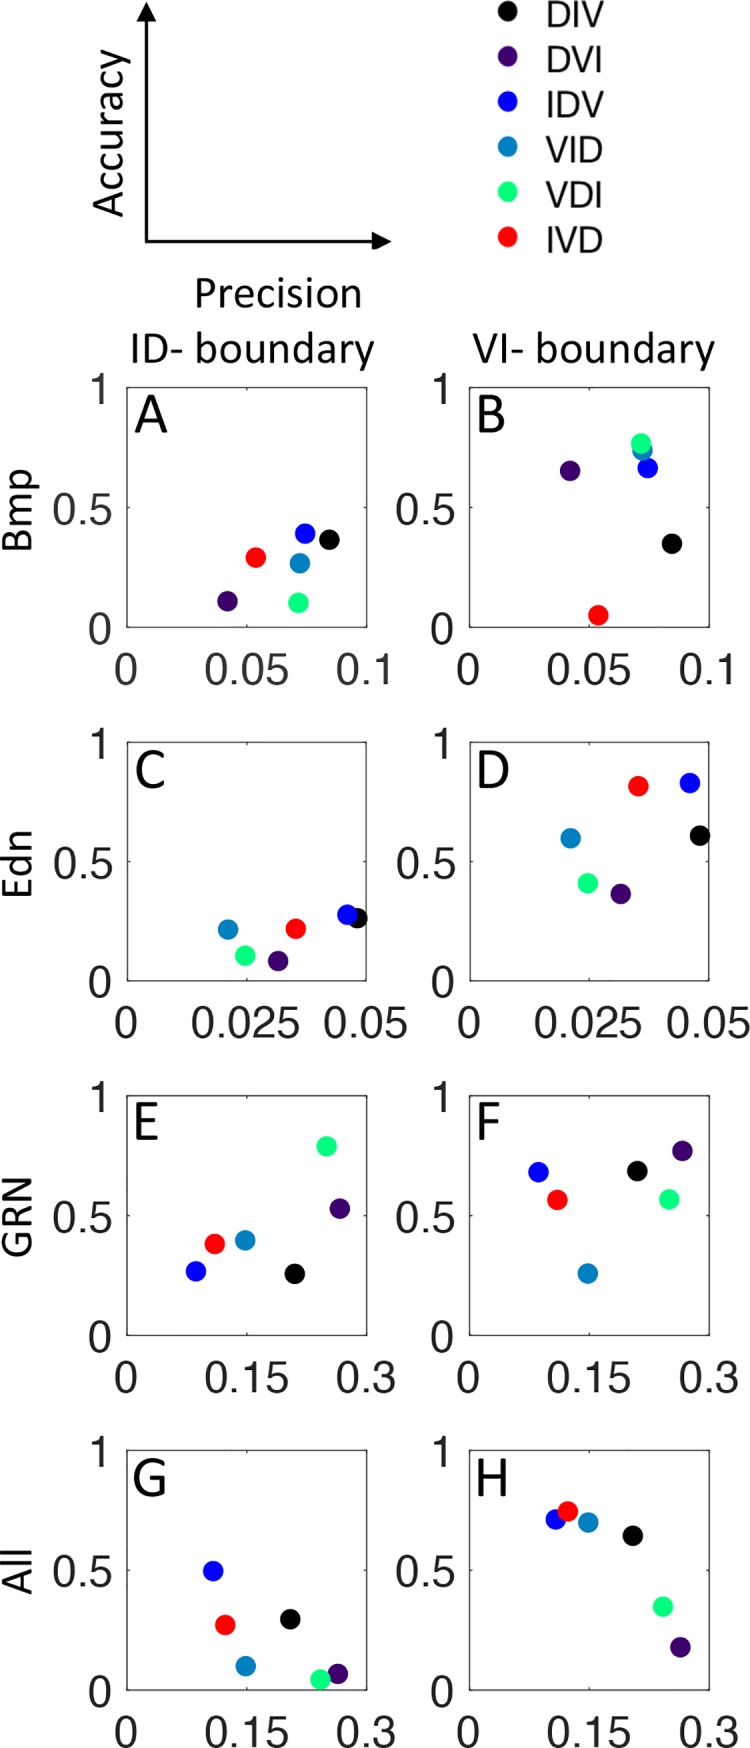
How does pattern formation occur accurately when confronted with tissue growth and stochastic fluctuations (noise) in gene expression? Dorso-ventral (D-V) patterning of the mandibular arch specifies upper versus lower jaw skeletal elements through a combination of Bone morphogenetic protein (Bmp), Endothelin-1 (Edn1), and Notch signaling, and this system is highly robust. We combine NanoString experiments of early D-V gene expression with live imaging of arch development in zebrafish to construct a computational model of the D-V mandibular patterning network. The model recapitulates published genetic perturbations in arch development. Patterning is most sensitive to changes in Bmp signaling, and the temporal order of gene expression modulates the response of the patterning network to noise. Thus, our integrated systems biology approach reveals non-intuitive features of the complex signaling system crucial for craniofacial development, including novel insights into roles of gene expression timing and stochasticity in signaling and gene regulation.


Conflict of interest statement

The authors have declared that no competing interests exist.

Figures

Fig 1
Fig 1. Modeling arch dorsal-ventral (D-V) patterning.
(A) The gene regulatory network (GRN) used to compute the gene expression inside each cell. The lines represent the declining morphogen gradients from ventral to dorsal (Bmp left, Edn1 right). The morphogen gradients act as space-dependent inputs into the ODE system, specifying cells based on their locations along the D-V axis. The mathematical model is a system of coupled ordinary differential equations (ODEs) (Eqs 1–3), where gene interactions are modeled by Hill functions with the microscopic dissociation constants p1-p7 (S1 Table) and production and degradation parameters specified for each GRN component (S2 Table). (B) A cell-based two-dimensional (2D) model. Cells are represented as vertices (black dots in inset) and a generalized Morse potential between these vertices (white arrow in inset) accounts for cell-cell adhesion and cell volume. Cell membranes are computed using Voronoi tessellation between nodes. The collective motion of cells is directed by the boundary conditions and a global chemoattractant pulling them ventrally. At each time step, migrating cells are added at random locations dorsally (white arrows), cells randomly divide, the morphogen production zone is updated (green area) and the quasi steady state of the morphogen gradients is computed on the discrete grid (white dots). Cells experience morphogen concentrations equal to that of the grid point closest to its cell center (green ring in inset). These values are A1(x) and A2(x) in Eqs 1–3 which are solved numerically for each individual cell. Cells are specified as ventral (pink), intermediate (cyan) or dorsal (yellow) if the respective gene expression exceeds 20% and is higher than all the other genes. Colors become darker gradually as the level of expression increases. Mechanical parameters are specified in S3 Table.
Fig 2
Fig 2. Expression of D-V arch patterning genes.
(A-C) Morphogenesis of arches 1 (mandibular) and 2 (hyoid) in the zebrafish embryo. Lateral brightfield views of live embryos. By 36 hours postfertilization (hpf) the arch is patterned into distinct ventral (pink), intermediate (cyan), and dorsal (yellow) domains. These later give rise to lower jaw, joint and upper jaw elements, respectively. aa: anguloarticular, d: dentary, hm: hyomandibular, iop: interopercle, mx: maxilla, op: opercle, pm: premaxilla, pop: preopercle, sop: subopercle, sy: symplectic. (D) NanoString measurements of D-V patterning gene expression in zebrafish arches, normalized to per-cell levels and displayed as heat maps. n ≥ 3 biological replicates/time point. Expression of the intermediate factor dlx3b is highest at 20 hpf before other factors. (E-T) HCR in situ gene expression analysis. DAPI (blue) marks nuclei and dlx2a (white) marks neural crest. dlx3b (left column) and dlx5a (right column) expression are in red, and the ventral domain gene hand2 is in green. dlx3b expression is first detected strongly at 17 hpf, while dlx5a expression appears at 18 hpf. hand2 expression in the first arch is first detected at 20 hpf.
Fig 3
Fig 3. Both one- (1D) and two-dimensional (2D) models reproduce the spatio-temporal patterning observed in vivo.
(A-E) Simulations from the 1D model of the mandibular arch along the D-V axis. A region is defined as patterned by a certain gene group if gene expression is above 20% of the maximum achieved in time (indicated by the black dashed line). White regions are not yet expressing any genes. The ventral domain (pink) remains narrow in the 1D simulation. (F-J) Simulations from the 2D model combining D-V and anterior-posterior (A-P) axes. Here a single cell is defined as patterned (indicated by a color) if the gene expression level exceeds 20% of the maximum, and grey indicates cells that are not yet expressing any genes above the 20% cut-off. Colors become deeper gradually as the level of expression increases. For animations of the model simulations, see S1, S2 and S3 Movies. (K-T) Images of transgenic embryos expressing the ventral marker gene hand2:GFP (K-O, S4 Movie) and the intermediate marker gene dlx5a:GFP (P-T, S5 Movie).
Fig 4
Fig 4. The 2D model reproduces experimental genetic perturbations.
The modeling perturbation is shown at the upper-right and the matching genetic perturbation from the literature on the lower-right (normal patterning in Fig 3J). (A) Loss of Bmp signaling leads to a failure to express ventral (V, pink) and intermediate (I, cyan) and expansion of dorsal (D, yellow) genes. (B) Loss of Jag/Notch signaling leads to absence of the D domain. (C) Excess Jag/Notch signaling causes the D domain to expand at the expense of I. (D) Loss of Edn1 eliminates V and I, such that D expands. (E) Injecting recombinant human EDN1 into an edn1-/- mutant leads to normal patterning. (F) Over-expression of Edn1 (5x) leads to loss of the D domain.
Fig 5
Fig 5. Sensitivity of gene expression with respect to perturbations in GRN parameters.
Box plots summarize the sensitivities (si(t), Eq 9, y-axis) at 10 equidistant time points between 22 and 35 hpf and are normalized to the maximum overall sensitivities, for the ventral (V, pink), intermediate (I, cyan), and dorsal (D, yellow) genes for different temporal orders of expression (x-axis). The sensitivity value indicates how much the patterning output changes, and in which direction (i.e. positively or negatively), with a change in the given modeling parameter. Perturbations in the parameters for gene expression are most sensitive to Bmp activation of ventral genes (p1, panel A) and to Bmp activation of intermediate genes (p5, panel B) (see Fig 1A). For the full time dependent sensitivity data see S7 Fig and for complete box plots of all parameters see S4–S6 Figs. The median’s deviation from zero (black dashed line) indicates how sensitive a given temporal order is to perturbations in the respective parameter. The dorsal genes’ sensitivity to p1 and p5 depends more on the temporal order than ventral or intermediate genes. Expressing intermediate genes last (VDI and DVI) leads to the strongest sensitivity of the dorsal genes, since the medians deviate further from zero.
Fig 6
Fig 6. Different sources of noise have distinct effects on the gene expression profiles and domain patterning.
Left column: 1D. Combined statistics from 100 simulations. The thick line is the mean value and the shaded area is ±σ. Right column: 2D. All panels show final states resulting from one simulation. (A-A’) No-noise reference (adapted from Fig 3E and 3J). (B-B’) Noise in the GRN disrupts boundaries of gene expression in all three domains, ventral (V, pink), intermediate (I, cyan), dorsal (D, yellow), while the mean value of the expression profile is preserved. (C-C’) Noise in Bmp signaling does not disrupt D and V slightly expands dorsally. (D-D’) Since Edn1 plays a permissive role noise in its gradient acts in one direction such that the I domain is partially replaced by V. (E-E’) When all three sources of noise are present simultaneously the effects are additive and the I domain is nearly lost while all three gene groups show strong fluctuations in their expression profiles as with noise only in the GRN. For animations see S6 and S7 Movies.
Fig 7
Fig 7. The temporal order of D-V domain formation modulates responses to noise in Bmp signaling.
Each panel shows results of 100 simulations in the 1D model. The thick line is the mean value and the shaded area is ±σ. For the fully deterministic modeling result of IVD with no noise, see Fig 3E. (A,B) When the V domain is patterned first it is the most sensitive to noise in Bmp signaling. (C,D) Similarly, when the I domain is patterned first noise in Bmp affects the early I genes most strongly. (E,F) When the D domain is patterned first Bmp noise is more efficiently absorbed by the GRN leading to the most robust gene expression profiles.
Fig 8
Fig 8. The temporal order of D-V domain formation modulates responses to noise and the accuracy of domain boundaries.
Graphs show the boundary error E between simulation results and measurements in wild type. Statistics are collected for 10 simulations with the 2D model and results are normalized with respect to the highest error. The line shows the mean value and the error bars ±σ. (A,B) For noise in Bmp signaling the IVD order allows more robust positioning of the V-I boundary (A). Forming I last is however slightly advantageous for positioning the I-D boundary (B). (C,D) For noise in Edn1 signaling forming I last allows more robust positioning of both boundaries. (E,F) With noise in the GRN the boundary error still depends on the temporal sequence but there is no clear clustering with early or late gene groups. (G,H) With all three sources of noise combined it is clearly advantageous to express I genes last for the positioning of the V-I boundary (G) and slightly advantageous for the I-D boundary.
Fig 9
Fig 9. Temporal orders have different trade-offs for domain patterning in the context of noise.
Each graph shows the precision in gene expression on the x-axis and the accuracy of simulated boundaries relative to measured wild-type boundaries on the y-axis. The contribution of noise is shown both individually for Bmp (A,B) and Edn1 (C,D) signaling and the GRN (E,F), and also for all sources of noise combined (G,H). For both precision and accuracy, a lower numerical value reflects better resistance to noise. For all noise sources combined (G,H) the data align on the anti-diagonal indicating trade-off between accuracy and precision. The observed IVD order (red dots) favors precision at the expense of accuracy.

Similar articles

Cited by

References

    1. Lawrence PA, Crick FHC, Munro M. A Gradient of Positional Information in an Insect, Rhodnius. J Cell Sci. 1972. November 1;11(3):815–53. - PubMed
    1. Thompson DW. On growth and form Cambridge [Eng.]: University press; 1917. xv, 793.
    1. Turing AM. The Chemical Basis of Morphogenesis. Philos Trans R Soc Lond B Biol Sci. 1952. August 14;237(641):37–72.
    1. Wolpert L. Positional information and the spatial pattern of cellular differentiation. J Theor Biol. 1969. October 1;25(1):1–47. - PubMed
    1. Alon U. Network motifs: theory and experimental approaches. Nat Rev Genet. 2007. June;8(6):450–61. 10.1038/nrg2102 - DOI - PubMed

Publication types

Substances