. 2018 Nov 27;13(11):e0206127.
doi: 10.1371/journal.pone.0206127. eCollection 2018.

In-vivo and numerical analysis of the eigenmodes produced by a multi-level Tic-Tac-Toe head transmit array for 7 Tesla MRI

Affiliations

In-vivo and numerical analysis of the eigenmodes produced by a multi-level Tic-Tac-Toe head transmit array for 7 Tesla MRI

Tales Santini et al. PLoS One. .

Abstract

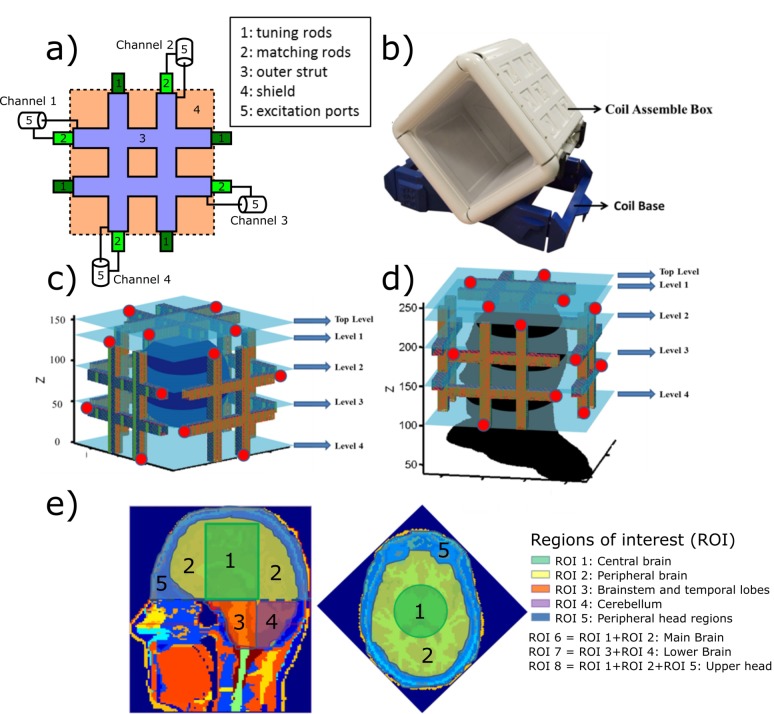
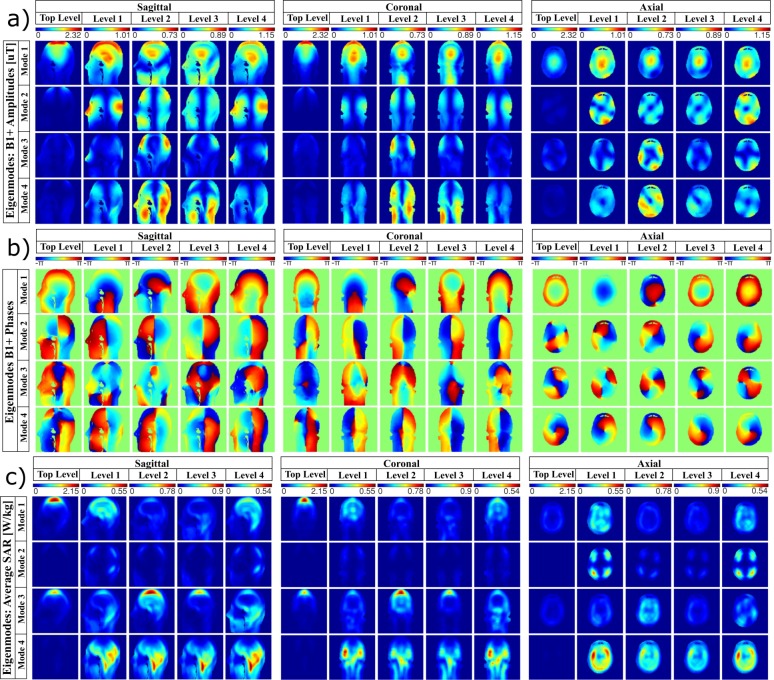
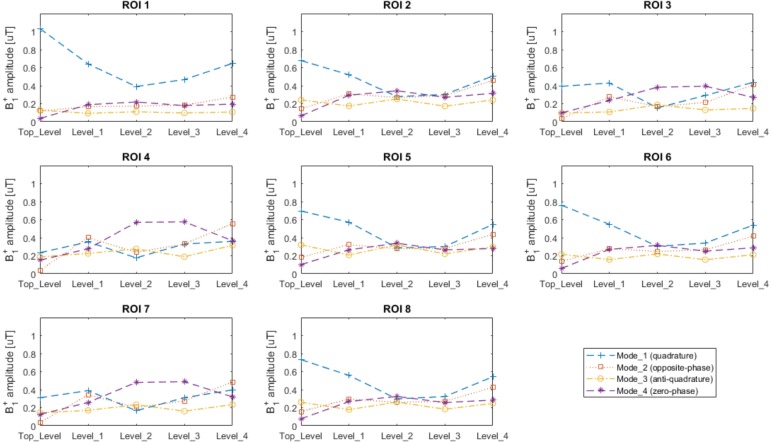
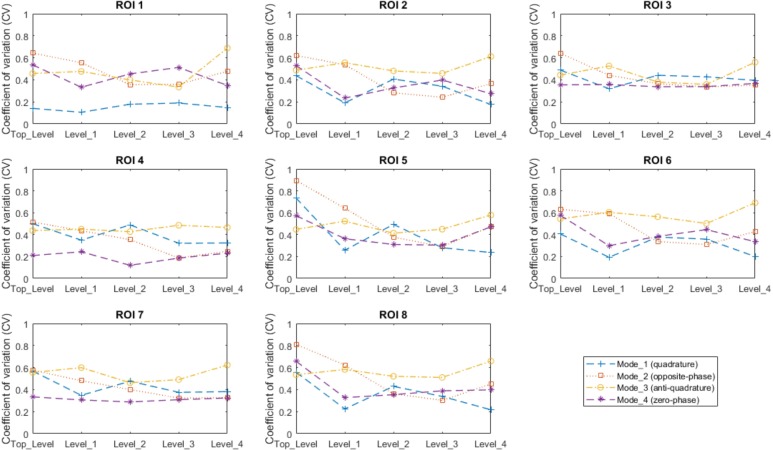
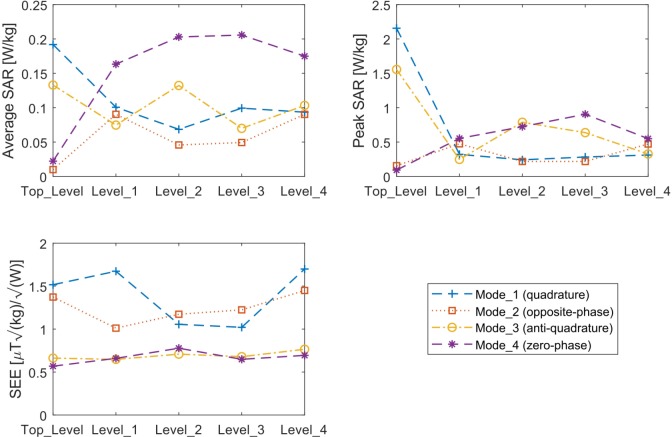
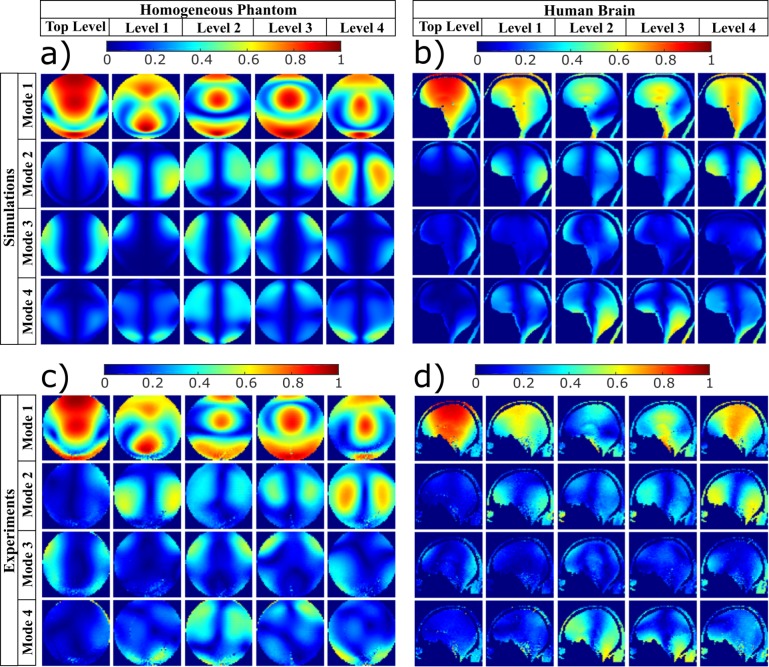
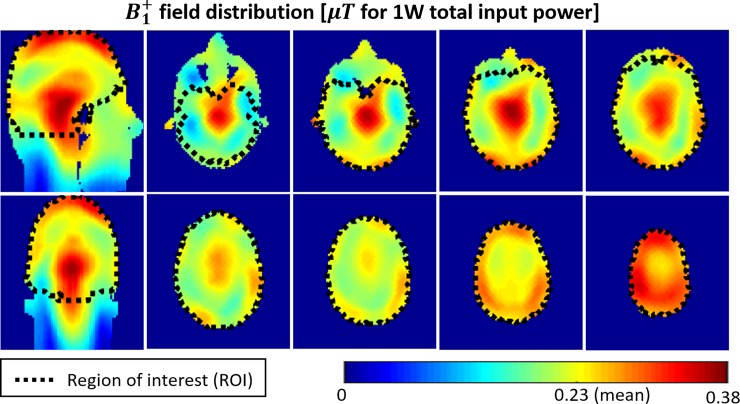
Radio-frequency (RF) field inhomogeneities and higher levels of specific absorption rate (SAR) still present great challenges in ultrahigh-field (UHF) MRI. In this study, an in-depth analysis of the eigenmodes of a 20-channel transmit Tic-Tac-Toe (TTT) RF array for 7T neuro MRI is presented. The eigenmodes were calculated for five different Z levels (along the static magnetic field direction) of the coil. Four eigenmodes were obtained for each Z level (composed of 4 excitation ports), and they were named based on the characteristics of their field distributions: quadrature, opposite-phase, anti-quadrature, and zero-phase. Corresponding finite-difference time-domain (FDTD) simulations were performed and experimental B1+ field maps were acquired using a homogeneous spherical phantom and human head (in-vivo). The quadrature mode is the most efficient and it excites the central brain regions; the opposite-phase mode excites the brain peripheral regions; anti-quadrature mode excites the head periphery; and the zero-phase mode excites cerebellum and temporal lobes. Using this RF array, up to five eigenmodes (from five different Z levels) can be simultaneously excited. The superposition of these modes has the potential to produce homogeneous excitation with full brain coverage and low levels of SAR at 7T MRI.


Conflict of interest statement

Tiejun Zhao is employed by Siemens Medical Solutions. There are no patents or products in development to declare. This does not alter our adherence to PLOS ONE policies on sharing data and materials.

Figures

Fig 1
Fig 1. Coil schematic diagram, load position and regions of interest.
In (a), the schematic diagram of a four-element, 2x2 Tic-Tac-Toe array design. The copper rods (1 and 2) are partially inside the copper struts (3) providing matching and tuning to the RF coil. In (b), the assembled RF coil system, composed of 5 sets/sides of the 2x2 Tic-Tac-Toe transmit arrays (total of 20 transmit elements.) In (c), FDTD spherical (~17cm in diameter) water phantom model (108 by 108 by 108 Yee cells with isotropic resolution of ~1.6mm). The red dots indicate the excitation points of the three visible sets of the 2x2 Tic-Tac-Toe arrays. The 5 levels of the coil in Z direction are shown. In (d), the Duke Virtual Family Adult Head Model (114 by 117 by 144 Yee cells with isotropic resolution of ~1.6mm). In (e), the head model was divided into 8 different regions of interest (ROI) as indicated by the color code and the numbers.
Fig 2
Fig 2. Simulated B1+ field and SAR distributions of the Eigenmodes in the Duke head model for each level (shown in Fig 1).
The central slices in sagittal, coronal, and axial planes are shown. In (a), the amplitude of B1+ field distributions, in μT for 1W input power per channel (total 4W as each level contains 4 channels). For the four Eigenmodes per level, the colorbar is scaled from 0 to the maximum. In (b), the phase of the B1+ field distribution in radians. In (c), the SAR distributions in W/kg for 10g of tissues per 1W input power per channel (total 4W). The coil was loaded with the Duke Virtual Family Adult Head Model.
Fig 3
Fig 3. Average B1+ intensities calculated inside the 8 different regions of interest (ROIs) shown in Fig 1(E) for each Z level of the RF array shown in Fig 1(D).
The scale is in μT for 1W input power per channel (total 4W).
Fig 4
Fig 4. Coefficient of variation (standard deviation over the mean of B1+ field distribution) calculated inside the 8 different regions of interest (ROIs) shown in Fig 1(E) for each Z level of the RF array shown in Fig 1(D).
Fig 5
Fig 5. SAR evaluation of the Eigenmodes for each Z level of the RF array shown in Fig 1(D).
In a) the average SAR per 1 W input power per channel (total 4 W). In b) the peak SAR per 1 W input power per channel (total 4 W). In c), the safety excitation efficiency (SEE) (the B1+ field is averaged over a volume that encapsulates all eight regions of interest.) The results are presented for the Duke Virtual Family Adult Head Model.
Fig 6
Fig 6. Experimental verification and simulated B1+ field distributions of the Eigenmodes for the homogenous spherical phantom and the human head, showing the central sagittal view.
In (a), the simulated B1+ field distributions in the homogeneous spherical phantom with relative permittivity of 79 and conductivity 0.41 S/m. In (b), the simulations in the Duke Virtual Family Adult Head Model. In (c), B1+ maps acquired in the homogeneous phantom with relative permittivity of 79 and conductivity 0.41 S/m. In (d), in-vivo human B1 maps. All maps are scaled to the square root of the sum of the square of all connected transmitting channels.
Fig 7
Fig 7. An example of the combination of the modes of the Tic-Tac-Toe coil (20 Tx channels).
The ROI represents the entire head above and including the cerebellum and excluding the nasal cavities.

Similar articles

Cited by

References

    1. Tropp J. Image brightening in samples of high dielectric constant. J Magn Reson. 2004;167(1):12–24. 10.1016/j.jmr.2003.11.003 . - DOI - PubMed
    1. Ibrahim TS, Mitchell C, Abraham R, Schmalbrock P. In-depth study of the electromagnetics of ultrahigh-field MRI. Nmr Biomed. 2007;20(1):58–68. Epub 2006/09/29. 10.1002/nbm.1094 . - DOI - PubMed
    1. Vaughan JT, Garwood M, Collins CM, Liu W, DelaBarre L, Adriany G, et al. 7T vs. 4T: RF power, homogeneity, and signal-to-noise comparison in head images. Magn Reson Med. 2001;46(1):24–30. . - PubMed
    1. Ibrahim TS, Tang L. Insight into RF power requirements and B1 field homogeneity for human MRI via rigorous FDTD approach. J Magn Reson Imaging. 2007;25(6):1235–47. Epub 2007/05/24. 10.1002/jmri.20919 . - DOI - PubMed
    1. Röschmann P. Radiofrequency penetration and absorption in the human body: Limitations to high‐field whole‐body nuclear magnetic resonance imaging. Medical physics. 1987;14(6):922–31. 10.1118/1.595995 - DOI - PubMed

Publication types