. 2018 Nov 27;13(11):e0207948.
doi: 10.1371/journal.pone.0207948. eCollection 2018.

Remodeling the endoplasmic reticulum proteostasis network restores proteostasis of pathogenic GABAA receptors

Affiliations

Remodeling the endoplasmic reticulum proteostasis network restores proteostasis of pathogenic GABAA receptors

Yan-Lin Fu et al. PLoS One. .

Abstract

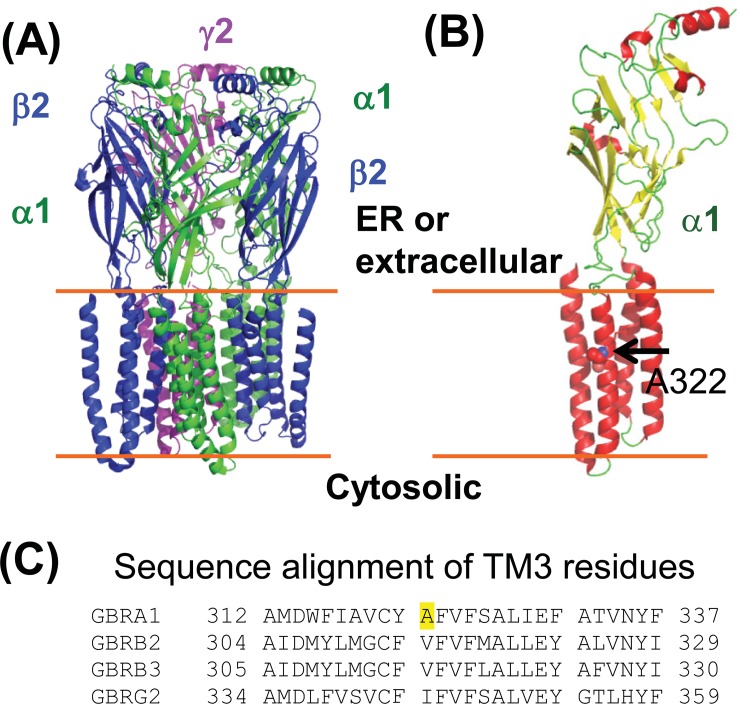
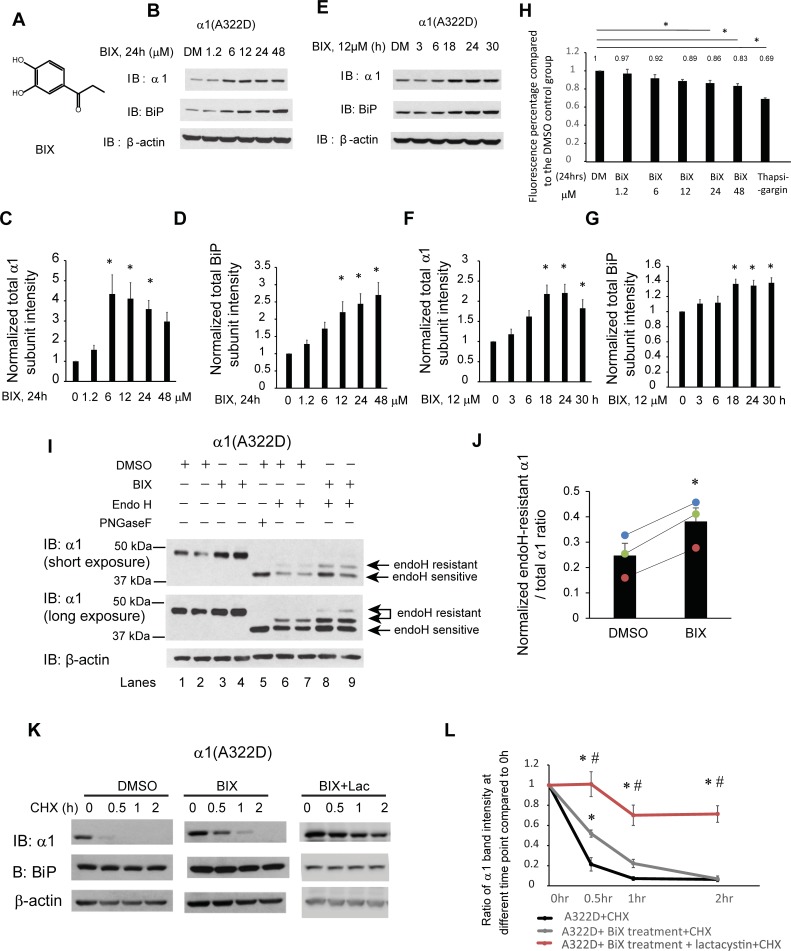
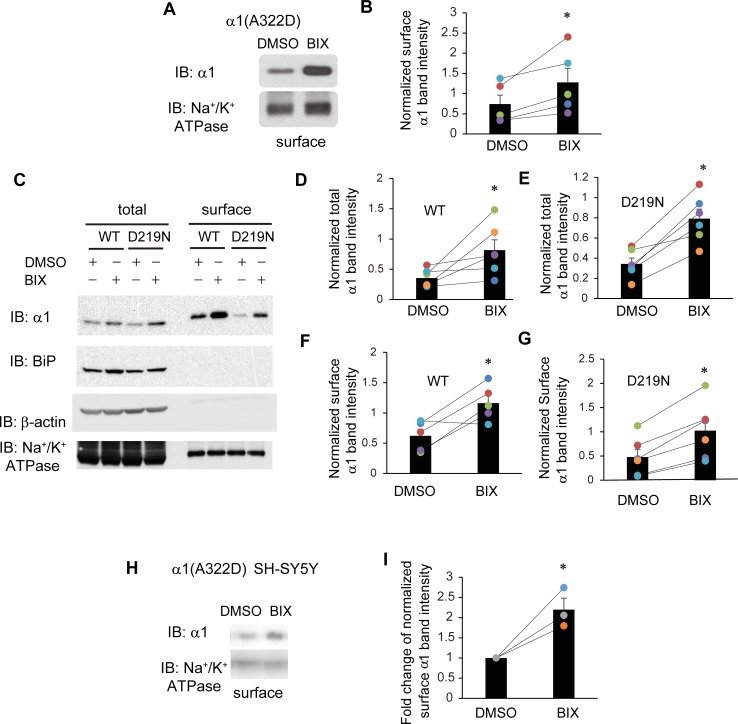
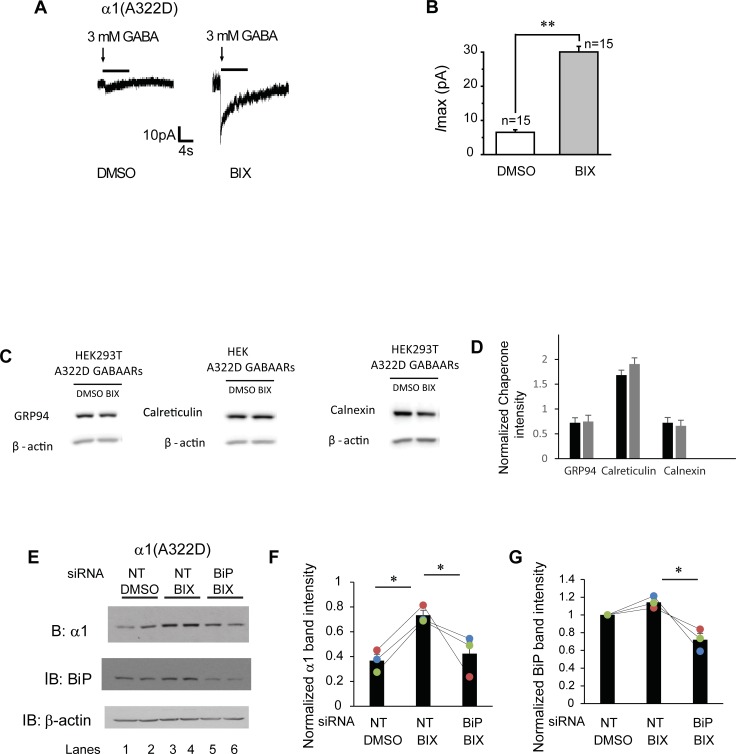
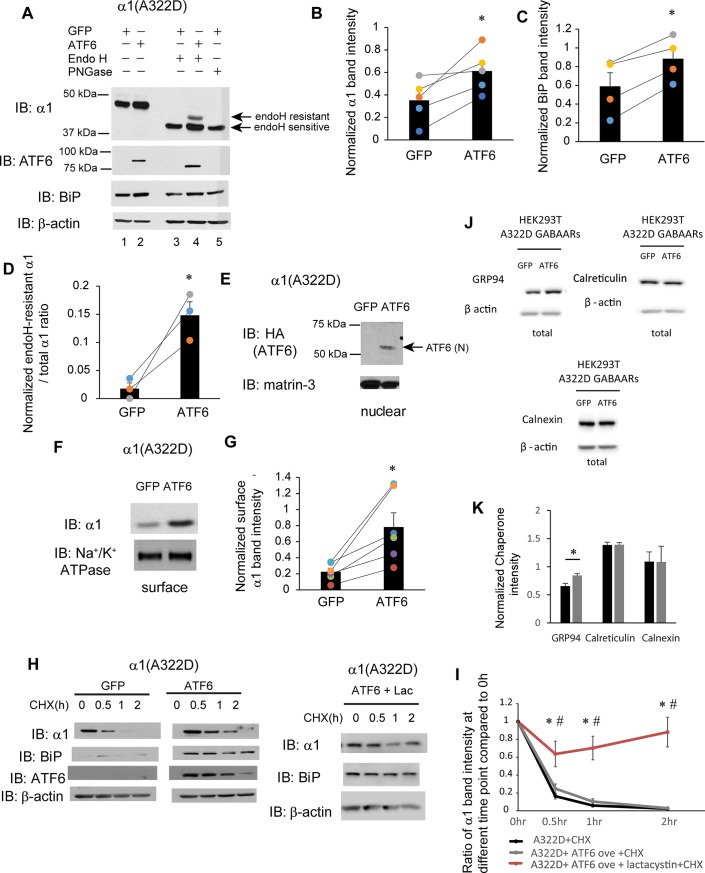
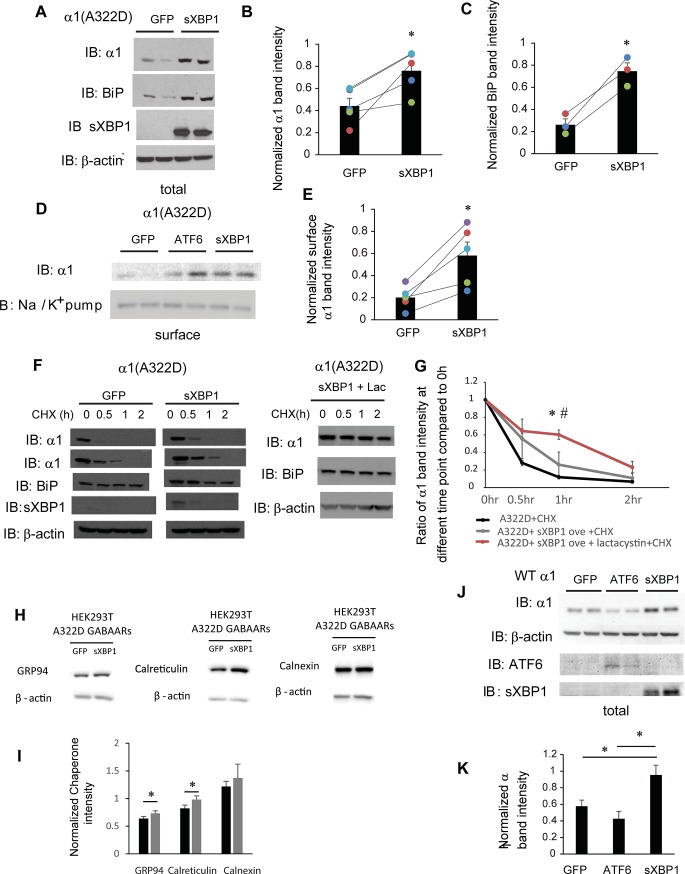
Biogenesis of membrane proteins is controlled by the protein homeostasis (proteostasis) network. We have been focusing on protein quality control of γ-aminobutyric acid type A (GABAA) receptors, the major inhibitory neurotransmitter-gated ion channels in mammalian central nervous system. Proteostasis deficiency in GABAA receptors causes loss of their surface expression and thus function on the plasma membrane, leading to epilepsy and other neurological diseases. One well-characterized example is the A322D mutation in the α1 subunit that causes its extensive misfolding and expedited degradation in the endoplasmic reticulum (ER), resulting in autosomal dominant juvenile myoclonic epilepsy. We aimed to correct misfolding of the α1(A322D) subunits in the ER as an approach to restore their functional surface expression. Here, we showed that application of BIX, a specific, potent ER resident HSP70 family protein BiP activator, significantly increases the surface expression of the mutant receptors in human HEK293T cells and neuronal SH-SY5Y cells. BIX attenuates the degradation of α1(A322D) and enhances their forward trafficking and function. Furthermore, because BiP is one major target of the two unfolded protein response (UPR) pathways: ATF6 and IRE1, we continued to demonstrate that modest activations of the ATF6 pathway and IRE1 pathway genetically enhance the plasma membrane trafficking of the α1(A322D) protein in HEK293T cells. Our results underlie the potential of regulating the ER proteostasis network to correct loss-of-function protein conformational diseases.


Conflict of interest statement

The authors have declared that no competing interests exist.

Figures

Fig 1
Fig 1. Molecular structures of GABAA receptors.
(A) A cartoon representation of the major pentameric GABAA receptor subtype in the central nervous system. It contains two α1 subunits, two β2 subunits, and one γ2 subunit. This model was constructed from the cryo-EM structure (6D6U.pdb) [22] by using PYMOL. (B) Topology of the α1 subunit. The large N-terminal domain resides in the ER lumen or extracellular space. Ala322, displayed as a space-filling model and indicated by an arrow, is located in the third transmembrane (TM3) helix. (C) Sequence alignment of TM3 residues of the α1, β2, β3, and γ2 subunits of GABAA receptors. The sequences are from the following Uniprot entries: GBRA1, P14867; GBRB2, P47870-1; GBRB3, P28472-1; GBRG2, P18507-2. The A322 residue in the α1 subunit is highlighted in yellow. Hydrophobic residues are conserved in this position.
Fig 2
Fig 2. BIX, a potent BiP inducer, enhances the folding and trafficking and reduces the degradation of α1(A322D) subunits.
(A) Chemical structure of BIX. (B-D) Dose response of BIX treatment in regulating α1(A322D) total protein level. HEK293T cells stably expressing α1(A322D)β2γ2 GABAA receptors were treated with BIX at the indicated concentrations or the vehicle control DMSO in the cell culture media for 24 h. Cells were then lysed and subjected to SDS-PAGE and Western blot analysis (B). Normalized band intensities for α1(A322D) subunits and BiP are shown in (C) and (D) (n = 8). (E-G) Time course of BIX treatment in regulating α1(A322D) total protein level. HEK293T cells stably expressing α1(A322D)β2γ2 GABAA receptors were treated with BIX (12 μM) for the indicated time. Cells were then lysed and subjected to SDS-PAGE and Western blot analysis (E). Normalized band intensities for α1(A322D) subunits and BiP are shown in (F) and (G) (n = 5). (H) HEK293T cells stably expressing α1(A322D)β2γ2 GABAA receptors were plated into a 96-well plate on day 1. Cells were then treated with BIX at the indicated concentrations or the vehicle control DMSO in the cell culture media for 24 h. One groups of HEK293T cells stably expressing α1(A322D)β2γ2 GABAA receptors are treated with thapsigargin (2 μM, 7h) as cell toxicity positive control. Resazurin (0.15mg/ml dissolved in DPBS) is added to cells 1.5 h before plate reading. Fluorescence signal at 560 nm excitation / 590 nm emission is measured. The ratios of fluorescence signal in the DMSO treatment group to treatment groups is shown in (H) (n = 4, one-way ANOVA). (I) HEK293T cells expressing α1(A322D)β2γ2 receptors were treated with BIX (12 μM, 24 h) or DMSO vehicle control. Then cells were lysed, and total proteins were extracted. Total cellular proteins were incubated with or without endoglycosidase H enzyme (endo H) or peptide-N-glycosidase F (PNGase F) for 1h at 37°C and then subjected to SDS-PAGE and Western blot analysis. Endo H resistant α1 subunit bands (top arrows, lanes 6–9) represent properly folded, post-ER α1 subunit glycoforms that traffic at least to the Golgi compartment, whereas endo H sensitive α1 subunit bands (bottom arrow, lanes 6–9) represent immature α1 subunit glycoforms that are retained in the ER. The PNGase F enzyme cleaves between the innermost N-acetyl-D-glucosamine and asparagine residues from N-linked glycoproteins, serving as a control for unglycosylated α1 subunits (lane 5). The ratio of endo H resistant α1 / total α1, which was calculated from endo H-resistant band intensity / (endo H-resistant + endo H-sensitive band intensity), serves as a measure of trafficking efficiency of the α1(A322D) subunit. Quantification of this ratio after endo H treatment (lanes 6–9) is shown in (J) (n = 3, paired t-test). (K) HEK293T cells stably expressing α1(A322D)β2γ2 receptors were either treated with DMSO vehicle control, or BIX (12 μM, 24 h) or BIX (12 μM, 24 h) and lactacystin (2.5μM, 24h). Cycloheximide (150 μg/ml), a protein synthesis inhibitor, was added to different cell groups for 0, 0.5 hr, 1 hr, and 2 hrs. Cells were then lysed and subjected to SDS-PAGE and western blot analysis. The quantitation results are shown in (L) (n = 5, one-way ANOVA followed by Fisher test, *, p<0.05 between DMSO vehicle control and treatment groups, #, p<0.05 between BIX group and BIX + Lac group). Statistical significance was evaluated using one-way ANOVA followed by post-hoc Tukey test in (C), (D), (F), and (G). *, p<0.05. Error bar = SEM.
Fig 3
Fig 3. BIX enhances the surface expression of α1 subunit variants of GABAA receptors.
(A) HEK293T cells expressing α1(A322D)β2γ2 receptors were treated with BIX (12 μM, 24 h) or DMSO vehicle control. Then the cell surface proteins were tagged with biotin using membrane-impermeable biotinylation reagent sulfo-NHS SS-Biotin. Biotinylated surface proteins were affinity-purified using neutravidin-conjugated beads and then subjected to SDS-PAGE and Western blot analysis. The Na+/K+-ATPase serves as a surface protein loading control. Quantification of normalized surface α1(A322D) protein levels to the Na+/K+-ATPase controls is shown in (B) (n = 5, paired t-test). (C) HEK293T cells expressing α1β2γ2 receptors or α1(D219N)β2γ2 receptors were treated as in (A). Quantification of normalized total and surface WT α1 protein levels is shown in (D & F) (n = 6 for total and n = 5 for surface, paired t-test). Quantification of normalized total and surface α1(D219N) protein levels is shown in (E & G) (n = 6 for total and surface, paired t-test). (H) SH-SY5Y cells stably expressing α1(A322D)β2γ2 receptors were treated with BIX (12 μM, 24 h) or DMSO vehicle control. Then surface biotinylation assay was performed as in (A). Quantification of normalized surface α1(A322D) protein levels is shown in (I) (n = 3, two tailed student t-test). * p < 0.05.
Fig 4
Fig 4. BIX enhances the function of α1(A322D)β2γ2 receptors.
(A) Representative whole-cell patch clamping recording traces in monoclonal HEK293T cells stably expressing α1(A322D)β2γ2 GABAA receptors. Cells were treated with BIX (12 μM, 24h) or DMSO before voltage clamping. GABA (3mM) was applied to induce chloride currents with a holding potential of -60 mV. Quantification of the peak currents (Imax) is shown in (B). The number of patched cells in each group is shown on the top of the bar. pA: picoampere. (C and D) HEK293T cells expressing α1(A322D)β2γ2 receptors were treated with BIX (12μM, 24h). The cell lysates were then subjected to SDS-PAGE and Western blot analysis using corresponding antibodies (C). Quantification of normalized total cellular chaperone protein expression levels is shown in (D) (n = 4, paired t-test). (E) HEK293T cells stably expressing α1(A322D)β2γ2 receptors were treated with non-targeting (NT) or BiP siRNA for 48 hrs. Cells were then treated either with BIX (12 μM) or DMSO vehicle control for another 24 hrs. Cells were then lysed and subjected to SDS-PAGE and western blot analysis. The quantitation results of α1(A322D) and BiP are shown in (F&G) (n = 3, one-way ANOVA). * p < 0.05; ** p < 0.01.
Fig 5
Fig 5. ATF6 activation promotes the forward trafficking of α1(A322D) subunit of GABAA receptors.
(A) HEK293T cells expressing α1(A322D)β2γ2 receptors were transiently transfected with GFP or HA-tagged full-length ATF6α plasmids. Forty-eight hrs post transfection, cells were lysed, and total proteins were extracted. Total cellular proteins were incubated with or without endoglycosidase H enzyme (endo H) or peptide-N-glycosidase F (PNGase F) for 1h at 37°C and then subjected to SDS-PAGE and Western blot analysis using corresponding antibodies. Endo H resistant v1 subunit bands (top arrow, lane 4) represent properly folded, post-ER α1 subunit glycoforms that traffic at least to the Golgi compartment, whereas endo H sensitive α1 subunit bands (bottom arrow, lanes 3 and 4) represent immature α1 subunit glycoforms that are retained in the ER. The PNGase F enzyme cleaves between the innermost N-acetyl-D-glucosamine and asparagine residues from N-linked glycoproteins, serving as a control for unglycosylated α1 subunits (lane 5). Quantification of total cellular protein expression levels of α1 and BiP is shown in (B) and (C) (n = 5 for α1 and n = 4 for BiP, paired t-test). Quantification of the ratio of endo H resistant α1 / total α1 is shown in (D) (n = 3, paired t-test). (E) Cells were treated as in (A). Forty-eight hrs post transfection, the nuclear fractions were extracted and subject to SDS-PAGE. ATF6 (N) is the cleaved, activated N-terminal ATF6 in the nucleus. Matrin-3 serves as a nuclear protein loading control. (F) HEK293T cells were treated as in (A). Forty-eight hrs post transfection, the cell surface proteins were tagged with biotin using membrane-impermeable biotinylation reagent sulfo-NHS SS-Biotin. Biotinylated surface proteins were affinity-purified using neutravidin-conjugated beads and then subjected to SDS-PAGE and Western blot analysis. The Na+/K+-ATPase serves as a surface protein loading control. Quantification of normalized surface α1(A322D) protein levels is shown in (G) (n = 6, paired t-test). (H) HEK293T cells expressing α1(A322D)β2γ2 receptors were either transfected with GFP control, or ATF6, or transfected with ATF6 and treated with lactacystin (2.5μM for 24h). Cycloheximide (150 μg/ml), a protein synthesis inhibitor, was added to different cell groups for 0, 0.5 hr, 1 hr, and 2 hrs. Cells were then lysed and subjected to SDS-PAGE and western blot analysis. The quantitation results are shown in (I) (n = 5, one-way ANOVA followed by Fisher test, *, p<0.05 between GFP control and ATF6 + Lac group, #, p<0.05 between ATF6 group and ATF6 + Lac group). (J and K) HEK293T cells expressing α1(A322D)β2γ2 receptors were either transfected with GFP or ATF6 for 48h. The cell lysates were then subjected to SDS-PAGE and Western blot analysis using corresponding antibodies (J). Quantification of total cellular chaperone protein expression levels is shown in (K) (n = 4, paired t-test). *, p<0.05.
Fig 6
Fig 6. IRE1 activation increases the surface expression of α1(A322D) subunit of GABAA receptors.
(A) HEK293T cells expressing α1(A322D)β2γ2 receptors were transiently transfected with GFP or XBP1-s (spliced XBP1) plasmids. Forty-eight hrs post transfection, cells were lysed, and total proteins were extracted. The cell lysates are then subjected to SDS-PAGE and Western blot analysis using corresponding antibodies. Quantification of total cellular protein expression levels of α1 and BiP is shown in (B & C) (n = 5 for α1 and n = 3 for BiP, paired t-test). (D) HEK293T cells were treated as in (A). Forty-eight hrs post transfection, the cell surface proteins were tagged with biotin using membrane-impermeable biotinylation reagent sulfo-NHS SS-Biotin. Biotinylated surface proteins were affinity-purified using neutravidin-conjugated beads and then subjected to SDS-PAGE and Western blot analysis. The Na+/K+-ATPase serves as a surface protein loading control. Quantification of normalized surface protein expression levels of α1 is shown in (E) (n = 5, paired t-test). (F) HEK293T cells expressing α1(A322D)β2γ2 receptors were either transfected with GFP control, or XBP-s or transfected with XBP-s and treated with lactacystin (2.5 μM for 24h). Cycloheximide (150 μg/ml), a protein synthesis inhibitor, was added to different cell groups for 0, 0.5 hr, 1 hr, and 2 hrs. Cells were then lysed and subjected to SDS-PAGE and western blot analysis. The quantitation results are shown in (G) (n = 3, one-way ANOVA followed by Fisher test, *, p<0.05 between control group and XBP1-s + Lac group, #, p<0.05 between XBP1-s group and XBP1-s + Lac group). (H and I) HEK293T cells expressing α1(A322D)β2γ2 receptors were either transfected with GFP or XBP1s for 48h. The cell lysates were then subjected to SDS-PAGE and Western blot analysis using corresponding antibodies (H). Quantification of total cellular chaperone protein expression levels is shown in (I) (n = 4, paired t-test). *, p<0.05. (J) HEK293T cells expressing WT α1β2γ2 receptors were transfected with GFP, ATF6 or XBP1s plasmids. Forty-eight hrs post transfection, cells were lysed, and total proteins were extracted and subject to SDS-PAGE and Western blot analysis. Quantification of total cellular protein expression levels of α1 is shown in (K) (n = 3, paired t-test using adjusted p values). *, p<0.05.

Similar articles

Cited by

References

    1. Brodsky JL, Skach WR (2011) Protein folding and quality control in the endoplasmic reticulum: Recent lessons from yeast and mammalian cell systems. Curr Opin Cell Biol 23: 464–475. 10.1016/j.ceb.2011.05.004 - DOI - PMC - PubMed
    1. Feige MJ, Hendershot LM (2013) Quality control of integral membrane proteins by assembly-dependent membrane integration. Mol Cell 51: 297–309. 10.1016/j.molcel.2013.07.013 - DOI - PMC - PubMed
    1. Jefferson RE, Min D, Corin K, Wang JY, Bowie JU (2018) Applications of Single-Molecule Methods to Membrane Protein Folding Studies. J Mol Biol 430: 424–437. 10.1016/j.jmb.2017.05.021 - DOI - PMC - PubMed
    1. O'Donnell BM, Mackie TD, Brodsky JL (2017) Linking chanelopathies with endoplasmic reticulum associated degradation. Channels (Austin) 11: 499–501. - PMC - PubMed
    1. Olzmann JA, Kopito RR, Christianson JC (2013) The mammalian endoplasmic reticulum-associated degradation system. Cold Spring Harb Perspect Biol 5: a013185 10.1101/cshperspect.a013185 - DOI - PMC - PubMed

Publication types

MeSH terms

Substances