

Review
doi: 10.1021/acs.analchem.8b05303.
Epub 2018 Dec 10.
Recent Advances in Design of Fluorescence-Based Assays for High-Throughput Screening
- PMID: 30481456
- PMCID: PMC7262998
- DOI: 10.1021/acs.analchem.8b05303
Item in Clipboard
Review
Recent Advances in Design of Fluorescence-Based Assays for High-Throughput Screening
Anal Chem.
.
Abstract
Figures
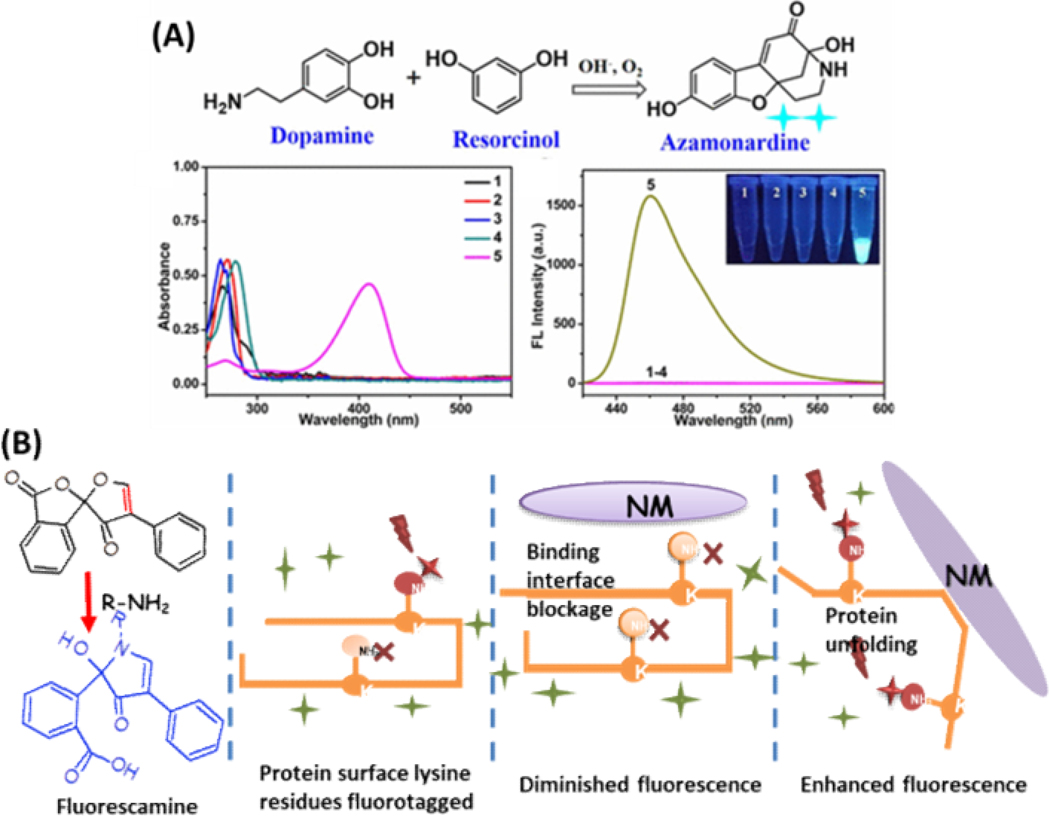
A) Schematic representation of dopamine reacting with resocinol in synthesis of fluorescent azamonardine; and the absorption and fluorescence spectra of tyramine (1), dopamine (2), resorcinol (3), mixture of tyramine and resorcinol (4) and mixture of dopamine and resorcinol (5) under the same conditions, respectively. Reproduced from Zhao, J.; Bao, X.; Wang, S.; Lu, S.; Sun, J.; Yang, X. Anal. Chem.
2017, 89, 10529–10536 (ref 39). Copyright 2017 American Chemical Society. (B) Molecule structure of fluorescamine and its reaction with primary amine, which can be utilized to probe protein binding to the NPs: protein surface blocked by the binding interface with nanomaterials will result in diminished fluorescence; and protein unfolding induced by nanomaterials will result in enhanced fluorescence.
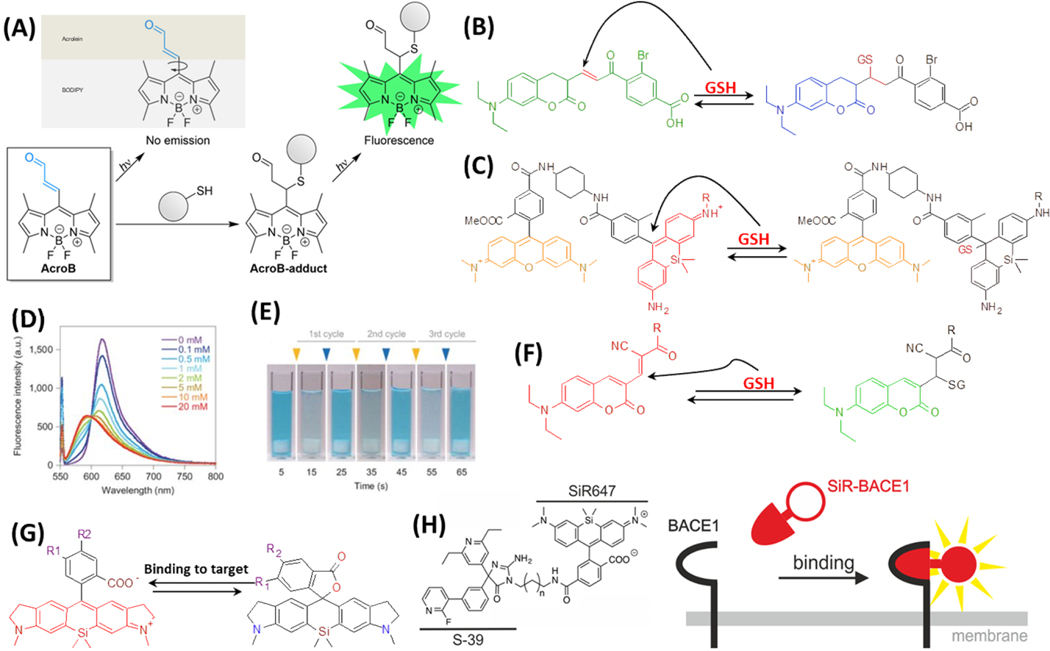
(A) Molecule structure and mechanism of action of AcroB. Reproduced from Lincoln, R.; Greene, L. E.; Zhang, W.; Louisia, S.; Cosa, G. J. Am. Chem. Soc.
2017, 139, 16273–16281 (ref 51). Copyright 2017 American Chemical Society. Molecule structures and reactions of reversible fluorogenic probes for GSH: (B) TQ green, (C) SiR and TMR FRET system, and (F) QG-1. (D) The fluorescence intensity changes of SiM-TMR FRET system, with adding different concentration of GSH. (E) The visualization of reversible colour-changing of the SiM probe. GSH and NEM (N-ethylmaleimide) are added alternatively at 10-second intervals. The concentration of the dye is 20 μM. The final concentrations of GSH and NEM after each cycle are 5 mM. (D) and (E) are reprinted by permission from Macmillan Publishers Ltd: NATURE, Umezawa, K.; Yoshida, M.; Kamiya, M.; Yamasoba, T.; Urano, Y. Nat. Chem.
2017, 9, 279–286 (ref 55). Copyright 2017. (G) Examples of one SiR dye undergoing ground-state isomerization. R1 and R2 are possible sites to add targeting moieties for various applications. (H) Molecule structure and mechanism of action of SiR647 conjugated to S-39 that targets BACE1 protein. Reproduced from Karch, S.; Broichhagen, J.; Schneider, J.; Böning, D.; Hartmann, S.; Schmid, B.; Tripal, P.; Palmisano, R.; Alzheimer, C.; Johnsson, K.; Huth, T. J. Med. Chem.
2018, 61 (14), 6121–6139 (ref 62). Copyright 2018 American Chemical Society.
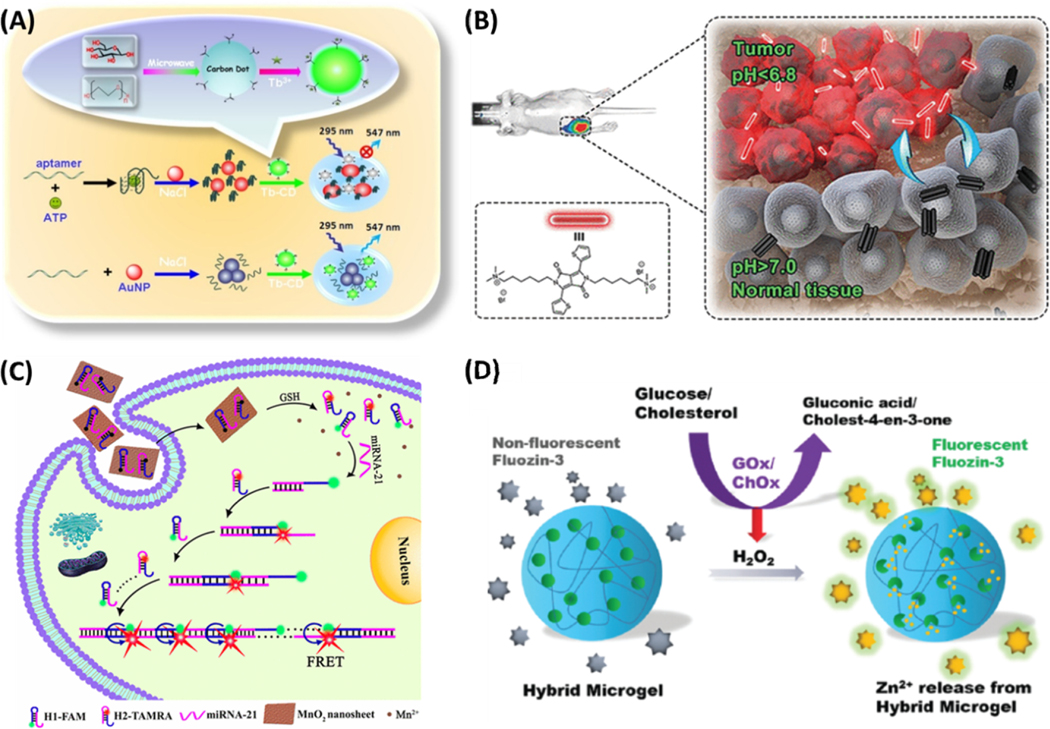
(A) Schematic illustration of fluorescent aptasensing platform for the quantitative monitoring of adenosine 5′-triphosphate (ATP) by interaction of unmodified gold nanoparticles (AuNPs) with terbium ion-functionalized carbon dots (Tb-CDs). Reprinted from Biosens. Bioelectron., vol. 86, Xu, M.; Gao, Z.; Zhou, Q.; Lin, Y.; Lu, M.; Tang, D. Terbium Ion-coordinated Carbon Dots for Fluorescent Aptasensing of Adenosine 5’-Triphosphate with Unmodified Gold Nanoparticles, pp. 978–984 (ref. 85). Copyright 2016, with permission from Elsevier. (B) Schematic illustration of pH switchable nanoassembly for imaging a broad range of malignant tumors. Reproduced from Liu, Y.; Qu, Z.; Cao, H.; Sun, H.; Gao, Y.; Jiang, X. ACS Nano
2017, 11, 12446–12452 (ref 18). Copyright 2017 American Chemical Society. (C) Schematic illustration of MnO2 nanosheet-mediated in cell HCR signal enhancement for sensitively detecting miRNA-21 in living cells. Reproduced from Li, J.; Li, D.; Yuan, R.; Xiang, Y. ACS Appl. Mater. Interfaces
2017, 9, 5717–5724 (ref 100). Copyright 2017 American Chemical Society. (D) Scheme of microgels for the detection of glucose and cholesterol. Reproduced from Liu, Y.; Wang, Y.-M.; Sedano, S.; Jiang, Q.; Duan, Y.; Shen, W.; Jiang, J.-H.; Zhong, W. Chem. Commun.
2018, 54, 4329–4332 (ref 105), with permission of The Royal Society of Chemistry.
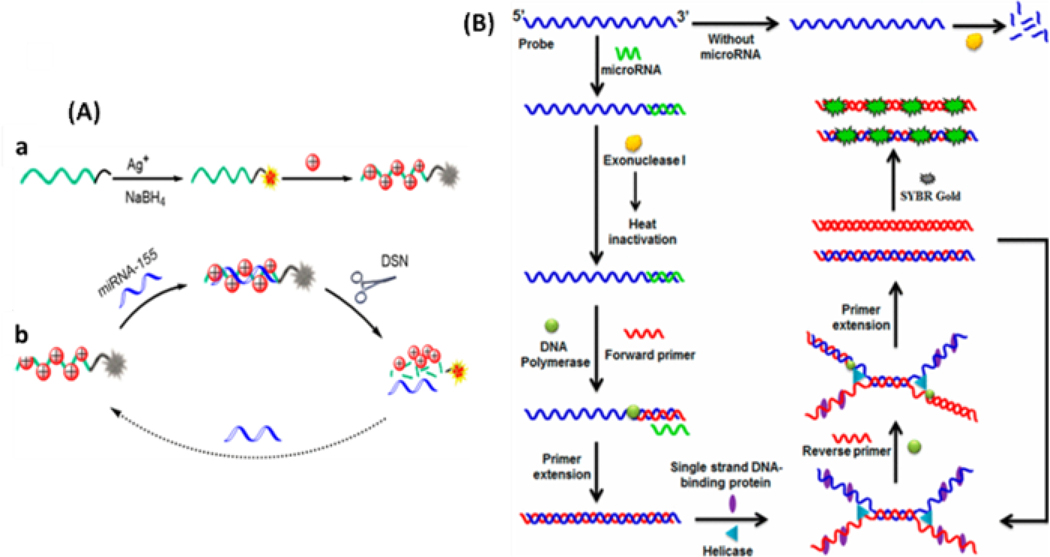
(A) a - Formation of DNA/AgNCs and the adsorption of AuNPs on DNA/AgNCs for fluorescence quenching; b - Schematic representation for fluorescent detection of miRNA-155 based on DSN-Assisted Target Recycling Signal Amplification. Reproduced from Miao, X.; Cheng, Z.; Ma, H.; Li, Z.; Xue, N.; Wang, P. Anal. Chem.
2018, 90, 1098–1103 (ref 132). Copyright 2018 American Chemical Society. (B) Scheme of isothermal helicase-dependent amplification for miRNA. Reproduced from Ma, F.; Liu, M.; Tang, B.; Zhang, C.-y. Anal. Chem.
2017, 89, 6182–6187 (ref 138). Copyright 2017 American Chemical Society.
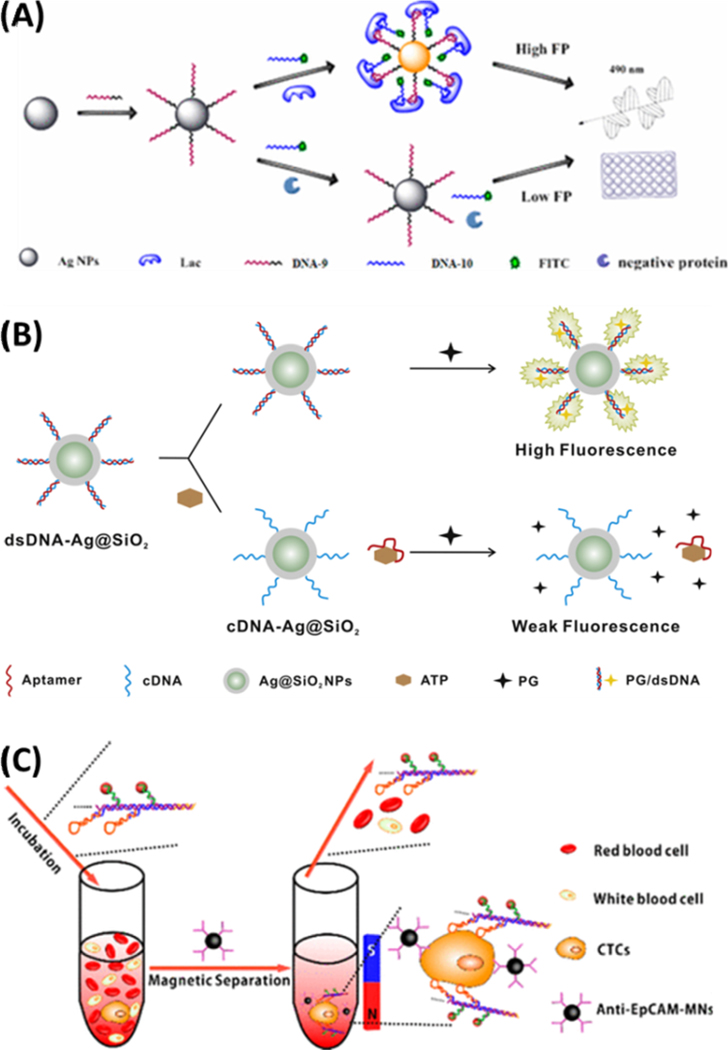
(A) Schematic illustration of the aptasensor produced from the bivalent aptamers and the Ag10NPs for dual signal amplification. Reproduced from Chen, Z.; Li, H.; Jia, W.; Liu, X.; Li, Z.; Wen, F.; Zheng, N.; Jiang, J.; Xu, D. Anal. Chem.
2017, 89, 5900–5908 (ref 139). Copyright 2017 American Chemical Society (B) The sensing scheme for ATP detection assisted by the Ag@SiO2 NPs. Reprinted from Biosens. Bioelectron., vol. 77, Song, Q.; Peng, M.; Wang, L.; He, D.; Ouyang, J. A Fluorescent Aptasensor for Amplified Label-free Detection of Adenosine Triphosphate Based on Core-shell Ag@SiO2 Nanoparticles (ref. 140). Copyright 2015, with permission from Elsevier. (C) Helispecific recognition and isolation of CTCs by the Ag2S nanoassembly and the anti-EpCAM-MNPs. Reproduced from Ding, C.; Zhang, C.; Yin, X.; Cao, X.; Cai, M.; Xian, Y. Anal. Chem.
2018, 90, 6702–6709 (ref 146). Copyright 2018 American Chemical Society.
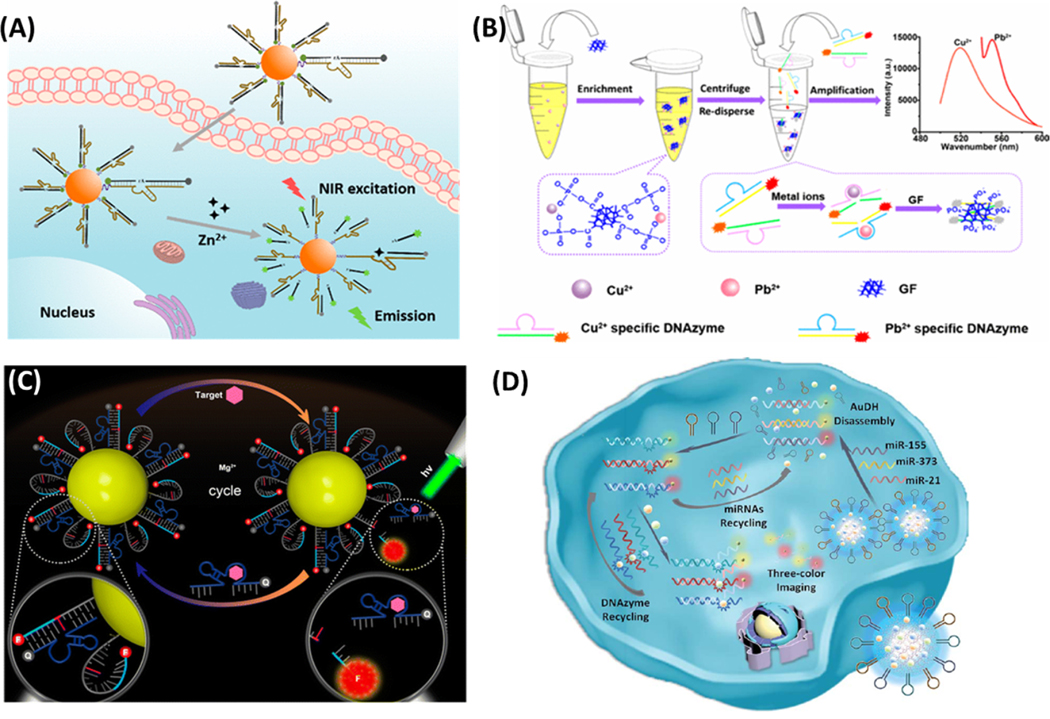
(A) A fluorescent sensor for intracellular Zn2+ prepared from immobilizing the Zn-sensitive DNAzyme carrying a TP fluorescent dye onto the AuNPs. Reproduced from Yang, C.; Yin, X.; Huan, S.-Y.; Chen, L.; Hu, X.-X.; Xiong, M.-Y.; Chen, K.; Zhang, X.-B. Anal. Chem.
2018, 90, 3118–3123 (ref 148). Copyright 2018 American Chemical Society (B) A metal sensor prepared by coupling the GF with metal-sensitive DNAzymes. Reproduced from Fang, X.; Liu, Y.; Jimenez, L.; Duan, Y.; Adkins, G. B.; Qiao, L.; Liu, B.; Zhong, W. Anal. Chem.
2017, 89, 11758–11764 (ref 149). Copyright 2017 American Chemical Society. (C) The working mechanism of the aptazyme–AuNP sensor for fluorescent detection of intracellular ATP. Reproduced from Yang, Y.; Huang, J.; Yang, X.; Quan, K.; Wang, H.; Ying, L.; Xie, N.; Ou, M.; Wang, K. Anal. Chem.
2016, 88, 5981–5987 (ref 152). Copyright 2016 American Chemical Society. (D) Detection of miRNAs in living cells using AuDH/Mn+/H-mediated dual signal amplification. Reproduced from Meng, X.; Zhang, K.; Dai, W.; Cao, Y.; Yang, F.; Dong, H.; Zhang, X. Chem. Sci.
2018, 9, 7419–7425 (ref 153), with permission of The Royal Society of Chemistry
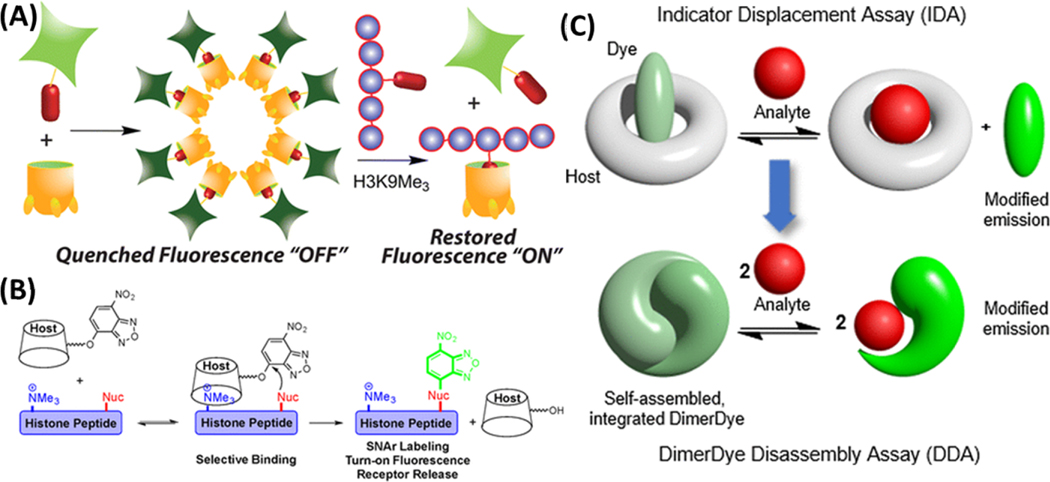
(A) Self-aggregation based host-guest sensing of histone methylation. (B) Supramolecular affinity labeling of the histone peptides containing trimethyllysine. Reproduced from Gober, I. N.; Waters, M. L. J. Am. Chem. Soc.
2016, 138 (30), 9452–9459 (ref 169). Copyright 2016 American Chemical Society. (C) Self-assembled dimer-dye based fluorescent sensing in biological media. Reproduced from Beatty, M. A.; Borges-Gonzalez, J.; Sinclair, N. J.; Pye, A. T.; Hof, F. J. Am. Chem. Soc.
2018, 140 (10), 3500–3504 (ref 171). Copyright 2018 American Chemical Society.
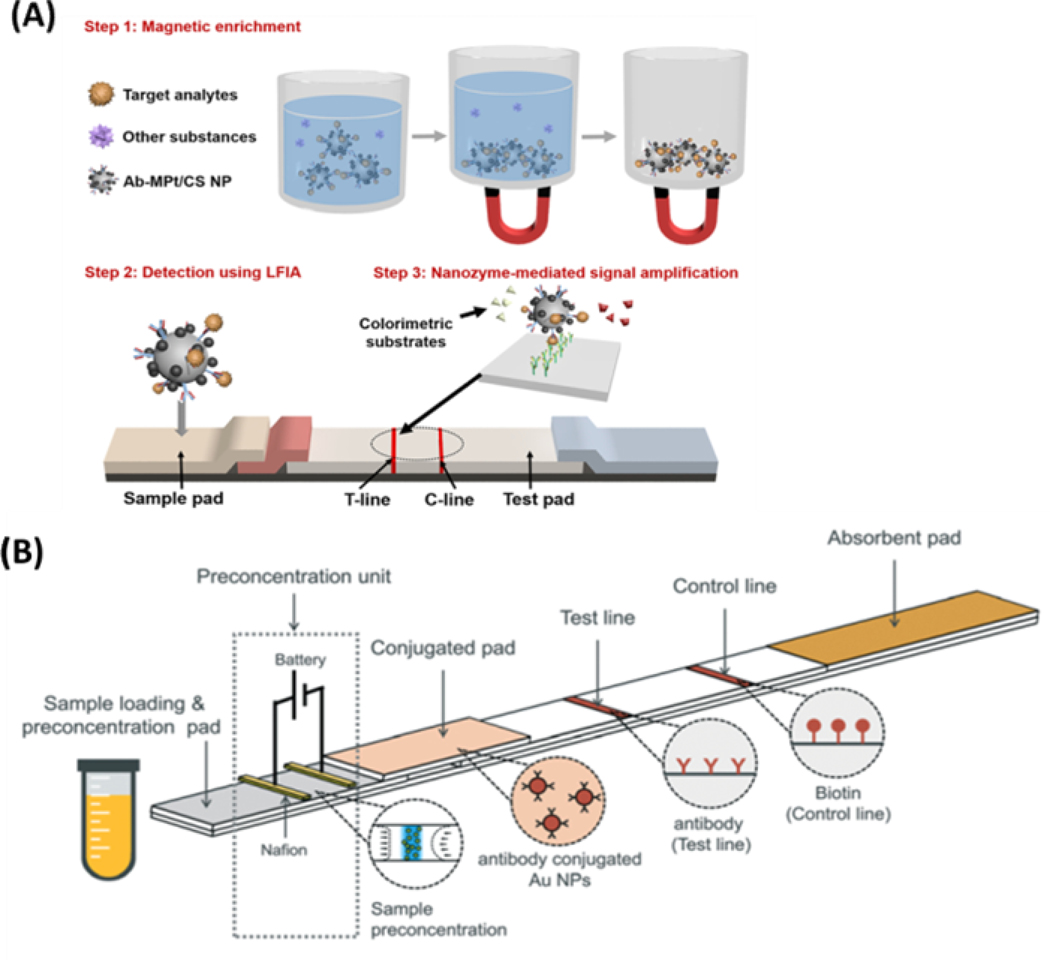
(A) Design of the magnetic nanozyme-based LFA strips for target detection. Reproduced from Kim, M. S.; Kweon, S. H.; Cho, S.; An, S. S. A.; Kim, M. I.; Doh, J. and Lee, J. ACS Appl. Mater. Interfaces
2017, 9, pp35133–35140 (ref 185). Copyright 2017 American Chemical Society. (B) Schematic illustration of the preconcentration unit of a LFA kit. Reproduced from Kim, C.; Yoo, Y. K.; Han, S. I.; Lee, J.; Lee, D.; Lee, K.; Hwang, K. S.; Lee, K. H.; Chung, S.; Lee, J. H. Lab Chip, 2017, 17, pp 2451–2458 (ref 188), with permission of The Royal Society of Chemistry
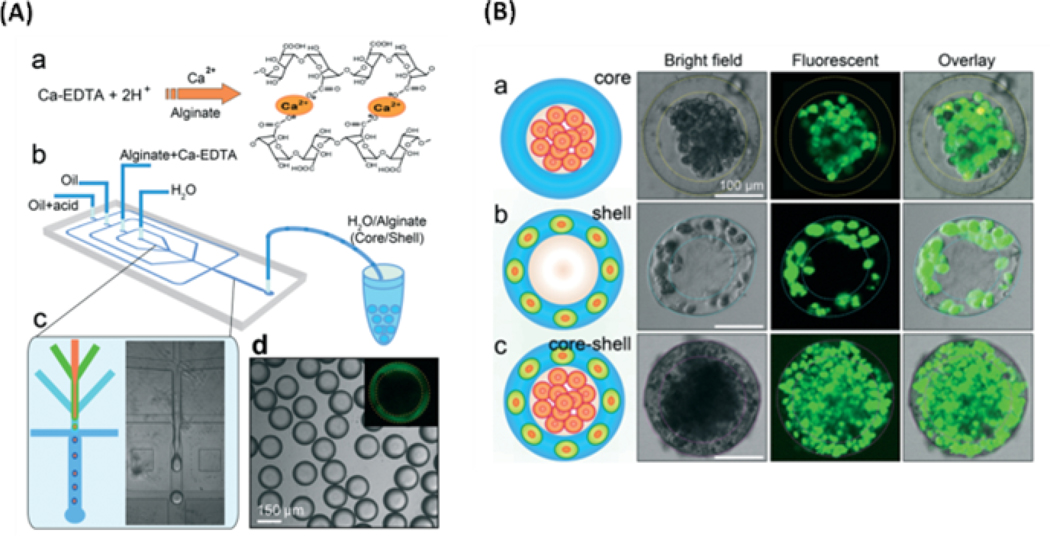
(A) Construction of the 3D core-shell scaffold: a - Crosslink of the alginate network by release of Ca2+ from the Ca-EDTA complex; b - Schematic diagram of the PDMS device; c - Fabrication of the core–shell droplets using w/w/o double emulsion as the template, in which shell algination was triggered by release of Ca2+; d - Monodisperse core–shell droplets generated using the droplet-based microfluidics. (B) Spatial assembly of different cells in the 3D core–shell scaffold: a - HepG2 cells confined in the core by the hydrogel shell; b - NIH-3T3 fibroblasts immobilized by the crosslinked alginate network in the shell; c - Simultaneous assembly of hepatocytes in the core and fibroblasts in the shell, forming an artificial liver in a drop. The scale bars are 100 μm. Caption cited and figures produced from Chen, Q.; Utech, S.; Chen, D.; Prodanovic, R.; Lin, J. M.; Weitz, D. A. Lab Chip, 2016, 16, 1346–1349 (ref 193), with permission of The Royal Society of Chemistry.
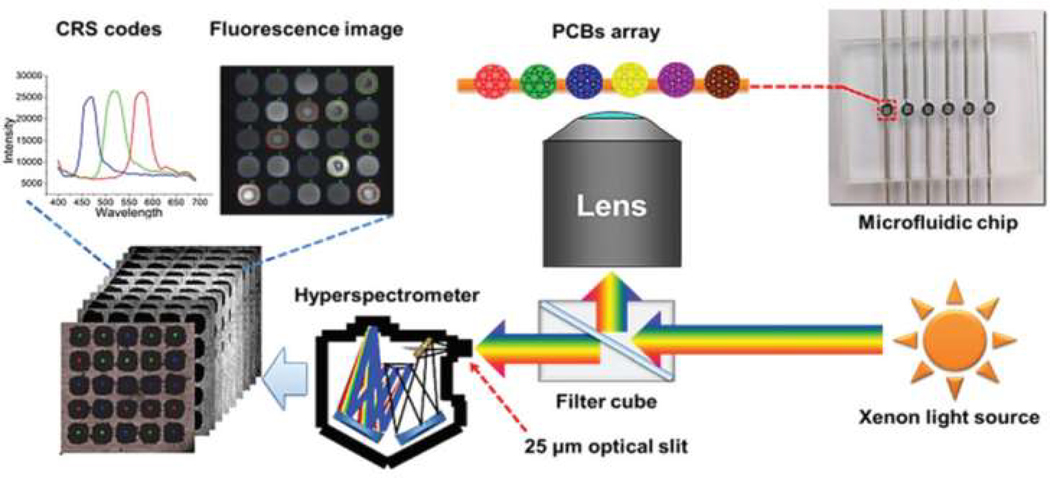
Schematic illustration of the developed hyperspectral imaging system. Reproduced from Zhao, X.; Ma, T.; Zeng, Z.; Zheng, S.; Gu, Z. Analyst, 2016, 141, 6549–6556 (ref 198), with permission of The Royal Society of Chemistry.
Similar articles
-
Luminescent nanomaterials for droplet tracking in a microfluidic trapping array.Anal Bioanal Chem. 2019 Jan;411(1):157-170. doi: 10.1007/s00216-018-1448-1. Epub 2018 Nov 28. Anal Bioanal Chem. 2019. PMID: 30483856 Free PMC article.
-
One-step engineering of silver nanoclusters-aptamer assemblies as luminescent labels to target tumor cells.Nanoscale. 2012 Jan 7;4(1):110-2. doi: 10.1039/c1nr11265a. Epub 2011 Nov 11. Nanoscale. 2012. PMID: 22080331
-
Proximity ligation assay induced and DNAzyme powered DNA motor for fluorescent detection of thrombin.Spectrochim Acta A Mol Biomol Spectrosc. 2019 Jan 15;207:39-45. doi: 10.1016/j.saa.2018.08.062. Epub 2018 Aug 30. Spectrochim Acta A Mol Biomol Spectrosc. 2019. PMID: 30195184
-
Fluorescence anisotropy: from single molecules to live cells.Analyst. 2010 Mar;135(3):452-9. doi: 10.1039/b920242k. Epub 2010 Jan 7. Analyst. 2010. PMID: 20174695 Review.
-
Aptamers facilitating amplified detection of biomolecules.Anal Chem. 2015 Jan 6;87(1):274-92. doi: 10.1021/ac5037236. Epub 2014 Nov 3. Anal Chem. 2015. PMID: 25313902 Review. No abstract available.
Cited by
-
Nanomaterials assisted exosomes isolation and analysis towards liquid biopsy.Mater Today Bio. 2022 Jul 22;16:100371. doi: 10.1016/j.mtbio.2022.100371. eCollection 2022 Dec. Mater Today Bio. 2022. PMID: 35937576 Free PMC article.
-
Rapid Ribonuclease P Kinetics Measured by Stopped-Flow Fluorescence and Fluorescence Anisotropy.Methods Mol Biol. 2024;2822:431-441. doi: 10.1007/978-1-0716-3918-4_27. Methods Mol Biol. 2024. PMID: 38907933
-
Polymerase Chain Reaction Chips for Biomarker Discovery and Validation in Drug Development.Micromachines (Basel). 2025 Feb 20;16(3):243. doi: 10.3390/mi16030243. Micromachines (Basel). 2025. PMID: 40141854 Free PMC article. Review.
-
Target-based drug discovery: Applications of fluorescence techniques in high throughput and fragment-based screening.Heliyon. 2023 Dec 19;10(1):e23864. doi: 10.1016/j.heliyon.2023.e23864. eCollection 2024 Jan 15. Heliyon. 2023. PMID: 38226204 Free PMC article. Review.
-
Virus Detection: From State-of-the-Art Laboratories to Smartphone-Based Point-of-Care Testing.Adv Sci (Weinh). 2022 Jun;9(17):e2105904. doi: 10.1002/advs.202105904. Epub 2022 Apr 7. Adv Sci (Weinh). 2022. PMID: 35393791 Free PMC article. Review.
References
-
- Arnold M; Sierra MS; Laversanne M; Soerjomataram I; Jemal A; Bray F Gut 2017, 66, 683. - PubMed
-
- Kolanowski JL; Liu F; New EJ Chem. Soc. Rev. 2018, 47, 195–208. - PubMed
-
- Ma F; Li Y; Tang B; Zhang C.-y. Acc Chem Res 2016, 49, 1722–1730. - PubMed
-
- Pastoriza-Santos I; Kinnear C; Pérez-Juste J; Mulvaney P; Liz-Marzán LM Nat Rev Mater 2018, 3, 375–391.
Publication types
MeSH terms
Substances
Grants and funding
LinkOut - more resources
Full Text Sources
Other Literature Sources
